STELLAR (XLM) LUMENS Stellar (XLM) is still in the red zone of trading. COINBASE:XLMUSD
Why is there no interest in the project of layer 1 blockchain Stellar XLM.
Moves like Tron but not Chinese. What's not to like--? Except for the fact there is little to no interest in trading Stellar now or before.
Layer1

BITCOIN BTC MARCH 13teenth 2024A quick view on the BTC chart going forward with added lines to view some ranges for price and possible future breaks or lops; 77777 looks like the price target to beat and break through based on this conjecture as taken from the 'Lark' on the tree branch and expanded using fueled theory by late. The Ideas of March.

Long SUISUI has a nice Cup and Handle pattern forming here with little volume resistance on the upside and strong volume support on the underside. Provided BTC continues it’s lead upward, alts should continue to move. Entry is 1.60 with an SL of 1.37. Target before re-evaluation will be that C&H neckline at around 1.97.

AVAX Bullish Price Action!Long opportunity here on AVAX . Falling wedge which is a bullish pattern. Price has reclaimed the .786 & POC. Target is 14% away.
Calculate Your Risk/Reward so you don't lose more than 1% of your account per trade.
Every day the charts provide new information. You have to adjust or get REKT.
Love it or hate it, hit that thumbs up and share your thoughts below!
This is not financial advice. This is for educational purposes only.

SUI SUPPORT BROKEN BEARISH BEARISH BEARISH !?!Rising wedge has failed it's support.
Correction to the downside seems like the most probably outcome.
I EXPECT LOWER PRICES IN THE SHORT-TERM! LONG-TERM STILL BULLISH!
Calculate Your Risk/Reward so you don't lose more than 1% of your account per trade.
Every day the charts provide new information. You have to adjust or get REKT.
Love it or hate it, hit that thumbs up and share your thoughts below!
This is not financial advice. This is for educational purposes only.

ETH - Patience Is Paying Off⏱Hello TradingView Family / Fellow Traders. This is Richard, also known as theSignalyst.
In accordance with my previous analysis, ETH broke above the 2420 structure and traded higher to reach our target at 2670.
📈 The bulls will remain in control as long as the 2670 holds, and our next target would be the upper bound of the blue wedge pattern and 2950 - 3000 resistance.
📚 Always follow your trading plan regarding entry, risk management, and trade management.
Good luck!
All Strategies Are Good; If Managed Properly!
~Rich

SUI Rising Wedge At PlayBearish rising wedge pattern showing on the Daily chart for SUI. With multiple bearish divergence signaling on the RSI, I suspect a drop soon. Possibly around March this year.

#SOL/USDT 1h (OKX Futures) Rising wedge breakdown and retestSolana lost 50MA and is pulling back to that resistance, seems likely to head towards 200MA support next.
⚡️⚡️ #SOL/USDT ⚡️⚡️
Exchanges: OKX Futures
Signal Type: Regular (Short)
Leverage: Isolated (5.0X)
Amount: 4.8%
Current Price:
99.17
Entry Targets:
1) 101.77
Take-Profit Targets:
1) 93.28
Stop Targets:
1) 106.02
Published By: @Zblaba
CRYPTOCAP:SOL OKX:SOLUSDT.P #Solana #SPL #PoS #L1 solana.com
Risk/Reward= 1:2.0
Expected Profit= +41.7%
Possible Loss= -20.9%
Estimated Gaintime= 2-4 days

#AMB/BTC 2D (KuCoin) Descending channel breakout and retestAir DAO (f.k.a. Ambrosus) has been moving inside a big wedge and bounced back on oversold territory, forming a morning star.
Volume has not kicked in yet but once it does, looks like it will head towards 200MA resistance.
⚡️⚡️ #AMB/BTC ⚡️⚡️
Exchanges: KuCoin
Signal Type: Regular (Long)
Amount: 3.0%
Current Price:
0.0000001743
Entry Targets:
1) 0.0000001718
Take-Profit Targets:
1) 0.0000003992
Stop Targets:
1) 0.0000001149
Published By: @Zblaba
MIL:AMB KUCOIN:AMBBTC #AirDAO #Ambrosus #L1 airdao.io
Risk/Reward= 1:4.0
Expected Profit= +132.4%
Possible Loss= -33.1%
Estimated Gaintime= 2-4 months

#SOL/USDT 8h (ByBit) Ascending wedge breakout and retestSolana just printed a gravestone doji star which may have marked the local top after such rise.
RSI got rejected on overbought territory as well, finally looks like it could correct towards 50MA.
⚡️⚡️ #SOL/USDT ⚡️⚡️
Exchanges: ByBit USDT
Signal Type: Regular (Short)
Leverage: Isolated (5.0X)
Amount: 4.8%
Current Price:
92.835
Entry Targets:
1) 94.926
Take-Profit Targets:
1) 79.273
Stop Targets:
1) 102.772
Published By: @Zblaba
CRYPTOCAP:SOL BYBIT:SOLUSDT.P #Solana solana.com
Risk/Reward= 1:2.0
Expected Profit= +82.4%
Possible Loss= -41.3%
Estimated Gaintime= 5-10 days

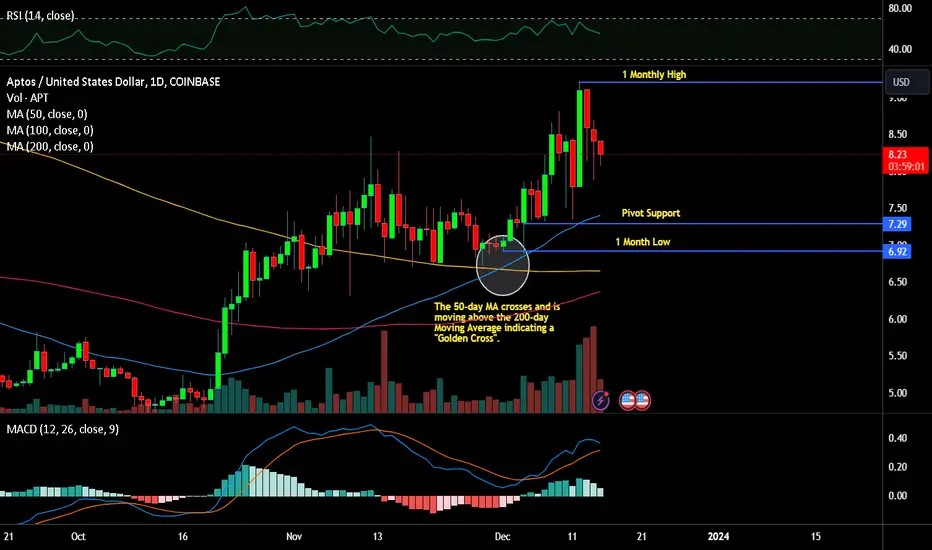
Aptos ($APT) Spectacular Growth of 200% for the Last Month
Aptos also recently hit a new high by testing the $10.95 mark. The asset has grown 200% over the last 2.5 months. Observing AMEX:APT chart reveals a notable level of correlation. This is due to both cryptocurrency networks being built on the Move programming language and sharing similar audiences.
AMEX:APT 's continued growth is the most likely outcome. In this scenario, APT might break through the $10.55-$10.95 resistance zone and test a new high, potentially at $11.5.
In the event of a correction, Aptos could retest the buyer's level at $9.25 and might also test the support zone of $8.5-$8.9. The upward trend for the asset is expected to persist as long as BTC maintains trading above the critical and psychological zone of $40,000.

Aptos ($APT) Continues Growth
APT continues to exhibit positive growth. It increased by 32% in December 2023, reaching a local high of $9.2. Currently, the coin is trading in a sideways range, with support at $8.00 and resistance at $8.75-$9.20.
If BTC maintains above $40,000, APT's growth is likely to persist. The next major target for buyers would be the psychologically significant $10 mark. Beyond this point, APT's growth could accelerate, considering its prolonged absence from these price levels, potentially rendering current resistance levels obsolete.
In a downturn scenario, APT might fall to the $7.30-$7.62 range or even test the $7 level. It's important to note that private APT investors recently unlocked a significant number of coins bought at $2-$3. Consequently, any correction in the Aptos market could exert downward pressure on its price due to the increased supply.
Sui Joins DeFi Leaders, Topping $100M in Bridged USDCOnly 7 months from the network’s launch, Sui is bridging more USDC liquidity than multiple native chains
Sui, the groundbreaking Layer 1 blockchain created by the technology experts who led Meta’s Diem blockchain initiative and created the Move smart contract language, continues its explosive ascent in decentralized finance (DeFi). This week, it surpassed $100 million in bridged USDC.
This latest data confirms Sui’s position among the ranks of the top DeFi protocols worldwide and builds upon its most recent milestone of surpassing $175 million in Total Value Locked (TVL). The Sui Network now consistently ranks within the top 25 blockchains for daily transaction volume and within the top 15 blockchains by weekly volume.
“Surpassing $100 million in bridged stablecoins represents yet another significant moment for Sui in DeFi, and is a clear illustration of the remarkable success of the Sui community’s efforts to build a versatile and accessible ecosystem,” said Greg Siourounis, Managing Director of the Sui Foundation. “Coupled with the Network’s recent surge in TVL, as well as performance measurements that show Sui operating at the forefront of Web3 technology, this milestone positions Sui as a force driving the next generation of DeFi.”
The network’s decentralized ecosystem and independent builders are fueling that growth, with seven projects standing at over $10 million in TVL and 11 projects exceeding the $2 million mark.
In another strategic move to fortify the security and reliability of its ecosystem, Sui last week announced an ecosystem investment with leading Web3 security firms OtterSec and Zellic — providing essential access for independent ecosystem projects to high-end auditing services and setting builders on Sui on a path to success.
Likewise, November alone saw $500,000 in a fresh round of Sui Grants issued to projects building on the Network. These grants are dedicated to project teams poised to advance the adoption of Sui and its growing DeFi ecosystem.

AVAX Bullish - Next move to 32ish if trend continuesAvax is looking real nice pull pennant formation
If this trend continues the next leg is likely to bring us near 32
Regardless this is a DCA for me!!
where my fellor accumulatoooorrs?

ADA PREPING FOR A 6% MOVE UP!ADA has had a slow move up and is now rangebound in a beautiful bull-flag pattern. When looking at the bull-flag, we can see that the price seems to want to move higher. If in fact it does begin to move higher and breakout, the next major resistance would be the range highs around 41 cents.
Lets stay patient and see if we will get a breakout which would mean an opportunity to long!
i]Calculate Your Risk/Reward so you don't lose more than 1% of your account per trade.
Every day the charts provide new information. You have to adjust or get REKT.
Love it or hate it, hit that thumbs up and share your thoughts below!
This is not financial advice. This is for educational purposes only.

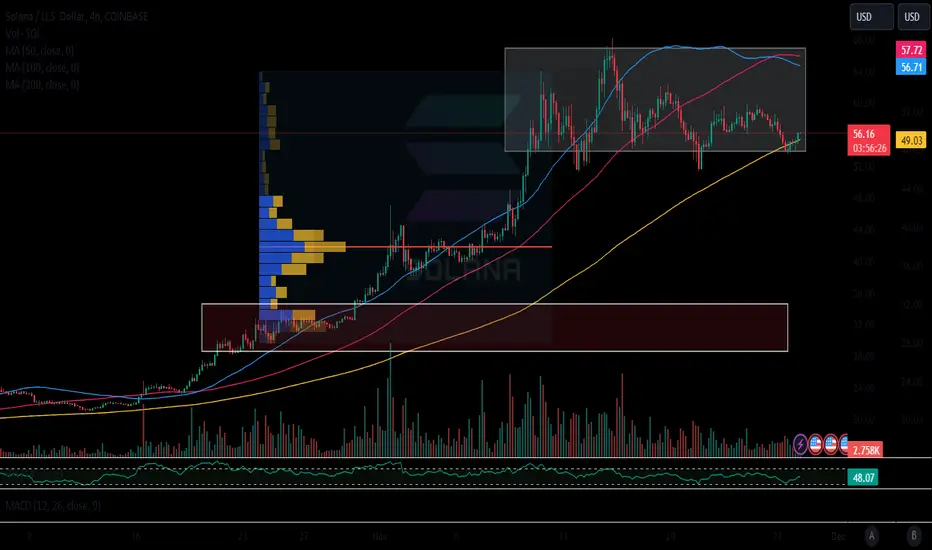
Solana (SOL) Price Surges 5% dropping Under $55, What’s Next?Ethereum Layer-1 competitor Solana has been on a downward trajectory ever since hitting its 2023 high of $68.21 earlier this month in November. The Solana price has corrected a further 5% over the last 24 hours slipping under $55 as of press time.
The Solana price has come under pressure amid the broader market sell-off with Bitcoin and altcoins both heading lower. Amid today’s price correction, SOL has dropped under its 10-day exponential moving average (EMA) at $56.53, indicating that bears are taking the upper hand over the bulls.
The good thing is that the Solana price is still trading above its 50-day and 200-day EMAs of $43.25 and $29.51. The SOL price has encountered multiple pullbacks during its continuous uptrends, often retracing to either the 38.2% or 50% Fibonacci levels.
As of now, Solana’s coin is priced at approximately $57. The potential for a bullish resurgence exists as long as it holds above the 50% Fibonacci level, situated around $42. If the bullish trend resumes, there is a possibility of prices ascending towards targets of $78.2, followed by $100 and $121.75.
SUI Surpasses APT in Trading Volume, Gearing Up to Retest $1The two newcomer Layer-1 blockchain networks Sui (SUI) and Aptos (APT) have both embarked on a double-digit bull run this November. The exponential growth of Sui Foundation’s native NYSE:SUI is ignited by the emergence of new decentralized applications on the network.
To illustrate the rapid growth of SUI’s DeFi ventures, Bluefin released a decentralized exchange (DEX) on the SUI blockchain last week. Bluefin DEX has introduced several fresh features for crypto traders, including sub-second trades and wallet-less cryptocurrency trading, making DEX trading accessible to a broader audience.
Moreover, SUI Layer-1 blockchain technology is now also home to Ribbon Finance’s Aevo decentralized exchange, which offers a wide range of futures trading. Driving demand from long-term investors, SUI’s blockchain topped rival Aptos in trading volume.

Indecision Zone then Massive Move | Short BiasOn week chart
The first sign what I see is the big indecision candle last week
Besides, the level $6 is also Golden Ratio 0.618 FibRe.
I'm waiting for breakout or breakdown to trade on lower timeframes
Time will tell

Radix waking up!? (Ultimate)Hi.
I was supposed to put out this analysis a few days ago. Sorry about that.
I have been waiting for a while for this $0.05 to break.
Many price suppression levels are broken, if we do close above $0.05 .
-Vertical trendline (red arrows)
-Lowering trendline (blue arrows
Both have shown many times their importance , by how price has reacted to them.
First resistance $0.0556-0.058, after that $0.74, $0.11, and $0.14.
I am waiting for higher prices. Smart Contracts went "online" 2 months ago and TVL is just about to hit 20 Million!
TON demonstrated staggering speed on 104k TPS , which is claimed to be the fastest blockchain in the world.
This has woken up the Radix community and founder Dan Hughes to break the 104k record and previously demonstrated over 1 mil TPS on Radix
I wrote a small post on X week ago, about Radix's progress after Babylon Update . I suggest you check it out, but be careful if you deep dive on XRD! You might experience #RadixRevelation!
This is the only Crypto project which I did accumulate on the bear market. I Have had a close eye on it.
This is not a financial advice!

KASPA --- BREAKING OUT!Should be a nice trade to the upside
enjoy!
and fulfil our 20c (or close to 20c --- could be front ran) target

#AVAX/BTC 1D (Binance) Falling wedge on supportAvalanche printed a morning star, seems likely to bounce back towards 100EMA resistance.
⚡️⚡️ #AVAX/BTC ⚡️⚡️
Exchanges: Binance
Signal Type: Regular (Long)
Amount: 13.4%
Current Price:
0.0003157
Entry Targets:
1) 0.0003101
Take-Profit Targets:
1) 0.0003796
Stop Targets:
1) 0.0002869
Published By: @Zblaba
CRYPTOCAP:AVAX BINANCE:AVAXBTC #Avalanche #L1 avax.network
Risk/Reward= 1:3
Expected Profit= +22.4%
Possible Loss= -7.5%
Estimated Gaintime= 3-7 weeks

Reversal Pattern, A Triple Bottom | Long BiasOn Week TF
Easily spot the reversal pattern which is triple bottom.
Now, Fantom is trading at 0.231x and will being move up to resistance 0.33
Fantom is trading in Triangle Pattern so wait for a breakout

TOMO serving a Coffee Lungo CupBINANCE:TOMOUSDT
Dear Listeners, Readers and Grey haired on their 30's, welcome to my first TV page. I've been on a regular TV but it's time to move on, right?
You will see these posts as Andrii Vision's, but sometimes I think my second name should be Groening. IYKYK.
So, let's go to the topic.
Shortly: OMXSTO:TOMO : $0,9 BUY, $2,9 SELL
Ok, the signal lovers has already got for what they've been looking for, now more details for the deeper audience that I'm eager to gather here (If you know such people, just subscribe, comment, share your thoughts, let's create the better future together)
I really appreciate when the projects think long terms, use philosophy and heading to the guiding light that is creating the better world. And from what I can see and read, TOMO is the one. Besides the Blockchain, they've JUST (21st Aug) started TOMO Foundation, where you can read all the vision they have and the reasons of it. As well as they've began an ambassador's program, so they'll be shilled hard in the coming months.
As all of their tokens are already distributed (apart of those that are distributing as the block rewards to the miners) and the project started its path on 2018, their technicals are kind of repeating their vision's mechanics and forming a very long going structures.
As of now, I see such a huge Cup, that its handle take 4 months to be fully sculpted.
Zones of entering:
- Now (If the handle is actually the ascending triangle, not a flag)
- At $1-0,9 zone, if there will be a change to buy in
All of above, Foundation, Ambassador program, their activity on web just adds confidence into my words.
Share your opinions here, would love to see your takes or some more info about the project, too. Or, if you want me to become your ambassador, dear TOMO TEAMO, you know where to find me :)
