TradeCityPro | APT: Triangle Squeeze Near Crucial Support Zone👋 Welcome to TradeCity Pro!
In this analysis, I’ll be reviewing the APT coin. The Aptos project is one of Ethereum’s Layer 2 solutions.
✔️ This project’s token currently holds a market cap of $3.1 billion and ranks 32nd on CoinMarketCap.
📅 Daily Timeframe
On the daily chart, you can see a very strong support level at 4.718, which has been tested multiple times. The price has once again reached this zone.
💥 A descending trendline can also be drawn, showing clear reactions from the price. The area between this trendline and the 4.718 support forms a triangle pattern.
⭐ If the 4.718 support breaks, a short position could be considered. A breakdown below 37.78 on the RSI would serve as strong confirmation of bearish momentum.
📉 The initial target for the short would be 4.338. However, if a new bearish leg forms and the market heads toward lower lows, a drop toward the 3.12 support level is also possible.
📊 Confirmation of a bullish reversal would come from a breakout above the descending trendline. If this trendline is broken and the 6.152 trigger activates, it would justify opening a long position or even buying in the spot market.
🛒 When it comes to spot purchases, the most important factor is a trend reversal in Bitcoin dominance. Personally, I do not buy any altcoins on spot until Bitcoin dominance shifts downward on the daily chart — I only trade them in futures.
📝 Final Thoughts
This analysis reflects our opinions and is not financial advice.
Share your thoughts in the comments, and don’t forget to share this analysis with your friends! ❤️
Layer2

TradeCityPro | STX: Watching Triangle Breakout and RSI Reaction👋 Welcome to TradeCity Pro!
In this analysis, I’m going to review the STX coin, which belongs to the Stacks project—a Layer 2 solution for Bitcoin.
🔍 STX, with a market cap of $1.45 billion, is currently ranked 59 on CoinMarketCap.
🔄 In the previous analysis, I drew an expanding triangle and mentioned that if this triangle breaks to the upside, we can enter a long position or even make a spot purchase.
✨ The trigger for the triangle breakout was at the 0.731 level. After breaking out and pulling back to this level, the price moved up to 1.049 and is now once again in a consolidation phase.
📅 Daily Timeframe
Currently, after RSI got rejected from the 73.58 zone and exited the overbought area, the price has undergone some correction. A pullback to the 0.871 level is possible.
🧩 If a pullback or deeper correction occurs, as long as RSI remains above 50, I still consider the market momentum to be bullish and believe the price can continue moving upward.
📈 If we see a solid bullish candle confirming continuation, we can enter a long position. However, the main long trigger is the breakout of 1.049. The RSI trigger for sharper moves would also be a breakout above 73.58.
📊 The next resistance level is at 1.332. If this level breaks, the coin enters a new price zone, and we’ll need to see whether it can establish support above that area.
🔽 For a bearish scenario, we should wait for the market to form a structure and provide a valid trigger to confirm a short position. At the moment, it’s better to wait for that setup.
🔑 If the market turns bearish, the key support zones to watch are 0.731, 0.571, and 0.453, which could potentially halt further decline.
📝 Final Thoughts
This analysis reflects our opinions and is not financial advice.
Share your thoughts in the comments, and don’t forget to share this analysis with your friends! ❤️

TradeCityPro | APT: Testing Momentum After Key Breakout👋 Welcome to TradeCity Pro!
In this analysis, I want to review the APT coin for you. This coin belongs to the Aptos project, which is one of Ethereum’s Layer 2 solutions.
⚡️ APT, with a market cap of $3.6 billion, is currently ranked 32 on CoinMarketCap.
⏳ 4-Hour Timeframe
As you can see in the 4-hour timeframe, after finding support at the 4.687 zone, the price made a very sharp bullish move and reached 5.708. After an initial rejection, it has now managed to stabilize above this level.
🔍 If this bullish move continues, we could see another upward leg, with the next resistance at 6.047. If this level breaks, the price could move up to 6.752.
✔️ There’s a very important RSI ceiling at 80.76, which has consistently caused rejections after sharp upward moves. If the price aims for another bullish wave, this level will be critical and could mark the top of the move.
⭐ A breakout above this level seems unlikely for now, since 80.76 is a very high reading for the RSI oscillator, and the chance of it breaking is quite low. But if it does happen, we could see an extremely sharp and unusual move.
🔽 As for a bearish scenario and short positions, we currently need to wait for a trend reversal. If the breakout above 5.708 turns out to be fake and the price starts moving downward, we can look for a trigger in a lower timeframe to enter.
🔑 But keep in mind that short positions in these market conditions are very, very risky. And if you do open such a position, make sure to secure profits frequently with small risk-to-reward setups.
📝 Final Thoughts
This analysis reflects our opinions and is not financial advice.
Share your thoughts in the comments, and don’t forget to share this analysis with your friends! ❤️

Bitcoin Total Market Cap Update – Strategic Scenarios AheadAs of May 8, 2025, the total cryptocurrency market capitalization stands at approximately \$3.012 trillion, reflecting a 2.17% increase from the previous day . Bitcoin's market cap is around \$1.962 trillion, with a current price of \$98,798.11 .
Given these figures, we are considering the following potential scenarios for the crypto market:
---
1. Break Above \$3T and Hold ✅ (30% Probability)
* The market breaks through the \$3 trillion level.
* Retests it as support.
* Continues the bullish momentum from there.
---
2. Rejection and Consolidation 🔁 (50% Probability)
* Price gets rejected at \$3T.
* Moves sideways between \$2.8T and \$3T.
* Eventually breaks out and retests \$3T as support before resuming upward.
---
3. Bearish Turn Below \$2.8T 🔻 (20% Probability)
* Rejection at \$3T.
* Market loses \$2.8T support.
* Retests \$2.8T as resistance, followed by further downside pressure.
---
Key Levels to Watch
* \$2.8T and \$3T are critical zones. Movements between these levels indicate uncertainty and should be approached with caution.
---
Our Perspective
A retest of \$3T as support could present the strongest buying opportunity of this cycle. We urge everyone to stay alert, analyze carefully, and prepare accordingly.
Golden Cross is looming — remain focused and disciplined.
---
Stay updated and connected:
With best regards,
Team ProCryptoEdge
Educate. Empower. Elevate.

STX entry 1.8 to 2.06 through 4.Stacks ($STX) is a layer 2 (or as described by Stacks as a Layer 1.5) smart contract protocol that lives on the Bitcoin blockchain. Via Stacks DeFI and other utility/protocols including City Coins (currently being minted by New York City and Miami and soon Austin and others), while other DeFi platforms built for Bitcoin live on other layer 1's (i.e. Badger on Ethereum), a smart contract protocol on top of the most secure blockchain may or should not only assist in avoiding a "flippenning" but is critical at a time where multi/cross/para chains are the current solutions to avoid bouncing protocol to protocol.
Additionally Stacks was both the first cryptocurrency to be acknowledged by the SEC as a security and also to be no longer recognized as a security by the SEC after successful adoptions. DYOR, Grayscale and partners have significant involvement in Stacks and was instrumental in the SEC approvals. This is pure gut but my gut says Grayscale will be the first BTC ETF approved by the SEC due to familiarity, etc.
Fractals show a similar pattern having already taken place, expect a full push or a pullback and then push to and through $4. Naturally as tied to Bitcoin, BTC volatility could slow or speed up the growth of STX, but smart contracts on the Bitcoin blockchain is powerful and not discussed nearly as much as one would expect.
The stacking opportunities and ecosystem being built around Stacks i.e. City Coins (read NY and Miami Mayoral comments on plans) make this a long term hold for those who want, as blockchain continues to proliferate real world applications beyond just crypto.

Why Ethereum Could 10x in the Next Few Years🚀
1. Ethereum ETF Approval
ETFs are approved in the U.S. (similar to the Bitcoin ETFs in early 2024), institutional money will flood in.
Grayscale, BlackRock, and others have already filed.
Ethereum’s price jumped significantly after similar events in the past.
2. Deflationary Supply (Post-EIP-1559)
Since EIP-1559, ETH has been burned with every transaction.
Combined with Proof-of-Stake (The Merge), ETH is now net deflationary during periods of high network activity.
3. Layer 2 Ecosystem Is Exploding
Rollups (Arbitrum, Optimism, Base, zkSync) are scaling Ethereum.
These L2s settle on Ethereum L1, driving fees and activity.
Vitalik’s "rollup-centric roadmap" is playing out — this benefits ETH long-term.
4. Real Yield from Staking
Ethereum now offers a real, sustainable yield from staking (~3–5%).
Institutions love yield. ETH becomes more like a productive asset, not just a speculative token.
5. Ethereum as the Base Layer of Web3
DeFi, NFTs, gaming, DAOs — Ethereum is still the dominant smart contract platform.
The most secure, battle-tested, and widely adopted chain.
Developers and enterprises continue to build on Ethereum over competitors.
6. Macro Tailwinds
As the U.S. moves toward looser monetary policy, risk assets (including crypto) historically benefit.
Crypto adoption is growing globally — from Latin America to Asia — and Ethereum is often the entry point.

TradeCityPro | STX: Watching for a Breakout in Bitcoin’s L2 Star👋 Welcome to TradeCity Pro!
In this analysis, I want to review the STX coin for you. This coin is one of Bitcoin’s layer-2 projects and, with a market cap of $933 million, ranks 67th on CoinMarketCap.
📅 Daily Time Frame
In the daily time frame, as you can see, this coin has been in a downtrend. Its most recent upward move began after breaking 1.332, and then it dropped within an expanding triangle structure down to the 0.533 area.
🔍 Currently, the main price support is at 0.453, which the price hasn't reached yet, but the 0.533 area is also strong and could mark the end of the downtrend.
✨ If the price bounces from the 0.533 area and starts moving upward, the likelihood of the triangle breaking to the upside increases. Since the price hasn’t reached the triangle’s bottom and could form a higher low, bullish momentum may enter.
📊 Market volume during the last bearish leg was decreasing, and now with supportive candles forming, volume is increasing—which, if it continues, also increases the likelihood of the triangle breaking.
🛒 If this happens, the buy trigger in spot is at 0.731, which, besides being suitable for a spot entry, can also provide a good futures position in lower time frames.
✔️ The RSI oscillator is also near the 50 level, and if it breaks above that and moves up, the price can head toward higher targets.
📉 On the other hand, for short positions, the 0.533 support is very important, and breaking it could justify opening a short. But note that this area is very close to 0.453, so if you're opening a short, be aware it's very risky and the price could reverse at any moment.
❌ If you already hold this coin and are looking for a good stop-loss level, a break and confirmation below 0.453 is appropriate. However, keep in mind that if your stop-loss is triggered and the price moves back above the support area, you should find a new trigger and buy again so you don’t miss the move.
📝 Final Thoughts
This analysis reflects our opinions and is not financial advice.
Share your thoughts in the comments, and don’t forget to share this analysis with your friends! ❤️

The Dump & Hold Strategy ($70.94 SOON?)URGENT INSIGHTS:
According to my charts, we're either heading into a crappy 20-year downturn... or a 11,000% increase to $70.94 upside depending on your position!
It is now simultaneously optimal to short while going long and/or sell pre-buy, unless of course you're bullish, in which case ensure your purchase precedes your liquidation, but only if your gains are already post-realized prior to any re-entry in either direction, but be sure to hedge.
JUST REMEMBER:
No matter how long the struggle, there’s always relief.
I'm not a financial advisor.

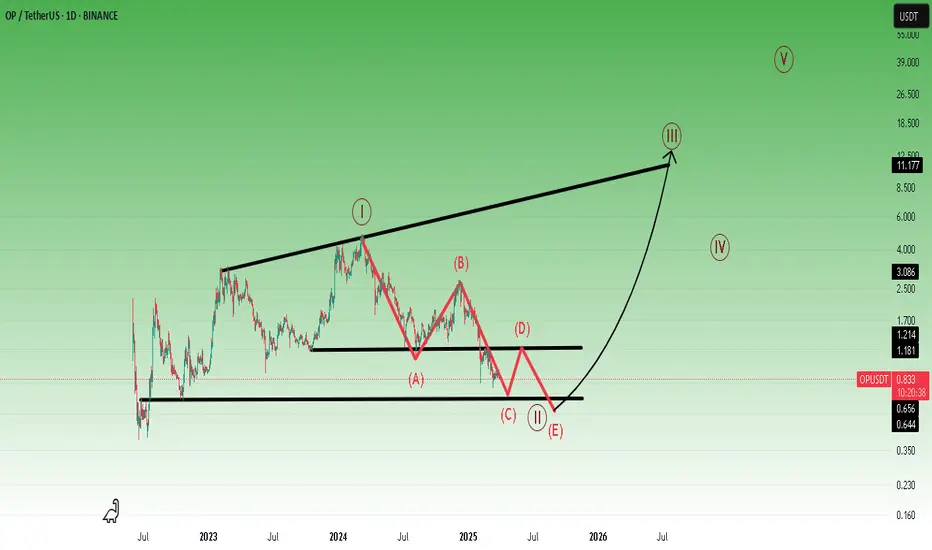
I am very optimistic about Optimisim in the long term.But first, let's go a little deeper.
* What i share here is not an investment advice. Please do your own research before investing in any asset.
* Never take my personal opinions as investment advice, you may lose all your money.
Time to buy? STXUSDT
You can see the support line is broken down last week. Now, it's trading around 0.62x, do you think can buy this time, this price?
I think not yet. I expect BINANCE:STXUSDT hit the first all time high zone 0.4-0.5
So wait and see

Univers Of Signals | SUI👋 Welcome to Univers Of Signals Channel!
Let's analyze and review one of the most popular coins in the market, sui, and update our previous analysis and find new triggers
🌐 Bitcoin Overview
Before starting today's altcoin analysis, let's look at Bitcoin on the 1-hour timeframe. Since yesterday, Bitcoin experienced a correction, which was necessary for the market, and it pulled back to the 102135 range. The next trigger for a long position will be a breakout above 104714.
Yesterday's correction, coupled with an increase in Bitcoin dominance, caused noticeable declines in some altcoins. This highlights the importance of monitoring BTC pairs in your checklist these days.
📊 Weekly Timeframe
In the weekly time frame, it is one of the coins that is in good condition, it is really in the market and is still fluctuating on the high support levels.
After hitting 5.24, we made a new ceiling or ATH, and after that, due to recent market news, we experienced some drops, and this has also caused the price correction of this coin.
For re-buying, if we make a good support candle at this level 2.4, it will be a good trigger and the main trend will start again after we break 5.24. Also, after breaking 1.77, we can temporarily exit this coin and cash out!
📈 Daily Timeframe
In the daily time frame, it has been in relatively good conditions compared to other coins in the market and has experienced fewer declines and still has a lot of support to lose!
After breaking the 1.0333 level, which was our trigger spot, we made our purchase and experienced a move after its failure with the entry of momentum and recorded a new ceiling with this event!
Along with this trend, we can draw our Fibonacci levels, which are currently involved in the important level of 0.382, and after it rises and breaks the ceiling of 5.24, we can experience a powerful move!
If this level is broken, we can also hit the support levels of 1.7702 and 1.3859 and we need to form a structure to buy now, but after breaking the trend line and the 3.65 trigger, it can be a good point! For selling, I will continue to hold for now!
📝 Final Thoughts
Stay calm, trade wisely, and let's capture the market's best opportunities!
This analysis reflects our opinions and is not financial advice.
Share your thoughts in the comments, and don’t forget to share this analysis with your friends! ❤️

TradeCityPro | STXUSDT Reached Weekly Support👋 Welcome to TradeCityPro Channel!
Let's go together to analyze and review one of the popular cryptocurrency coins and Bitcoin's second layer and update our triggers
🌐 Overview Bitcoin
Before starting the analysis, I want to remind you again that we moved the Bitcoin analysis section from the analysis section to a separate analysis at your request, so that we can discuss the status of Bitcoin in more detail every day and analyze its charts and dominances together.
This is the general analysis of Bitcoin dominance, which we promised you in the analysis to analyze separately and analyze it for you in longer time frames.
📊 Weekly Timeframe
On the weekly time frame, stx is one of the coins that started its upward trend before the start of 2024, which caused the formation of its ATH and new ceiling
You can also see one of the best weekly trends in this coin, which is that after each time we hit this support trend line, we rose and made a sharper move.
Also, when this trend line was broken, we made a pullback to it and as we had given the weekly exit trigger with a break of 1.299 in the previous analysis, after the break of the trigger of the trend line, we experienced a sharp decline and reached the support level of 0.796 and now we need to form a structure.
📈 Daily Timeframe
On the daily time frame, but after the rejection of the important weekly resistance 2.745 and getting rejected, we started to correct the price and fall until this price correction turned into a trend change in the daily time frame
After forming the lower ceilings and floors, we reached important support and the trigger for the spot exit, which after the daily failure and pullback to that daily candle, engulfed the previous 3 candles and caused further decline, which led to us reaching the important support of 0.859
Currently, after hitting the support of 0.859 twice, our fall volume has not increased much and it can be said that the sellers do not intend to take the price below 0.859 for the time being, and this will cause us to go into the range and form a new structure. However, I will open a short with a failure of 0.859, but there is no buying at the moment.
⏱ 4-Hour Timeframe
We suffered enough in the four-hour time frame and formed a structure and we are in a range box that we can take a position from both sides
📉 Short Position Trigger
For my short position I open a position with a break of 0.859 and accept the stop loss. Since it is an important support, I try to place my stop loss in a logical space and not make it small.
📈 Long Position Trigger
For the long position, we have two triggers, one risky and one somewhat certain. You can open a position with a break of 0.953 and 1.005, respectively. The difference is that with a break of 0.953, the possibility of a stop loss is higher, and with a break of 1.005, the possibility of losing the position is higher. I choose to take the stop loss myself.
📝 Final Thoughts
Stay calm, trade wisely, and let's capture the market's best opportunities!
This analysis reflects our opinions and is not financial advice.
Share your thoughts in the comments, and don’t forget to share this analysis with your friends!

CHEAP DEX's are a proven crypto technology...are straightforward to grasp and this sector is likely to experience a rebound from these low points. Following a Memecoin downturn, they should attract greater investor interest and capital influx.
Kicking off with #JOE
Year Founded: Trader Joe emerged in 2021 and has swiftly established a solid standing in the DeFi landscape. Its ongoing innovation and growing user base highlight its dependability and potential for expansion.
Reputation and Reviews: Users have lauded Trader Joe for its user-friendly interface, minimal transaction fees, and extensive array of DeFi offerings. The community-focused support system and attentive moderators further bolster its standing.
Security Methods: The platform implements stringent security protocols, including routine audits by esteemed firms like HashEx and Paladin. This guarantees the reliability and safety of its smart contracts, instilling confidence in users regarding the platform’s security.
Transparency: Trader Joe is open about its operations, consistently sharing audit findings and engaging with its community through social media and other channels. This dedication to transparency fosters trust and accountability.
Volume Managed: Trader Joe handles significant trading volumes, highlighting its popularity and reliability. Elevated trading volumes also enhance liquidity, facilitating smoother trade executions for users.
Trader Joe emerges as a dynamic decentralized exchange (DEX) on the Avalanche network, providing a comprehensive range of DeFi (decentralized finance) services such as trading, yield farming, staking, and lending.
At a price below 25 cents, it should be taken into account for potential increases.

COQ Inu: The Memecoin Poised for a 300% Surge on AVAX BlockchainCOQ Inu, the #1 memecoin built on the Avalanche (AVAX) blockchain, has emerged as a standout contender. Despite a recent drop from its all-time high market cap of $400 million to $80 million, technical and fundamental analysis suggests that COQ Inu is gearing up for a potential 300% surge, which could propel its market cap back to $100 million and beyond.
Technical Analysis
The chart patterns for COQ Inu reveal a compelling story. After a significant correction from its peak, the coin is now showing signs of consolidation, with key indicators pointing to an impending breakout. Here’s what the technicals are saying:
The RSI, a momentum oscillator that measures the speed and change of price movements, currently stands at 63.31. This indicates that COQ Inu is neither overbought nor oversold, but rather in a healthy position to potentially initiate another leg up. An RSI above 50 typically signals bullish momentum, and with the current reading, COQ Inu is primed for upward movement.
The 38.2% Fibonacci retracement level is acting as a strong support for COQ Inu. In the event of a pullback, this level is expected to hold, providing a solid foundation for the next upward move. However, a break below this level could see COQ Inu testing its 1-month low, which would be a critical point for traders to watch.
A breakout above the 1-month high pivot could serve as the catalyst for the anticipated 300% surge. Such a move would not only validate the bullish sentiment but also attract new investors looking to capitalize on the momentum. The 1-month high pivot is a key resistance level, and a decisive break above it could trigger a significant upward trajectory.
Market Position and Potential
Currently ranked #425 on CoinMarketCap with a live market cap of $81 million, COQ Inu has already established itself as a significant player in the memecoin arena. With a circulating supply of 69.42 trillion COQ coins, the coin’s low price per unit makes it accessible to a wide range of investors. The potential for a 300% surge could see COQ Inu’s market cap reach $200 million, placing it among the top memecoins in the market.

TradeCityPro | MNT: Deep Dive into Mantle's Market Dynamics👋 Welcome to TradeCityPro!
In this analysis, I want to examine the coin MNT for you, which was requested in the comments. So, if you want a particular coin analyzed, feel free to mention it in the comments, and I will review and analyze it for you.
👀 Mantle project is one of the Ethereum Layer-2 projects, and its official coin is MNT. Like other Ethereum Layer-2s, its aim is to provide greater scalability, faster transactions, and lower fees. Let's proceed to technically analyze this coin.
📅 Weekly Timeframe
In the weekly timeframe, as you can see, there aren't many candles in the chart since the project is set for 2024, and it hasn’t been long since the coin was listed. As you can observe, the price is in a large range box from $0.5443 to $1.4049, hitting the bottom and top of this box several times in this timeframe.
📊 The market volume is ranging, and it seems that there hasn't been much difference in the inflows and outflows of money in this range box. The most critical trigger for buying spot right now is the breakout of $1.4049, which is the ATH resistance of this coin. If this resistance is broken, the price could move towards higher targets. If this resistance is breached, I will update the analysis for you and review the upcoming resistances and potential targets together.
✨ Besides these two important areas, there is also the $0.8946 area, which seems very important, and as you can see, the price has had many contacts with this area in the shadow in this timeframe. The main support, as mentioned, is at $0.5443, and if this area is broken, we could say that the trend of this coin will be bearish.
📉 The last support, which is also the main price floor and ATL, is $0.3197, which could be the first bearish target if this coin becomes bearish. Given the small number of weekly candles, I don't see any other specific data in this chart, so it's better to move on to the daily timeframe to see the market with more detail.
📅 Daily Timeframe
As you can see in the daily timeframe, we can examine the price movements with much more detail, and as you see, there was a box between the area of $0.5453 to $0.6533, where the ascending trend of this coin started after breaking the top of this area and continued up to the area of $1.3961.
🔍 After the price reached this area and completed its ascending leg, a new box was formed, with the bottom of this box at $0.9490 and the top, as mentioned, at $1.3961.
🔽 The price has tested the floor and ceiling of this box several times and is currently near the box's floor. Therefore, if the floor of the box breaks, we can expect further corrections, which might reach the 0.618 and 0.786 Fibonacci areas, where the 0.618 area corresponds to $0.7736, and the 0.786 area roughly overlaps with the $0.6533 support.
⚡️ In RSI, as you see, we have a very good area where the floor is 41.97, and the ceiling is 55.86. Breaking either of these areas could indicate the entry of momentum in that direction in the market.
💥 The market volume is decreasing after reaching the box's ceiling, indicating that a market movement is approaching. Therefore, you can enter a position if the ceiling or floor of the box breaks. I suggest you keep an eye on it to do so. An earlier trigger for a long would be 1.2341.
⏳ 4-Hour Timeframe
In this timeframe, I want to specify only the futures triggers for you because we have already performed the analysis in higher timeframes, and there is no need to repeat the same discussions.
🔑 For a short position, you can enter if 1.0062 breaks. I don't see a good area in RSI for a break and the entry of bearish momentum. However, the main short position, which would be if 0.9490 breaks, could overlap with a break of 30 in RSI.
📈For a long position, you can enter if 1.0685 breaks, but this position is very risky, and the main long positions would be if 1.2341 and 1.3961 break. A break of 55.86 in RSI could be a suitable confirmation for a risky long position and might overlap with the area of 1.0685.
💫 Market volume has decreased significantly in recent days. As I mentioned in the Bitcoin analyses, so be aware that, as I said, when the volume decreases and reaches its possible minimum, the market movement will be much easier, sharper, and faster.
📝 Final Thoughts
This analysis reflects our opinions and is not financial advice.
Share your thoughts in the comments, and don’t forget to share this analysis with your friends! ❤️

Bitcoin's Leading L2Crazy to see STX took a hit this hard, maybe because it's just another EVM.....but is it? This may just be BTC's quantum computing shield in the future. This large discount brings you great opportunity. May take up to two years for 450% gains. I have started accumulating.

TradeCityPro | ARBUSDT The Most Important Support of Its Life👋 Welcome to the TradeCityPro channel!
Let's analyze and review one of our important Layer 2 projects, which is currently at one of its most critical support levels, and update our previous analysis.
🌐 Overview Bitcoin
As always, before starting our analysis, let’s take a look at Bitcoin on the one-hour timeframe. We have settled down a bit compared to yesterday's fluctuations, but it’s still not a great time to open futures positions because any news can trigger stop-losses.
However, if you insist on opening a position, the breakout of 100,026 wouldn’t be a bad entry, but you must reduce your risk. These days, it’s better to be an observer in futures trading. On the other hand, Bitcoin dominance is also crucial with this level’s breakout—if it turns green, you can open a position; otherwise, it’s better to switch to an altcoin or not open any position at all.
🕵️♂️ Previous Analysis
In our previous Arbitrum analysis, we had a more bullish outlook and were waiting for a breakout of 0.9689 on the four-hour timeframe to open a long position. This breakout happened, and we experienced a clean move up to the 1.2364 resistance level.
📊 Weekly Timeframe
On the weekly timeframe, we clearly see a rejection from the 1.1887 resistance, which was previously tested as a pullback. Now, this level has become even more significant, and after rejection, we reached the critical level of 0.4792.
If you had bought earlier after the breakout of 0.6487, taking profit at 1.1887 was very logical—either securing profits or withdrawing your initial capital. If you didn’t take these actions, you likely hit your stop-loss by now. However, if you managed your capital properly and only lost a maximum of 2% of your funds, then nothing major has happened. Taking profit at 1.1887 was the smart move.
This weekly candle is one of the most volatile we’ve seen recently for ARB, dropping 30% in a single day before recovering. If it closes green or even slightly higher with better volume, it could act as an entry trigger for those whose strategy aligns with it. However, I personally prefer to see some ranging first and enter on a different timeframe to follow the movement.
📈 Daily Timeframe
Yesterday’s daily candle was truly impressive and showed the strength of buyers. Under normal market conditions, I would have bought with this candle, anticipating the start of an uptrend.
However, this candle was mainly driven by emotions and FOMO, and many traders still don’t fully grasp the consequences of their decisions—they might realize it in the coming days. That’s why this candle doesn’t convince me, and I’m not buying based on it.
Now, you might think, “What if this is the best entry point?” Personally, I would be much happier if price makes a sharp move up to 0.6487 with momentum—this would provide a more confident entry with a tighter stop-loss. In that scenario, both positions would reach their risk-to-reward targets up to 0.9178, but my entry would be more secure, and I could allocate more capital.
If the daily candle closes below 0.4792 and RSI enters the oversold zone, ARB’s situation will worsen significantly, potentially forming new lows. That wouldn’t be good and could lead to deeper corrections.
📝 Final Thoughts
Stay calm, trade wisely, and let's capture the market's best opportunities!
This analysis reflects our opinions and is not financial advice.
Share your thoughts in the comments, and don’t forget to share this analysis with your friends! ❤️

$Azero Probably Yes!We are witnessing a r-testing period after Aleph zero's current falling trend breakout.

AVAX Can harness gaming for a great second cycle!Avalanche ( CRYPTOCAP:AVAX ) is an innovative Layer 1 blockchain designed to compete with Ethereum in terms of smart contract capabilities, scalability, and transaction speed.
Launched in 2020, it has quickly gained traction among developers looking to create decentralized applications.
With its compatibility with the Ethereum Virtual Machine (EVM), developers can effortlessly write smart contracts in Solidity, facilitating a smooth transition from the Ethereum ecosystem.
The Avalanche network leverages subnets to enhance its transaction capacity, boasting the ability to process up to 6,500 transactions per second (TPS). Additionally, it features a limited supply and operates on a deflationary model.
Ethereum has yet to dent Bitcoin dominance and ignite a widespread altcoin season.
Currently, the sentiment surrounding ETH is at a historic low, and its price remains well below its previous peak. This situation creates a unique chance to transform fiat currency into investments in top blockchain projects, AVAX being a good example, enhancing one's investment portfolio.
@TheCryptoSniper
#HVF
#HuntVolatilityFunnel

TradeCityPro | MNT: Layer 2 Project's Market Movements👋 Welcome to TradeCityPro!
In this analysis, I will review the coin MNT, a layer 2 project that has experienced significant growth in recent months.
📅 Weekly Timeframe: Engaged with ATH Ceiling
In the weekly timeframe, as you can see, there is limited data, and since the inception of this coin, it has created a significant ceiling at 1.4264, which it has touched twice and is currently being rejected from again.
🧩 The main supports are at 0.5450 and 0.3278. The SMA25 also acts as dynamic support. Due to limited data in this timeframe, it's better to move to the daily timeframe for a more detailed chart analysis.
📅 Daily Timeframe: Beginning of the Next Correction Wave
In the daily timeframe, we observe a strong upward trend starting from a low of 0.5450, reaching up to 1.3997, and forming a range box between 1.0861 and 1.3997.
🔽 Currently, the price is breaking the floor at 1.0861. This area is critical as the price has historically reacted to it, and it coincides with the 0.382 Fibonacci level. If this floor breaks, the price could move towards the 0.618 and 0.786 Fibonacci levels.
✨ The RSI oscillator, with its break below 50, has activated a negative divergence in the market, and with the increasing volume of sales, the likelihood of starting the next correction wave is high.
🛒 If the price returns above 1.0861, the trigger at 1.3997 will be suitable for buying in spot. Otherwise, you should watch for the price reaction to upcoming supports.
⏳ 4-Hour Timeframe: Futures Triggers
In the four-hour timeframe, I will only examine futures triggers.
🔼 For long positions, the first trigger is 1.1478, which has shown to be a strong level as the price has already pulled back to it once, highlighting its importance. If this area and 54.85 are broken, more bullish momentum will enter the market, potentially moving the price towards the main resistance at 1.3997.
📉 For short positions, the first trigger is 1.0311, which the price has already reacted to. If the price consolidates below this area, we can expect it to reach 0.8718. Additional triggers might include Dow Theory and breaking lower lows for further positions.
📝 Final Thoughts
This analysis reflects our opinions and is not financial advice.
Share your thoughts in the comments, and don’t forget to share this analysis with your friends! ❤️

Breaking: $DELAY Set for 100% Surge After Days of Consolidation$DELAY, the first memecoin-focused Layer 2 blockchain built on Ethereum, is making waves with a potential 100% price surge. After a week-long correction, the token’s chart patterns and technical indicators point to a bullish breakout, making it a key player in the crypto market.
Technical Outlook
Since its launch on November 14, 2024, $DELAY has experienced an incredible 30,000% increase, showcasing its immense potential. However, after hitting its peak, the token underwent a correction phase. Now, technical indicators suggest a strong bullish setup:
- Symmetrical Triangle Pattern: On the 2-hour chart, $DELAY exhibits a bullish symmetrical triangle pattern, indicating a potential upward breakout.
- Relative Strength Index (RSI): Currently at 47, the RSI provides ample room for upward momentum, reinforcing the bullish thesis.
- Key Support and Resistance Levels: Immediate support lies at $0.000000380, with resistance at the 38.2% Fibonacci retracement level, marking critical zones for traders to watch.
- Trading Volume: The daily trading volume of $DELAY stands at $83,609.69, a 4.10% increase over the past 24 hours, signaling renewed market interest.
Why $DELAY Stands Out
$DELAY isn’t just another token; it’s an innovative Layer 2 solution tailored for the memecoin market. Built on Ethereum, it combines speed, security, and accessibility to revolutionize trading. Here’s what makes $DELAY unique:
- Fast and Cost-Effective: With transaction fees below $0.001 and up to 50,000 transactions per second (TPS), $DELAY ensures seamless trading experiences.
- AI-Driven Security: Advanced AI algorithms detect bots and snipers, offering users informed investment decisions while mitigating scam risks.
- Fiat On-Ramp: Users can purchase memecoins directly with credit cards, bridging the gap between traditional finance and blockchain.
- Telegram Mini-App Integration: With over 1 billion users on Telegram, $DELAY’s mini-app aims to onboard a massive audience to its platform.
Market Performance
-All-Time High: $0.000002382 (recorded on November 28, 2024), currently 73.56% lower.
- All-Time Low: $0.0000004278 (recorded on November 15, 2024), currently 47.19% higher.
- Market Capitalization: $3,020,725, ranking #2877 on CoinGecko with 4.8 trillion tokens in circulation.
Why $DELAY is Poised for Growth
The consolidation phase and the current technical setup create an ideal environment for a bullish breakout. As the first memecoin-focused Layer 2 blockchain, $DELAY is positioned to capitalize on the growing demand for innovative, secure, and user-friendly crypto solutions. Its AI-driven approach, low transaction costs, and unique integrations make it a standout in the Ethereum ecosystem.
Conclusion
$DELAY’s blend of strong technical signals and groundbreaking fundamentals positions it as a top contender for traders and investors. With the potential for a 100% surge, $DELAY is not just a token but a glimpse into the future of memecoin trading. As always, conduct thorough research and monitor market trends to make informed decisions.
Stay updated on $DELAY’s progress and explore its platform to be part of this revolutionary journey.

Can Manta Network Become the Best Layer 2 (investing chart... )hello dear trader...
Can Manta Network Become the Best Layer 2 Solution?
Given the unique features of Manta Network, including its integration with the Polkadot ecosystem, focus on privacy, strong Binance backing, and commitment to decentralization, the project has substantial potential to become one of the top Layer 2 solutions in the blockchain space.
If the development team can overcome technical challenges, address competition, and achieve widespread adoption, Manta Network could emerge as a leading privacy-focused Layer 2 protocol.
Ultimately, the future of Manta Network depends on market developments, user adoption, and the performance of the development team, but the project certainly holds a promising future in the evolving world of blockchain and decentralized finance (DeFi).
good luck

TradeCityPro | APT: Daily Trend Breaks and Bottom Forming👋 Welcome to TradeCityPro!
In this analysis, I will examine the APT coin, the primary coin of the APTOS network, which is one of Ethereum's second-layer networks. This analysis will be conducted in the daily timeframe.
📅 Daily Timeframe: Breaking the Curved Trend Line and the First Bearish Leg In the daily timeframe, we are witnessing a strong upward trend that started from the $4.89 area with a curved ascending trend line up to $14.75. This trend line supported the price three times but finally broke on the last contact, initiating the start of a bearish wave from this trend line break.
📊 After the price reached the peak of $14.75, the market volume gradually decreased, and after forming a lower high and breaking the curved ascending trend line, the market momentum shifted and the bearish phase began.
🔽 The main correction trigger after the trend line break was the break of $11.28, which coincided with the 0.236 Fibonacci level, making this area a strong Potential Reversal Zone (PRZ). However, the bearish volume and momentum were strong enough to break this support.
🔍 Currently, the price is attempting to round off and form a bottom. It's also the Christmas holiday season, and the market volume has decreased, which could make it easier for whales and holders of this coin to facilitate bottom formation. Additionally, the price has reached the golden Fibonacci zone between 0.5 and 0.618, which could significantly influence the end of the correction and the continuation of the upward trend.
🧩 The RSI oscillator is also in a critical and interesting area. If it stabilizes below 30 and enters the Oversell region, there might be panic in the market, potentially leading to a sharp drop. For the continuation of the upward trend and a new bullish leg, the RSI needs to rise above the 50 area to introduce momentum into the market.
📉 If further correction occurs, the next support level is at $7.51, and in the event of panic and sharp declines, the next support would be at $4.89.
🔼 For long positions, if the momentum changes, the market will create a new structure and provide triggers, but currently, the only triggers are at $11.28 and $14.75. The next resistance will be at $17.96.
📝 Final Thoughts
This analysis reflects our opinions and is not financial advice.
Share your thoughts in the comments, and don’t forget to share this analysis with your friends! ❤️
