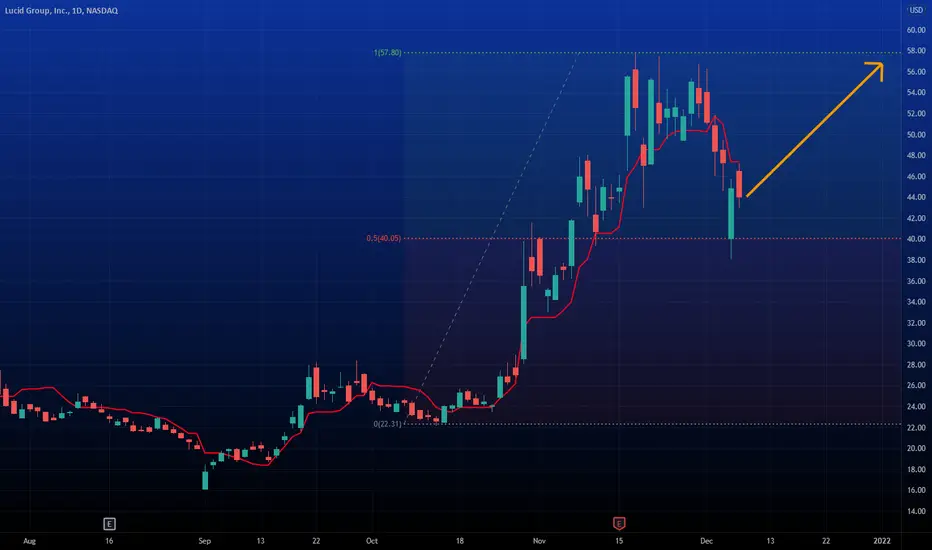
$LCID | WEEKLY WATCHLIST 12/20$LCID 1D
Seen quite a few counts from others pointing towards more down. However, I want to provide a slightly more bullish look. **IF** lows hold from here, we may have put in a sub wave 2 and retesting $46 then $52.
Lcid

Story of Bubbles!
George Soros:
Stock market bubbles don't grow out of thin air. They have a solid basis in reality, but reality as distorted by a misconception.
I started my article with George Soros's quote and will continue with his great wisdom about bubbles!
I think he was the one who benefitted from stock market bubbles the most! and this happened because of his approach to identifying and trading these bubbles!
George Soros:
“When I see a bubble forming, I rush in to buy, adding fuel to the fire,”
Most people rushed into buying RIVN or LCID because they think this could be the next Tesla, and they did not want to miss this opportunity!
This story is very similar to Workhorse's story in the past 3 years!
I published 14 articles about workhorse between September 8th, 2020, and May 6th, 2021.
7 Bullish articles when the price was between 19.78-28.5, and target price of 40-42!
WKHS reached 42.96 and closed at 41.32 on Feb 4th, 2021, priced made a top formation, and on Feb 11, 2021, I published a Short analysis when the price was 37.21.
My first target price for WKHS short was 20-21 and then modified it to 10-11 and after that 5-4 in my last analysis!
WHKS reached 4.92 and closed at 5.01 after 6 months!
I wrote about this practical example because I want to mention:
1- The Bubble story repeats based on the same or different misconception that seems real!
2- The price Pattern moves Exponentially in both directions, either the inflation phase or the deflation phase!
3-Less experienced investors think prices will always be back at the previous highs or lows, which is not the case in many cases!
4- If you can not distinguish the different phases of a bubble, you will lose a big percentage of your trading capital!
5- Average Volume Price is the best tool to monitor speculative bubbles.
6- I strongly recommend reading about Reflexivity
What Is Reflexivity?
Reflexivity in economics is the theory that a feedback loop exists in which investors' perceptions affect economic fundamentals, which in turn changes investor perception.
Conclusion:
Please review Lucid and Rivian plans for the future!
The Lucid goal is to manufacture 400K cars each year! BUT Casa Grande, AZ, is operational with a production capacity to deliver up to 34,000 vehicles per year.
Rivian: The company says its factory in Illinois has the capacity to produce up to 150,000 vehicles per year. About 65,000 of those should be R1T pickup trucks and SUVs, and about 85,000 should be the company's RCV commercial delivery vans, Rivian said in financial filings.
Delivery so far 154 ..!
If you are looking at these numbers, you easily understand that they even don't have any plan to be the next Tesla..!
Best,
Moshkelgosha
DISCLAIMER
I’m not a certified financial planner/advisor, a certified financial analyst, an economist, a CPA, an accountant, or a lawyer. I’m not a finance professional through formal education. The contents on this site are for informational purposes only and do not constitute financial, accounting, or legal advice. I can’t promise that the information shared on my posts is appropriate for you or anyone else. By using this site, you agree to hold me harmless from any ramifications, financial or otherwise, that occur to you as a result of acting on information found on this site.
Reference articles:
www.investopedia.com

LCID Bearish Bat Pattern formationTrade breakdown:
1. Buy after price breaks $42.55 with stop-loss around $38.
2. PT @ $51.60.
Good luck!

LCID price forecastingBase on wave counting, it seems that price in range $31 - $33 will be the end of 5th wave and first wave will be completed. It will be a good chance to buy in that range before second wave start it's rally to upper prices.

$LCID - Head & Shoulders PatternIt seems to me LCID completed the H&S formation pattern. The only thing I don't like at this competition is the volume on the right shoulder. The volume should be smaller than the right shoulder .
What do you guys think ?
Do your own research. Cheers !

[stock] Lucid - LCID - Next Bullish Wave?Lucid - LCID - Ready for the Next Bullish Wave? We will see? Edutainment Purposes Only!

LCID Call in the next day or 2. Learning LEAPSI am currently studying how to enter leap position. Using Stoch RSI and RSI I am finding oversold spots with confirmation that could lead to good gains. I am still new at this so any help on my idea would be great. Waiting for Stoch RSI to break into the channel to enter for Jan 2023. The plan is to shoot for previous highs or 3 months hold which ever comes first.

$LCID Motors Target - 35.58$LCID motors Target 35.58
Technical weakness here is pointing to a move lower…
GL, and let me know your thoughts!!
——————
I usually trade both ways, but lately I’ve been focusing more to the downside because of how high the market is. It makes more sense to sell puts right now, and I’m usually at Target 2.
——————
I am not your financial advisor, but I will happily answer questions and analyze to the best of my ability but ultimately the risk is on you. Check out my ideas, but also do your own due diligence.
I am not a bull. I am not a bear. I just see what I see in the charts and I don’t pay too much attention to the noise in the news.
Very often you have to look at my charts from the perspective of where I’m looking to sell puts. But I also do open positions still once in a while.
If you want me to analyze any stock or ETF just leave me a comment and I’ll do it if I can.
Have fun, y’all!!
(\_/)
( •_•)
/ >🚀

Is Ford (F) going for another run for ATH?The Friday's candle broke the channel was a very bullish one with a high volume. The TTM Squeeze is also about to get out of the squeeze which will trigger another high. (I used the "real licensed" TTM Squeeze in another platform) Ford has a chance to run $27.
PS: I am not a financial advisor. This is only for education and entertainment purposes.

$LCID | WEEKLY WATCHLIST 12/13$LCID 1D
Last week, we saw Lucid sell off on senior notes offering news. Bouncing off the GP, we may see potential bottom here. Wait for smaller degree wave 1-2 form first (green path) for some better confirmation. Also included a fractal path to note labelled in blue...

$LCID holding support zone too...This name to be added to the Nasdaq 100 around Dec 17... worth keeping an eye on as it holds support...

New Target for LUCIDLCID will come down for the same reason it jumped up..!
Previous analysis:
and before that:
you may benefit from this post as well:
You can see the most important support (green lines) and resistance (red lines) to watch in the coming days in these charts!
Best,
Moshkelgosha
DISCLAIMER
I’m not a certified financial planner/advisor, a certified financial analyst, an economist, a CPA, an accountant, or a lawyer. I’m not a finance professional through formal education. The contents on this site are for informational purposes only and do not constitute financial, accounting, or legal advice. I can’t promise that the information shared on my posts is appropriate for you or anyone else. By using this site, you agree to hold me harmless from any ramifications, financial or otherwise, that occur to you as a result of acting on information found on this site.

LCID Shorting Upward ImpulsesAfter hours LCID unveiled for $1.75 Billion Offering of Convertible Notes via Private Placement. Never great for long term investors to experience such news; especially afterhours. Nevertheless, I'd be looking for any upward impulses as legs into short sided positions riding LCID down towards the 26.80 T1 area. I'd give this a 3-month window; however, I expect it to happen much soon -- the duration of 3 months just provides more time in "time and price" to meet the expecting outcome.

LCID is about to breakdownI believe LUCID will go beyond $60, but not now. Fib zone 0.382 - $45.12 is being the resistance, tested with very low volume. RSI and moving averages are suppressing the movement. $35-36 area needs to be visited before another run to $50's

Nice Retracement Level on LCIDToday I am going through the highest volume stocks to add to my new Bot for Spike Alerts. I found NASDAQ:LCID at the top of today's list. It is clear to see why it is having such volume. Price is coming off a good 50% Retracement Level from a major trend. I expect this to retest the high.
AAPL DIAMOND TOP - PUTS - WAIT FOR CONFORMATIONAll,
I think we now can more easily see the AAPL diamond top. Need breaks of 164 to confirm, could spike few more times just keep an eye on it.
This is a great example of being slightly biased or you can do 1:1 calls/puts and hold them and drop the other. If this drops and bounces 164s could see bull move. Hard to do on AAPL at this price lots of people don't pay attention to real costs of AAPL once they do splits. Personalyl short AAPL in general. I think next ER is bad.

CRSP - WEDGE ON SUPPORT - PIVOT CANDLE CONFORMATION **ON ALERT**All,
Pretty easy to see why you would be bullish here. Few things need to happen.
1) full candle break watch for a gap etc
2) needs to break horizontal SR at 81.50s (full candle above)
3) market needs to hold this in here if it were to somehow lose these yellow levels would be big downside imo.
Add alerts and keep this on a short timeline maybe literally one more day.

LCID: Watch for a possible reversal pattern!Hello traders and investors! Let’s analyze LCID today! I’ve been analyzing during my videos on YouTube, but this is the first time I write about it here on TradingView. I hope you’ll find something useful.
First, in the 1h chart, LCID is clearly in a bear trend. We have a series of lower highs/lows, and the 21 ema is above the price, pointing down, potentially working as a resistance today, as it couldn’t break it during the first hour.
In order for LCID to reverse, we must see it breaking the 21 ema, and doing a bullish structure, preferably, a higher high from here, followed by a higher low.
What’s more, if LCID is about to reverse, now is a good time. We don’t see any confirmation yet, but we are just above a support level, which is better seen from the daily chart:
Yesterday, we had a very strong bullish candlestick, with decent volume, just above the $ 39.27, the previous support level. The only problem here is the 21 ema again, which is also working as a resistance. It is worth to notice that the 21 ema in the daily chart is almost at the same price seen in the 1h chart, something not that common to happen, making it a dual-resistance in different time-frames.
This candlestick pattern alone might be a buy sign for many, as the risk/reward ratio is making sense, in my view. I just prefer to see a better bullish structure in the 1h chart first.
Let’s see how it’ll play next. If you liked this analysis, remember to follow me to keep in touch with my daily updates on stocks and indices!
Have a good day.

Lucid price target for the comming week!LCID could move toward 47-43 once again and this means put options have high return potentials this week!
reviewing previous analysis could be beneficial:
You can see the most important support (green lines) and resistance (red lines) to watch in the coming days in these charts!
Best,
Moshkelgosha
DISCLAIMER
I’m not a certified financial planner/advisor, a certified financial analyst, an economist, a CPA, an accountant, or a lawyer. I’m not a finance professional through formal education. The contents on this site are for informational purposes only and do not constitute financial, accounting, or legal advice. I can’t promise that the information shared on my posts is appropriate for you or anyone else. By using this site, you agree to hold me harmless from any ramifications, financial or otherwise, that occur to you as a result of acting on information found on this site.

$TSLA | WEEKLY WATCHLIST 12/6Looks like wave C is potentially in here in my proposed ABCDE. If we break below B, I will shift my count to an ABC correction with A=C. Looks very similar to $TSLA.

$LCID Potential buy entry at 42.59As per the Chart Analysis and Spartan AI - We expect $LCID to hit $42.59 and this could be a potential long term buy entry in this.

LCID Lucid Motors going for a bounceLucid Motors Short term going down, looking for a good entry for long term around $ 30 to $40.

ONCS - WEEKLY CHART DOUBLE BOTTOM? IS IT POSSIBLE? WILD.All,
I mean you can't tell me this isnt a textbook double bottom if this was on 5M its a buy. Crazy on a weekly chart. Would be a huge long position and wouild have to hold. Interesting. If this bottom holds here might actually buy and hold some just to see if we can get a 3-4 PT hit.
