TradeCityPro | LDOUSDT The Layer 2 Leader with Highest TVL👋 Welcome to the TradeCityPro channel!
Let's explore LDO, the altcoin with the highest Total Value Locked (TVL) on Ethereum, and analyze potential triggers for spot and futures trades.
🌐 Market Overview
Bitcoin experienced a pullback during the New York session, accompanied by a rise in BTC dominance. This led to a deeper correction in altcoins, but the overall trend remains bullish.
📊 Weekly Timeframe
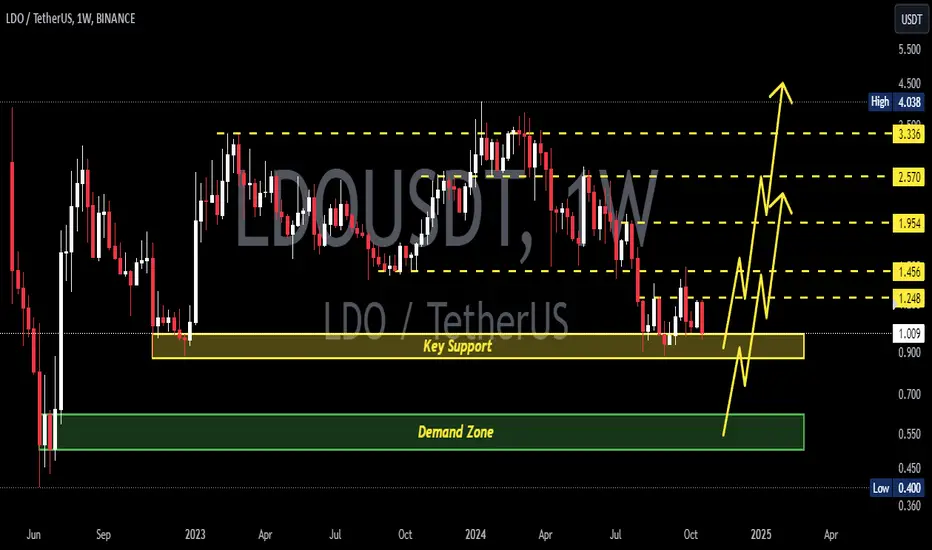
LDO, a relatively new altcoin, hasn’t experienced a full crypto bull run yet. Its ATH of $4.053 was fueled by the Layer 2 hype. Since then, it broke its weekly uptrend and dropped to $0.924.
LDO has been consolidating in a range between $0.924 and $1.339, forming an accumulation zone.
This week’s candle is attempting to break both the upper range and a descending trendline. A close above $1.339 could trigger a rally, with a stop-loss at $0.924.
📈 Daily Timeframe
After 110 days in the accumulation zone, LDO is breaking out above $1.345. Buyers are showing strength, as the price didn’t revisit the range’s lower boundary after the last rejection.
Likely to enter overbought rsi territory if the breakout sustains, signaling continuation of the uptrend.
For risk-takers, a stop-loss at $1.115 can be set for entries based on the daily timeframe.
⏱ 4-Hour Timeframe
The price is battling strong resistance at $1.408. Despite minor rejections, buyers remain dominant, with the price rebounding from the trendline support.
📈 Long Position Trigger:
Open a long position after a breakout above $1.408, confirmed by increased volume and RSI entering overbought levels.
📉 Short Position Trigger:
Even if short triggers appear, it's better to wait for pullbacks for long entries as the bullish momentum builds.
💡 BTC Pair Insight
Like most altcoins, LDO has been underperforming against Bitcoin. However, it’s attempting a recovery, starting from lower timeframes.
breakout above 0.0002083 BTC could signal a stronger rally against Bitcoin. However, current funds seem concentrated in other altcoins, so its pace might be slower for now.
LDO holds the largest stake in Ethereum, giving it potential to self-support in the short term :)
📝 Final Thoughts
Stay calm, trade wisely, and let's capture the market's best opportunities!
This analysis reflects our opinions and is not financial advice.
Share your thoughts in the comments, and don’t forget to share this analysis with your friends! ❤️
LDOUSDT

#LDO Analysis – Ready to FlyLDO is breaking through its dynamic resistance and the main pivot zone around $1.35–$1.50. If it holds above this level, the path toward the next resistance at $2.00 is clear, and we could see a strong rally.
This breakout signals strength, but keep an eye on volume for confirmation. LDO has the potential to fly if it maintains above the pivot zone! 🚀
Note: This is not financial advice; always trade responsibly.

Lido DAO Faces Legal and Market Turmoil: In a landmark ruling, a California court has classified Lido DAO, the decentralized organization behind the popular liquid staking protocol, as a general partnership, raising significant concerns for DAO governance structures and their participants. This decision reverberates through both the legal and crypto landscapes, highlighting vulnerabilities in decentralized governance.
Legal Developments Shake Lido DAO
The U.S. Northern District Court of California rejected Lido DAO’s claim of not being a legal entity. Instead, the court deemed it a general partnership, making identifiable participants liable for the DAO’s actions. Judge Vince Chhabria, in his ruling, emphasized the precedent-setting nature of this case:
> “ presents several new and important questions about the ability of people in the crypto world to inoculate themselves from liability by creating novel legal arrangements to profit from exotic financial instruments.”
Prominent Lido governance participants, including Paradigm Operations, Andreessen Horowitz (a16z), and Dragonfly Digital Management, were implicated as general partners. Notably, Robot Ventures was dismissed from the case due to insufficient evidence of active involvement.
Miles Jennings, General Counsel at a16z crypto, described the ruling as a severe blow to decentralized governance:
> "Under the ruling, any DAO participation (even posting in a forum) could be sufficient to hold DAO members liable for the actions of other members under general partnership laws."
This development raises pressing questions about the future of decentralized finance (DeFi) and the legal safety of participating in DAOs.
Technical Outlook for MIL:LDO
Amid the legal turmoil, Lido’s native token, MIL:LDO , has seen volatile price movements. As of writing, MIL:LDO is down 4%, trading within a falling trend channel. Here's what the technical indicators suggest:
1. Support and Resistance Levels: Current support lies near $1.133, aligning with the confluence of moving averages, indicating strong defensive support at this level. On the upside, MIL:LDO could rebound to the $2 resistance level, representing a critical juncture for a potential breakout.
2. Chart Patterns: The daily price chart reveals an enclosed rectangle pattern*, showcasing periodic up-and-down movements. A breakout from this pattern, especially in the bullish direction, could significantly impact the token's trajectory.
3. Market Sentiment and TVL: The general crypto market remains bullish, which could provide tailwinds for $LDO. Data from DeFiLlama indicates that Lido remains one of the largest players in the liquid staking space, with a promising Total Value Locked (TVL) figure that reinforces its dominance in DeFi.
What’s Next for MIL:LDO ?
This ruling sets a precedent that could deter active participation in DAOs, especially among institutional investors. However, it also serves as a wake-up call for DAOs to reassess their governance structures and liability frameworks.
Market Implications:
Despite the legal challenges, Lido’s fundamental metrics remain robust. The protocol continues to be a leader in liquid staking, holding a substantial share of the market. If MIL:LDO consolidates around the $1.133 support level and leverages the bullish sentiment in the broader crypto market, a rally to $2 or beyond is possible in the near term.
Conclusion
In conclusion, Lido DAO finds itself at a crossroads where regulatory challenges meet market potential. The coming weeks will likely determine whether the protocol can overcome legal hurdles and maintain its position as a DeFi heavyweight.

The Banana Zone Series - LDO Buy the Dip Levels (9 of 10)Alt-season is here. BTC breakout has been confirmed. If you missed positioning for the next level of exponential moves, what are some of the buy the dip zones while still have time for the bigger moves into the banana zone.
We continue the series with Lido DAO ( MIL:LDO ).
As you can see in my analysis, pull backs to $1.12 and below is my new accumulation zone. I will initiate some leveraged longs for new trades in preparation for the moves to the banana zone in the alt season.
For more aggressive traders, $1.20 and below can be the trigger longs with tight stops.
Not a financial advice so DYOR.

#LDO/USDT#LDO
The price is moving in a descending channel on the 4-hour frame
And it is sticking to it well
We have a bounce from the lower limit of the descending channel and we are now touching this support at a price of 1.00
We have an upward trend on the RSI indicator that is about to be broken, which supports the rise
We have a trend to stabilize above the moving average 100
Entry price 1.07
First target 01.16
Second target 1.27
Third target 1.35

LDO target $1.984h time frame
-
Entry: $1.24
TP: $1.9875
SL: $1.0575
RR: 4.1
-
(1) Symmetrical structure is creating, high possibility to reach previous high
(2) Strong pump recently that bring LDO from $0.87 to $1.45 in two days
(3) Getting support at fib 0.618, which is $1.24
(4) $2.5 will be easy to hit if momentum is enough based on the flipped structure
(5) Stop loss once going below $1.0575

#LDO Getting Ready For an Imminent Bullish Breakout? Key Levels Yello, Paradisers! Is #LidoDAO about to make a decisive move? Let's break down #LDOUSDT key levels and what they mean for the next big play:
💎Currently, #LDO is at a pivotal point, showing signs of a potential bullish continuation from the crucial support at $1.03. If the price can hold steady at this level, we might see a breakout above the descending resistance of the ongoing channel. However, momentum is the key, and sustained buying pressure will be essential for this breakout to become a reality.
💎To validate the bullish case, we need a decisive break above the Bearish Order Block (OB) around $1.51-$1.65. Look for strong engulfing candles and maintained momentum in this zone as signs that the breakout is genuine. Until we see these signals, it’s wise to stay cautious and avoid rushing in too early. The market has been tricky lately, and waiting for the right confirmation can make the difference between profit and loss.
💎If the bulls fail to push LDO above $1.51-$1.65, we could see momentum shift back towards the sellers. The critical support level to keep an eye on remains $1.03, which has been tested twice and held strong. A rebound from here would keep the bullish outlook alive and set the stage for another attempt to break higher.
💎However, if the $1.03 support fails to hold, expect the price to target the major support zone around $0.879. Should #LDOUSDT fall into this range and continue to weaken, the bullish scenario would be off the table, making it crucial to adjust your strategy accordingly.
The market is full of opportunities for those who stay disciplined and focused.
MyCryptoParadise
iFeel the success🌴

LDOUSDTLDO ~ 1W
#LDO If you still have Conviction on this coin,. You can place your first purchase on this support block. and you can place the second purchase on the next support block.
LDO ANALYSIS📊 #LDO Analysis
✅There is a formation of Descending Channel Pattern in daily chart with a breakout of Descending Channel. Currently the coin is trading sideway. We would see a good price moment in few weeks 🧐
👀Current Price: $1.093
🚀 Target Price: $2.024
⚡️What to do ?
👀Keep an eye on #LDO price action and volume. We can trade according to the chart and make some profits⚡️⚡️
#LDO #Cryptocurrency #Breakout #TechnicalAnalysis #DYOR

(LDO) Eyeing Breakout Towards $1.26hello guys.
let's analysis LDO
Ascending Channel: LDO is trading within an ascending channel, showing a positive medium-term trend.
Broke Above Resistance: LDO recently broke above the $1.12 resistance (now support), suggesting bullish momentum.
Next Target: The price is likely aiming for the $1.26 resistance zone, a critical area that aligns with the upper boundary of the channel.
Support Zone: The $1.06 - $1.08 region serves as the immediate support in case of a pullback, as it lies at the lower trendline and within a key demand zone.
Bullish Continuation: If LDO can hold above $1.12, it’s likely to push towards the target of $1.26, indicating a possible continuation of the upward trend.

LDO/USDT Trading ScenarioAfter reaching a new high of $4.027, the price of LDO significantly declined, dropping to $0.863, which corresponds to a fall of over 78%.
According to the volume profile, the asset broke through the POC volume level at $2.4.
Special attention should be given to the increase in volume in the range of $1.026 to $1.135. This range shows active growth and is approaching the POC level, which could signal a potential reversal and the start of an upward trend.

LDOUSDTLDO ~ 1W ✅
MIL:LDO Our first purchase will be active here.
❗ We will make a second purchase if this key support is unable to withstand bear pressure. and of course you already know our target price for this scenario.

LDOUSDT: READY TO GO LONG at SUPPORTHello,
Welcome to the quick update of LDOUSDT. From the last few months we can see LDOUSDT in a downtrend and has dumped more than 50%.
Currently, it is trading in the range of .9480 to .9981. We can see it breaking the channel and is currently trying to retest. The immediate support levels to watch for are .91 to .94.
We can take a small position at around 0.9621 and DCA until .9081 with a STOPLOSS of 0.8711.
The targets to watch for are:
1.0444
1.0711
1.1324
1.1767
1.3511 and 1.5573 (This is for the long run)
Until then, stay tuned and trade with caution, ensuring strict STOPLOSSES!!
This is not financial advice, please do your research before investing, as we are not responsible for any of your losses or profits.
Please like, share, and comment on this idea if you liked it.
ScramblerG is always there to help and trade with caution but DYOR.

Potential Reversal | Long BiasOn 4H
BINANCE:LDOUSDT has touch and bounced from Order Block below $1 which zone I marked and this zone is also Demand Zone of Week Timeframe
Now, I'm waiting price touch and create confirmation around $1
Trade on lower timeframes
Time will tell

LDO looks bullishFrom where we put the green arrow on the chart, it looks like an ABC pattern is formed on the chart.
We seem to be in wave B now. This wave is a diametric. We are now in wave g of this diametric, which is the last wave of this diametric.
We are looking for buy/long positions in the demand range.
Closing a daily candle below the invalidation level will violate the analysis.
For risk management, please don't forget stop loss and capital management
When we reach the first target, save some profit and then change the stop to entry
Comment if you have any questions
Thank You

#LDO/USDT#LDO
The price is moving within a descending channel pattern on the 1-hour frame and is expected to break upwards after it has adhered to it significantly
We have a downtrend on the RSI indicator that is expected to break upwards and we have a trend to stabilize above it
We have a major support level in green at a price of 100
We have a trend to stabilize above the moving average of 100, which supports the rise
Entry price 1.02
First target 1.13
Second target 1.23
Third target 1.36

LDO is ready to return LDO is ready to be long, be sure to check it yourself.@KING_1CRYPTO
Tank you for subscribe and like.

LDO READY to MOVEHello,
Welcome to the quick update of LDOUSDT. It is showing positive signs after consolidating around 1.49 to 1.58.
We can go long on this with a short-term target of around $ 1.78 to $1.87 and a long-term target of $2.27 and STOPLOSS of 1.48
Until then, stay tuned and trade with caution, ensuring strict STOPLOSSES!!
This is not financial advice, please do your research before investing, as we are not responsible for any of your losses or profits.
Please like, share, and comment on this idea if you liked it.

LDO Update (Bullish)It looks like we have a large diametric on the chart that we are now at the end of the F wave.
The green range is a strong support on which we look for buy/long positions
Closing a daily candle below the invalidation level will violate the analysis.
For risk management, please don't forget stop loss and capital management
Comment if you have any questions
Thank You

LDO Technical Analysis in 2-Day Timeframe.Hello everyone, I’m Cryptorphic.
For the past seven years, I’ve been sharing insightful charts and analysis.
Follow me for:
~ Unbiased analyses on trending altcoins.
~ Identifying altcoins with 10x-50x potential.
~ Futures trade setups.
~ Daily updates on Bitcoin and Ethereum.
~ High time frame (HTF) market bottom and top calls.
~ Short-term market movements.
~ Charts supported by critical fundamentals.
Now, let’s dive into this chart analysis:
MIL:LDO is currently holding a crucial support level at $1.55. MIL:LDO needs to maintain this support level for a decent push toward $2, where the 50 EMA and resistance trendline are located.
A further breakout will likely create a bullish rally, potentially taking the price to the local high range of $4.
Key levels:
- Crucial Support: $1.55.
- Primary Resistance: 50 EMA and $2 resistance trendline.
- Target: $4.
- Invalidation Point: A close below the support trendline.
DYOR, NFA.
Please hit the like button to support my content and share your thoughts in the comment section. Feel free to request any chart analysis you’d like to see!
Thank you!
#PEACE

Lido DAO / LDO The price of Lido DAO is $3.27 today with a 24hour trading volume of 260 million dollar. This represents a 8.5% price increase in the last 24 hours and a 66% price increase in the past 30 days
Lido is a liquid staking solution for Ethereum. Lido lets users stake their ETH with no minimum deposits or maintaining of infrastructure - whilst participating in on-chain activities, e.g lending, to compound returns.LDO is the native utility token that is used for: 1/Granting governance rights in the Lido DAO. 2/Managing fee parameters and distribution. 3/Governing the addition and removal of Lido node operators.
right now LDO/USDT is breaking out of huge Adam & Eve pattern at 2.8$ and its next targets are 3.3, 3.5 and 3.9 for short term trade

LDOUSDT UPDATE : READY to LAUNCHHello Folks !!
Welcome to the quick update of LDOUSDT. As of now, we can see it is trading around 1.57 and currently at the immediate resistance. If it breaks this resistance, we can easily see a target of 25-20% in the short run and it can reach a price of $1.87.
We can take a trade with the below details:
Entry: 1.54 to 1.57
Target: 1.79 to 1.91
STOPLOSS: 1.47
Until then, stay tuned and trade with caution, ensuring strict STOPLOSSES!!
This is not financial advice, please do your research before investing, as we are not responsible for any of your losses or profits.
Please like, share, and comment on this idea if you liked it.

LDO is worst asset nowHello, Skyrexians!
I hope most of you remember my last update on LDO where I told you that this alt coin will show us pump to $4-5 when the price was $2. Now as we can see price was unable to break through resistance line and showed the fake breakout. Now it's inside the 0.61 Fibonacci area. If this support zone will be lost I have a bad news for LDO holders. Price will go below this huge range for a long time.
Follow us and never miss update
