#LDO/USDT#LDO
The price is moving within a descending channel on the 1-hour frame, adhering well to it, and is on its way to breaking strongly upwards and retesting it.
We have support from the lower boundary of the descending channel, at 1.128.
We have a downtrend on the RSI indicator that is about to be broken and retested, supporting the upside.
There is a major support area in green at 1.10, which represents a strong basis for the upside.
Don't forget a simple thing: ease and capital.
When you reach the first target, save some money and then change your stop-loss order to an entry order.
For inquiries, please leave a comment.
We have a trend to hold above the 100 Moving Average.
Entry price: 1.139.
First target: 1.172.
Second target: 1.210.
Third target: 1.270.
Don't forget a simple thing: ease and capital.
When you reach your first target, save some money and then change your stop-loss order to an entry order.
For inquiries, please leave a comment.
Thank you.
Ldousdtsignals

LDO/USDT Breakout Watch Ready to Fly After a Strategic Breakout?🔍 Full Technical Analysis
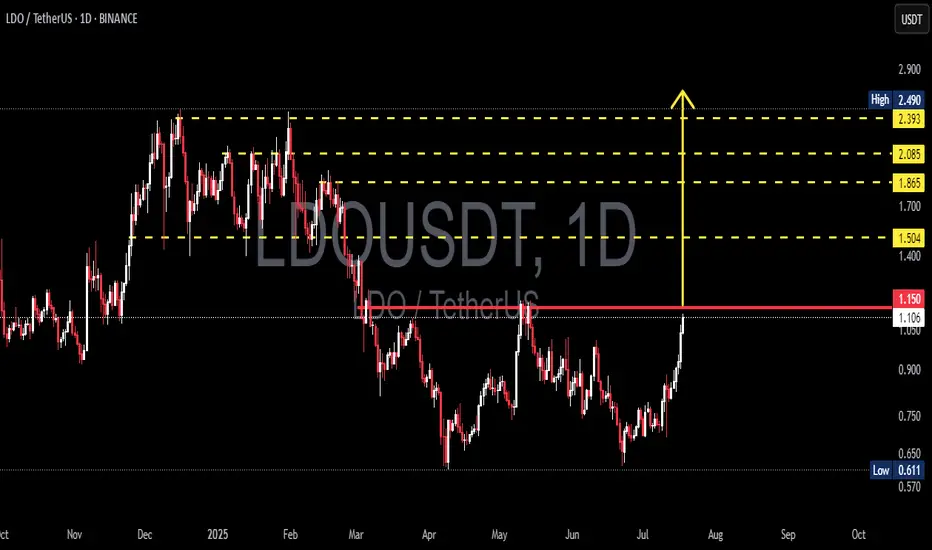
After months of downtrend and tight consolidation, LDO/USDT is showing clear signs of a bullish resurgence. The breakout above the key psychological resistance at $1.15 opens up a wide path toward higher resistance zones, potentially marking the beginning of a strong upward trend.
📐 Key Pattern Formed:
✅ Double Bottom Pattern
> Clearly visible from May to July 2025, with a neckline at $1.15. This is a classic bullish reversal pattern. The breakout above the neckline confirms the setup, projecting a significant upward move based on the measured height of the pattern.
✅ Horizontal Resistance Breakout
> The $1.15 level acted as a major resistance since April 2025. A clean breakout above it suggests that bulls are regaining control of the market momentum.
✅ Bullish Scenario (Primary Bias)
If the price successfully holds above the $1.15 zone and confirms it as support (successful retest), we may witness a bullish rally targeting the following levels:
🎯 Target 1: $1.504
— A minor resistance and previous consolidation area.
🎯 Target 2: $1.865
— A strong resistance level from earlier distribution zones.
🎯 Target 3: $2.085
— A technically significant level and key reaction point from past price action.
🎯 Target 4: $2.393 – $2.490
— A major supply zone and swing high from early 2025. This serves as the potential final target of the current bullish leg.
🟢 Volume increased during the breakout — a strong confirmation signal that this move is genuine, not a fakeout.
🟢 RSI likely gaining strength — though not shown on this chart, momentum indicators are likely supporting the move with a breakout from neutral levels.
❌ Bearish Scenario (If Breakout Fails)
If the price fails to hold above $1.15 and drops back below $1.05:
🔻 Potential Fakeout Risk
— A correction could send LDO back to:
Minor support at $0.90
Base support at $0.75
Major support at $0.611 (2025’s low)
📉 A breakdown below $0.611 would invalidate the bullish structure entirely, putting LDO back into a strong downtrend.
📊 Final Thoughts:
> LDO/USDT is at a critical decision point. A clean breakout from a strong medium-term structure opens the door for a significant bullish continuation. With pattern confirmation and strong volume support, this setup could mark the beginning of a mid-term uptrend.
The key lies in holding above $1.15 and watching for a healthy retest. This is a premium setup for swing traders and trend followers looking for early entries before a possible major move.
🧠 Trading Tips:
✅ Ideal Entry: On successful retest around $1.15 – $1.10
❌ Stop Loss: Below $1.00
📈 Targets: $1.50, $1.85, $2.08, and $2.49 (scaling out recommended)
#LDO #LDOUSDT #CryptoBreakout #AltcoinRally #TechnicalAnalysis #DoubleBottom #CryptoSignals #TradingViewIdeas #SwingTradeSetup #BullishPattern
#LDO/USDT#LDO
The price is moving within a descending channel on the 1-hour frame, adhering well to it, and is heading toward a strong breakout and retest.
We are experiencing a rebound from the lower boundary of the descending channel. This support is at 0.741.
We have a downtrend on the RSI indicator that is about to be broken and retested, supporting the upward trend.
We are in a trend of consolidation above the 100 moving average.
Entry price: 0.780
First target: 0.805
Second target: 0.837
Third target: 0.870

LDOUSDT 1D AnalysisLDO ~ 1D Analysis
#LDO Buy gradually after retesting this support block with a short term target of at least 10%+ from here.

LDOUSDT 4D Analysis LDO ~ 4D Analysis
#LDO Buy gradually from here if you still have confidence in this coin with a short term target of at least 20%++

LDOUSDT 1D AnalysisLDO ~ 1D Analysis
#LDO Buy after successfully penetrating this resistant line with a short -term target of at least 10%+ from here.

LDO - big lie - Many influencers have been touting this coin.
- the coin is found in the side
- the exit was down and I expect the downtrend to continue
if you like the idea, please "Like" it. This is the best "Thanks!" for the author 😊 P.S. Always do your own analysis before a trade. Put a stop loss. Fix profits in installments. Withdraw profits in fiat and please yourself and your friends.

LDOUSDT 4DLDO ~ 4D Analysis
#LDO Buy when visiting this support with a short -term target of at least 15%+.

LDOUSDT 1WLDO ~ 1W Analysis
#LDO So far it still continues to maintain this support. Buy gradually from here with a short -term target of at least 20%+.

#LDO/USDT#LDO
The price is moving in a descending channel on the 1-hour frame and is adhering to it well and is heading to break it upwards strongly and retest it
We have a bounce from the lower limit of the descending channel, this support is at a price of 1.64
We have a downtrend on the RSI indicator that is about to break and retest, which supports the rise
We have a trend to stabilize above the moving average 100
Entry price 1.71
First target 1.80
Second target 1.87
Third target 1.95

LDOUSDT 1WLDO Update ~ 1W
#LDO So far it continues to maintain its bullish structure. This is a very good support Block for gradual rebuys. With a minimum target of 20%+
#LDO/USDT Ready to go up#LDO
The price is moving in a descending channel on the 1-hour frame and sticking to it well
We have a bounce from the lower limit of the descending channel, this support is at 1.14
We have a downtrend, the RSI indicator is about to break, which supports the rise
We have a trend to stabilize above the moving average 100
Entry price 1.17
First target 1.20
Second target 1.25
Third target 1.29

LDO target $1.984h time frame
-
Entry: $1.24
TP: $1.9875
SL: $1.0575
RR: 4.1
-
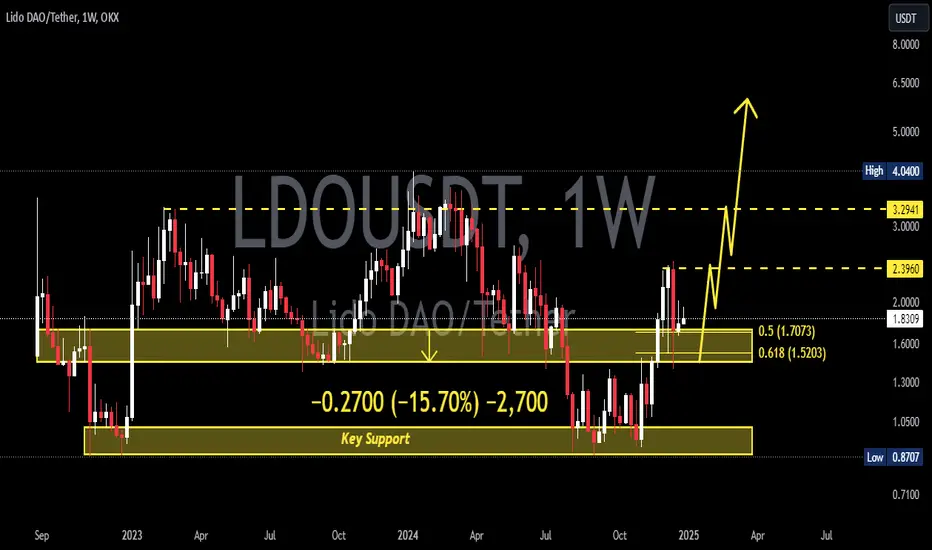
(1) Symmetrical structure is creating, high possibility to reach previous high
(2) Strong pump recently that bring LDO from $0.87 to $1.45 in two days
(3) Getting support at fib 0.618, which is $1.24
(4) $2.5 will be easy to hit if momentum is enough based on the flipped structure
(5) Stop loss once going below $1.0575

LDOUSDTLDO ~ 1W
#LDO If you still have Conviction on this coin,. You can place your first purchase on this support block. and you can place the second purchase on the next support block.
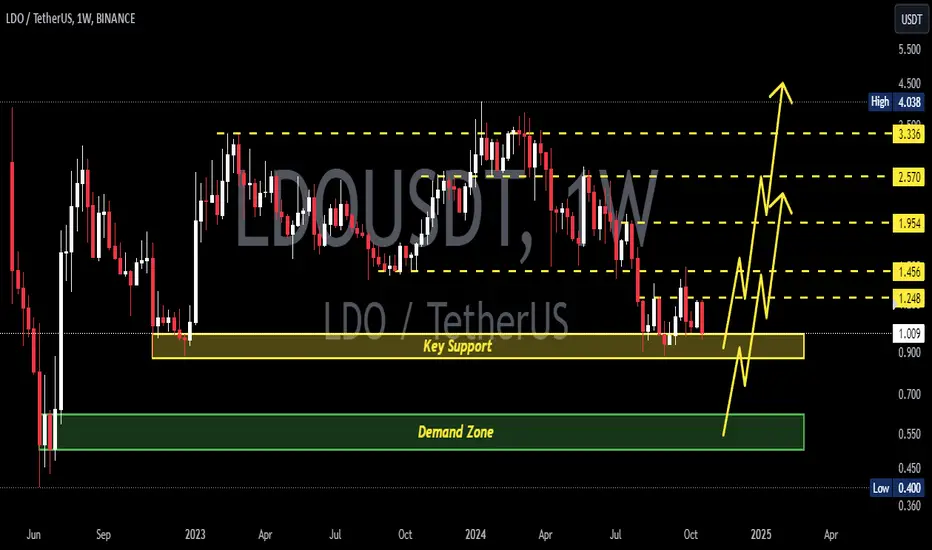
LDOUSDTLDO ~ 1W ✅
MIL:LDO Our first purchase will be active here.
❗ We will make a second purchase if this key support is unable to withstand bear pressure. and of course you already know our target price for this scenario.

#LDO/USDT#LDO
The price is moving within a descending channel pattern on a 4-hour frame, which is a retracement pattern
We have a bounce from a green support area at 1.67
We have a tendency to stabilize above the Moving Average 100
We have a downtrend on the RSI indicator that supports the rise and gives greater momentum and the price is based on it
Entry price is 1.85
First goal 2.17
Second goal 2.42
Third goal 2.68

#LDO/USDT#LDO
We have a bearish channel pattern on a 4-hour frame, the price moves within it, adheres to its limits well, and is expected to break it upwards in a strong manner.
We have a support area at the lower border of the channel at $1.80 from which the price rebounded
We have a tendency to stabilize above moving average 100
We have an uptrend on the RSI indicator that is about to break higher, supporting the price higher
Entry price is 1.90
First goal 2.18
The second goal is 2.35
the third goal is 2.56

LDO long setupThe bias turned bullish for cryptocurrencies...
Here I share my MIL:LDO long setup...
Wait for:
- SSL
- Deviation
- Demand
- Enter Long

LDOUSD 1WLDO ~ 1W
#LDO This chart really looks bad. Support 1. $1.45 & Support 2. $0.96
I won't say this will happen for sure, But it's a bad chart in our opinion.

LDOUSD 1WLDO ~ 1W 📈
#LDO Make purchases gradually in this Support zone, with a minimum target of 20%+ from here 📈

LDO/USDT Could LDO Break out the Resistance of ATH ??💎 LDO has recently experienced significant market dynamics. Initially, it faced a strong rejection upon attempting to break the resistance at its all-time high, resulting in a significant downward movement back to the demand area.
💎 Currently, LDO appears poised to make another attempt at breaking the resistance ATH, especially as it has also broken out of the ascending channel.
💎 If LDO successfully breaks the resistance ATH on its second attempt, we may witness a notable upward movement, potentially reaching our target area. However, if LDO fails to break this resistance for the second time, there is a possibility that the price will retreat to the demand area to gather momentum for another attempt at breaking the resistance.
💎 LDO must bounce from the demand area upon retracement, as failure to do so could signify weakness in the market. A breakdown below the demand area would be a concerning sign, potentially leading to further downward movement toward the support area or even breaching the ascending channel.

LDOUSD Pair : LDOUSDT
Description :
Impulse Correction
Bullish Channel as an Corrective Pattern in Short Time Frame and Rejection from Upper Trend Line
Completed Impulsive Waves and Corrective Waves " ABC "
Break of Structure and Completed Retracement

LDO/USDT Perfect bounce from the support. Ready for Back to Up??💎 LDO has undergone significant developments in the market. Recently, LDO executed a flawless bounce from the support area, previously acting as resistance.
💎 Observing the candle patterns suggests a probability continuation of the upward movement, aiming to revisit our target resistance and possibly achieve a new all-time high (ATH).
💎 However, if LDO retraces back to the support and fails to bounce or, worse, breaks below the crucial support area, it raises bearish concerns. The support zone holds immense significance, and a breach may trigger a reversal to downward movement, with the next target being the demand area.
💎 To sustain upward momentum, LDO must bounce at the demand area and reclaim the position above the support. Failure to do so could lead to a continued downward trajectory and further price decline.
