Learning

How to Trade the Breakout of a Range 101In this post, we will learn how to trade the breakout of a clear range. Let's start learning.
a) First of all, we need a clear Range ( we can say that is clear when we have a support and a resistance level and the price in between for a considerable amount of time)
b) From a technical perspective, the expected movement after a range is broken is the extension of it in the broken direction (green arrow)
c) Also, we will see how that projected movement fits in the context of the chart. In this case, we will look for the next resistance zone.
d) The correct way of identifying a resistance zone is by looking for clear reversal movements in the past. Ignore small corrections. Look for reversal movement and define it with a horizontal line ( in this case, we used 2 yellow arcs to show the idea)
e) Now you can see two things. 1) The projected distance of the range is very similar to the distance towards the next resistance zone 2) You have good space to try to catch a wave
f) But how can I trade a situation like this? You need a CONFIRMATION. In this case, we always wait for corrective structures (remember that corrective structures can be Flat, Zig Zag, Triangles, or Irregulars)
g) Wait for a clear corrective structure on the Edge of the broken Range. IF that happens, you need to define its edges, and from now, it's straightforward. (You can also look for a corrective structure on a lower timeframe; for example, if you define the range on the 4HS chart, you can change your timeframe to the 1H chart.)
h) Open positions on the Breakout of the structure, Set stop loss below the structure, Set take profit on the next resistance zone, Define the risk you will take on the trade
i) Use this as an archetype on how to trade this type of structure.
Have a great day!

Short pullback ETHusdt Etherium is looking really bullish for the last months, and I think Etherium will hold strong untill the end of the year.
But before the uptrend continues, I think Ehterium will go in a downtrend to the 320 usdt mark before continuing the uptrend.
This can be seen directly from the RSI, which represents hidden divergence in the last highs (marked in red).
I hope you like my idea,
If you do so please give me a comment on how I can improve my idea's.
I stepped into crypto a couple of months ago and want to learn as mutch as possible.
Therefore don't follow my idea's blindly and do your own research.
Hope you guys stay health and
GOOD TRADING : )

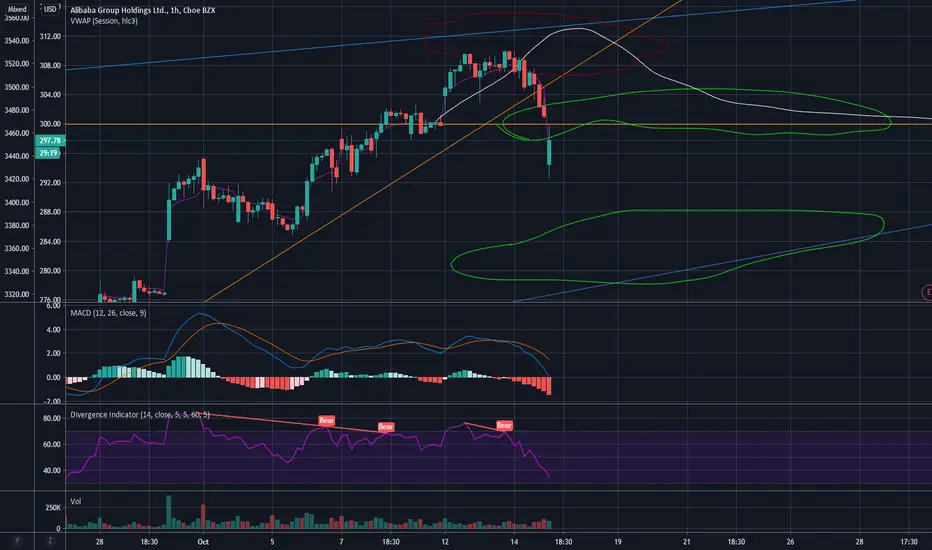
ALIBABAthat was weird
kinda worried about going 280, but the RSI might not support that low.
mid-term the same for now, I'll get worried if it close under 300 (orange support line)
Red = out
Green = in
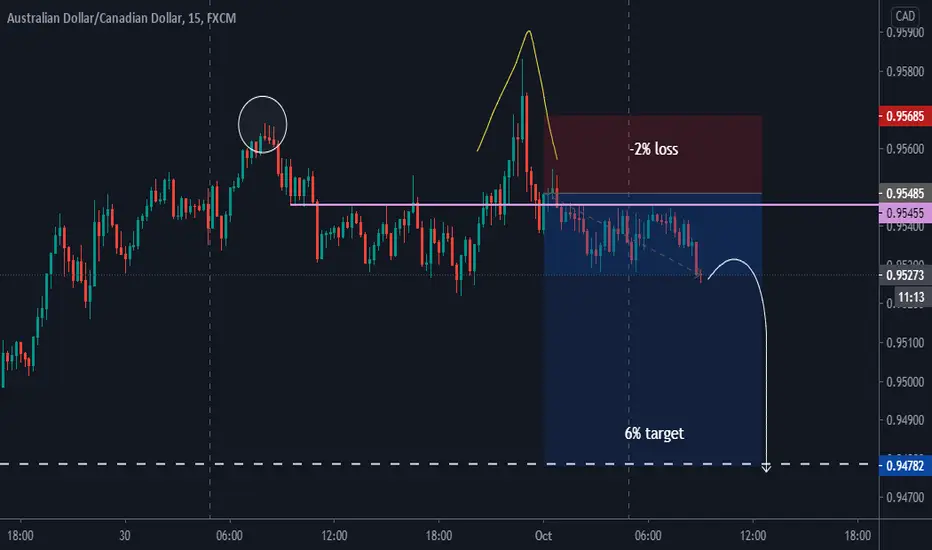
Short after falling back into rangeshort after deviation @ range high.
- TP1 --> Mid range
- TP2 --> Range-low

GBPAUD - Sell Daily Triangle Break - Trend Continuation Hi Traders!
The market is in an overall Downtrend.
Let's begin the Multiple Timeframe Analysis with the Weekly.
----------
Before we start analysing this pair, here is an important lesson for everyone who's reading that:
You probably often heard or read in trading lessons, that you shouldn't draw many things into your charts.
But the truth is, that many of them don't even really know why. They just say "so you don't become confused".
Why is it so important? It's probably more than you think.
"so you don't get confused" - this argument is valid, but not everything
You focus on the main thing and you don't get unsure because of tiny barriers
If the trade goes negative, you calm down, because you see the reasons you traded
If the trade goes positive, you don't get scared, because you know how to exit
If you go through your Journal, you instantly understand the reasons why you traded, that can help you identify the Winners and the Losers and its Setups
It gives you the skill of keeping everything uncomplicated
You can share your charts easily, without explaining :)
----------
Here is the screenshot:
Why did we share the information above? Because of that example we give you now.
As you can see we only drawed one Trendline into the entire chart.
This is enough to get us an idea of the current market situation.
The market broke out of the Trendline downwards.
Then it retested it and it is continuing further.
Conclusion: We're only intrested in taking Sell-Trades.
Moving on to the Daily.
Here is the screenshot:
This is the zoomed up situation of the Breakout.
Here we can see the daily Triangle.
Moving on to the H4:
Nothing new at all.
We only established the Target area, which is the tourquise dotted horizontal ray.
In addition this is ray the 78.6% Fibonacci Retracement.
Lastly, the Entry Timeframe:
We here see a Wedge Pattern.
We're waiting for the Break of the Daily Triangle and the Retest at the upper Trendline of the Wedge before we enter the market.
The SL is a decent distance away from the recent high.
The risk-to-reward ratio is better than 1 to 3.
We recommend to trade the Breakout with a strong Retest.
Thanks and successful Trading :)!


Candle AnatomyDecided to start posting content. Going from Basics to more advanced topics, little by little.
If you're just starting to learn how to trade, here's the first thing you should know. What's a candle?
A candlestick is a type of price chart used in technical analysis that displays the high, low, open, and closing prices of a security for a specific period.
-The candle has an open and close price point in time. If the movement is upwards, then the candle will close above its open price. Consequently, if the movement is downwards, the candle will close below its open price.
-The wicks will show the highest and lowest prices in the market at that moment.
-When looking at the market structure, it's important to look at the body of the candles, not the wick.
-For identifying liquidity, it is important to look at the wicks.
*The information I am sharing is mostly for new traders.
*I am not Certified to give out any information, but I enjoy trading and enjoy sharing what I know as well.

Future of learning and education with $CHGGTA
-120EMA Support. High volume at $62 level.
- Early May 2020 shows double the volume from the previous highest volume day= Institutional accumulation. Average volume 2.8M. May 5th volume : 38.5M
- Distribution volume slowing down
- RSI reversal
- MACD golden cross
- Strong relative strength
FA,
- Integrated platform = Chegg study+ Chegg Writing+ Chegg Math solver + Chegg tutors + High quality future proof skills based courses
- Structural tailwind with e-learning/self-learning.
- Yahoo finance Growth rate : 25%+. Simply wall street growth rate : 68%
- FY15 to FY20 CAGR revenue 39%
- Accelerating Earnings, revenues and margins in consecutive quarters(Almost Code 33)
- Growing subscriber base= Network effect with more tutors and students
- High growth and high margin. FCF positive
- Good management
Current subscribers of 3.9M with 29% YoY growth. Total opportunity at 102M subscribers
- Baillie Gifford ownership : 11%. High quality fund ownership + Growing institutional ownership. #smartmoney
Concerns,
-Increased competition : Amazon, Khan Academy, Open study, Linkedin
- Physical textbooks are a thing of the past.
- Debt of 900M and interest coverage of 1.09. However, Cash is at 700M with a healthy current ratio of 8+
Added at $72.


Uncertainty of the MarketHi guys, to be consistent trader and successful trader, first you want to have a mindset of a beginner, willing to learn back from the basics
The mindset of you dont know that thing and by that your curiosity pushes you to learn things to decode that scenario. Always remember that there will always room for your brain to relearn again ang again. Happy trading everyone


Bank nifty... what can happen next!!!Out look for banks degraded loan moratorium hearing still pending!!! Plenty of bad news and much much of frustration for bank nifty bulls. This month is testing some nerves now! What can happen now, 21600-21500 is the strongest support we can have in September month if broken and shattered we can see 20900-21100 coming up ahead... with news playing its part bank nifty can pull down the nifty as well. So you can buy around 21750-21800 with sl of 21600 and target of 22000-22100-22200 and you can sell on rise as well with sl of 22250 for bull to be back in action 22550-22650 should be crossed effectively. Comparing the option chain data we can expect a bounce back now not a trend reversal as such.

Strong BTC support line + Bullish RSI divergence =BULLISH RUNHI TRADERS!
This BTC support Area is strong so far and when RSI help it, gonna be good sign.
A strong support {9800-10000) kept btc above support area and couple times Bitcoin touched it,as price action aspect we can say many buy orders triggered in this area which push btc up 200-300$ anytime therefore it is important support because of technical and Psychology matter for traders .(above 10k psychologically matters a lot in bitcoin market as many of you know}
At bottoms you can see RSI bullish divergence occur in 4H and Daily time frame , similar happen for MACD as well which confirms Rsi bullish divergence and give BTC a higher chance for Bull run. (MACD & RSI bullish divergence)
If BTC stay above 9800 in next couple hours it will be another good News for Bulls.
Please share your idea and leave a LIKE . I'd really appreciate it.
Good Luck and Good Profit.

FLDM: Am I just seeing rounding bottoms everywhere?FLDM hourly chart.
Just wanted to publish my chart before it gets cleared, lol.
I think I see a rounding bottom on this sucker.
Also potential gap above.
Blue lines are what I think are res points.
I have short term and long term fibs showing, hopefully charted properly.
The candlesticks are Heikin Ashi.
The candle filler-colors are representative of RSI.
Vertical Lines:
Yellow (pre-market start)
Green (market open)
Orange (power hour/market close/after hours start)
Red (after hours end)
RSI Colors from High to Low:
Bright Green
Green
Dark Green
Light Blue
Dark Blue
Yellow
Orange
Red
Dark Red

USDCHF still bullish ,still goingThis is one of those trades I wish I could have put more into. Excellent climb thus far. Just wanted to update and say even though I moved my price a little higher to take a larger return (.01) to (.02) I’m still getting a good run.
How are you all doing with this trade so far? Are we all in profit?!

Daily Wisdom 16 - Track what mattersDaily behaviors leads to results. Too many focus on the results while lacking daily behaviors. No wonder they fail.

eLEARN ON 4 TYPES OF INDICATORSI was supposed to give some few tips on how to check some market movements through some of indicators which I Also use.
Bullish or Bearish indicators are classified depending on what they indicate; They either indicate;Volatility , Momentum, Volume and Trend.
I will give an example on each type.
Volatility Indictors show price action change in a given time,Tells nothing about direction but how the fast the price will change for you to make profit. Example is Bollinger bands.
Momentum indicators show how strong the trend is, with them you can detect when a pullback is going to occur or a reversal. Example is RSI indicator.
Volume indicators show how volume is changing with time like the OBV.
Trend indicators tell you which direction the market will be moving to like MACD. Mostly are oscillators.
I will cover an example on each in 4 episodes.
In Trading all indicators have their limitations and one can not depend only on 1 indicator , I will also show you on you can use several indicators combined.
EPISODE 1
Bollinger bands - Volatility Indicator.
They consist of a simple moving average, and 2 lines plotted at 2 standard deviations on either side of the central moving average line. The outer lines make up the band.
Simply, when the band is narrow the market is quiet. When the band is wide the market is loud.
Trading when market is trending, Bands try to squeeze to each other and that indicates that Breakout is about to happen either and Uptrend or down trend.
If the candles breakout below the bottom band, the move will generally continue in a downtrend.
If the candles breakout above the top band, the move will generally continue in an uptrend.
An example of Bollinger indicating a breakout.
Point to NOte:
If the candles breakout above the top band, the move will generally continue in an uptrend
If the candles breakout below the bottom band, the move will generally continue in a downtrend.
Bullish
Bearish
When Trading in a ranges when coin is maybe accumulating or distributing, Bollinger bands act as Resistance and support at that particular time. When you want to enter the market, You can always enter at the bottom of the lower band and sell at the top band to avoid a breakout which may happen which could be a down move or uptrend. If you enter for a long at the bottom of the range or short at the top of the range, The price naturally returns to the average as time passes.
That’s what Bollinger bands are all about; keep following, next episode is well lined up.

PM Call ideaBroke out over the resistance and the CM guppy has recently flipped to a confirmed uptrend. Would like to buy an ATM call option in the 1-2 month range on the retest of the resistance, or the 200MA if it breaks down further.


EURUSD-2hr's Educational - 7 Steps To have A professional Entry🗒 Just browsing through my analysis means a lot to me.
➡️ Please follow the analysis very carefully and every detail of the chart means a lot. And always entry depends on many reasons carefully studied
Always enter into deals when there are more than 5 reasons
combined
Step Number 1
Turn level Trend .
. Play Support And Resistance Rule In The Past
-----------
Step Number 2
Draw & Find Major Trend 3 Reversal's
------------
Step Number 3
Find Channel Formation Near The Price
------------
Step Number 4
Search For Highest Volume Bar From Price Area
and Draw Rectangle that area
------------
Step Number 5
We Can Use Volume Spark As Very Good Target's level
or take it as Station's for Price and Good Entry's
------------
Step Number 6
Draw Turn level Support and Resistance
------------
Step Number 7
Volume Profile Point Of Control
So Important .. High Success Chance to Take Action Here
--------------
For Example Shorting Position ---
Break Out Point - For Example
---- 1.17000
Trend Break
Turn level Break
Turn level Break
High Volume Break

Daily Wisdom 04 - Less is moreSometimes the most beautiful things happen without human intervention.
