pound yen analysis dec28 2017 : short then long Hi everyone
if we going south a bit more I have marked out an area which can be great risk to reward to get in on this trade if we see some bullish confirmation and a huge plus if we break to the upside
be warned though this market can slip further south if it doesn't stop where my tp is and keeps running : so If this market does run look for signs of change is my analysis on the market
Kris
Learning

Pound Aud Analysis Dec 28 2017 correction then short Hi everyone
what I see at the moment is if this market follows on this correction and if we see price action and some candle stick movement with confirmation to the down side then the following tps will be an idea for this market to hit
Hope everyone is having a great year trading
Kris


BTC Beginners Evaluation - Bull Run How Far will it go?Looking at all three runs within Bitcoin so far, these have increased in the following order:
1st +1727%
2nd +1412%
3rd +2657%
The upper and lower bounds should be taken into consideration for the next bull runs.
It may well be the case that the next bull run exceeds these limits due to mass market adoption.
At this current time Bitcoin has seen an unforgettable year and with more and more people investing in this currency, it may well be that the upper bound we see here is used as a lower bound prediction for future bull runs.
It is interesting to note that the fibonacci sequence depicts a natural expansion and this could be predicted for the next bull run if the market/coin does not experience any bad press in the coming year.
The businesses involved in this industry have made a lot of money this year and I can only see them investing more into the industry as a whole to make it go even further.

BTC Beginners Evaluation - First Two Bull Runs vs CurrentBased on a hypothetical point in the cycle called 'Current Period' on the above chart, what would happen if we plotted the same behaviours (percentage increase and duration) from the last two cycles.
Firstly I would pick a beginning point to define the start of the bull run, termed 'Estimated Start' in the above chart.
I would then plot the % increase with the corresponding duration for the short and long term bull runs we previously saw.
Short term: +1727% 89days
Long term: +1412% 152days
From these indicators we extracted from the first two bull runs we can see that at the 'Current Period' the real life (current data at that time for hypothetical sake) the indicators are no where near the actual trends expected.
This is quite possibly because its a non-linear relationship, so if we picked a start and adjusted the formula to suit the 'Current Period' this would allow us to calibrate our prediction. This is better using a non-linear power formula derived in say, Excel.
Looking at the difference straight away, we could possibly adjust the days and estimate how far into the run the bull has ran however this becomes more of a guessing game if we go down this route.
The next stage will be to develop a non-linear equation in excel and apply this to the analysis.

>>EURUSD<< >>December Week 3<< Short SetupW.W Wave rider
Short @1.18050
Sl @1.18630
Tp1 @1.17300
Tp2 @1.16850
Happy about every feedback or Idea :)
W.W


magnificent what an amazing support team I've discovered so fast. Incredible stuff developing mentally here!! #datadash thank you so much.


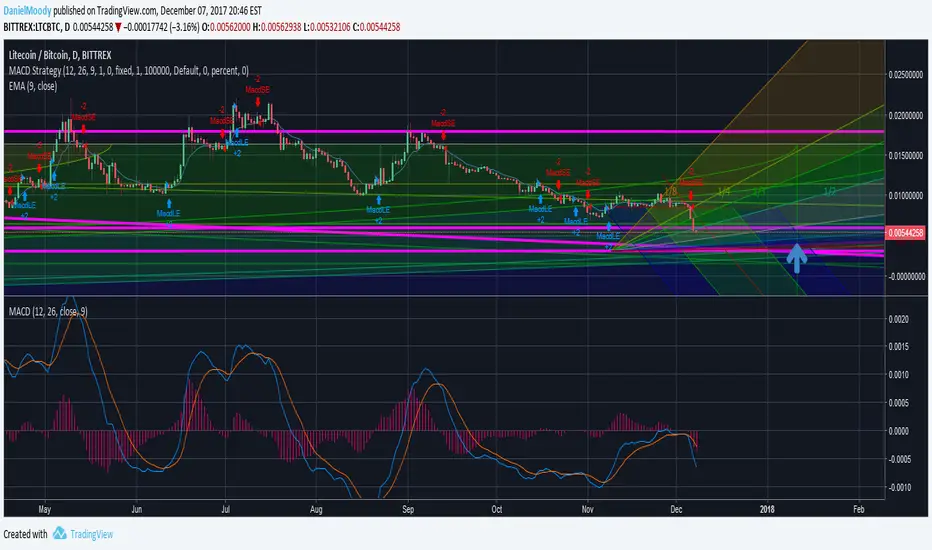
Yes, might as well jump in here.This market is insane. I have been glued to charts for the last 3 weeks or so. I started this journey scrying US market data on Android trading apps supported by about 5 hours of life experience. With the immense support and guidance of others dropping breadcrumbs all along the way in cryptospace I've in the last few weeks learned to produce and talk about a charts (see image). I've also developed a craving for feedback and community support from those more insightful so someday I can confidently enable others. I am a passionate teacher. What an amazing time we live in. This revolution is an inspiration and already I find myself passionate about making it bigger and better as much as possible. I want to sink my teeth into this thing. Still shooting fast and loose today but we can focus that energy right? I hope this chart means something to you. I hope you help open my eyes into this amazing world. To the Moon. -DLM

EURCAD short positionEUR/CAD short position on daily timeframe!
published by learningcurrencytrading.com

USD/SGD long, D1USD/SGD on daily timeframe! Good long position!
published by: learningcurrencytrading.com

USDCAD Buy IdeaWhat do you guys think, we might see a pull back if price breaks the trend line.
Any objections/suggestions are welcome.


USDJPY Sell/Buy ideasI'll personally wait for a push or pull, what do you think ?
Please leave a comment.
Any objections/suggestions are welcome.

EUR/USD Sell IdeaWhat do you guys think ?
I see a possible pull back.
Any objections/suggestions are welcome.

USDJPY Buy IdeaWhat do you guys think ?
Price may bounce off this support and go back up to 113.900 - 144.000.
Any objections/suggestions are welcomed.

USD/JPY Sell maybe What do you guys think ? Will the trend continue if it breaks that support ?
Any objections are welcomed.

Bitcoin Correction Wave 5 have hit a %161,80 on fibonacci level. set up from, wave 1 to 3.
a correction may have started. we will see.
People have gone crazy over bitcoin and it can drive the price higher to aprox 8000$ before we will see a correction of A,B,C.
The C wave will be a bit higher, i will try to update a new chart if this happens.
Scroll around on the Chart, and comment if i haven't done something right. I will appreciate that! :)

usd yen analysis Good afternoon everyone
okay looking at usd yen we are in a down trend is what it appears me , however here are a couple things I see
: we are in a channel down
: down trend
now if this breaks this channel as I have shown I will wait for the retest along with putting the stop just below the previous lows as shown and go long
or
if this market reacts to the channel and keeps going short , I will wait for it to hit where all the buyers are and look for a place to get into the market for a long
your friend Kris
www.mymentortv.com

An example of why I do not use hard stops. Mental stops only.A good example of why I do not use hard stops. I use alerts and watch it closely as possible when the alert goes off. I usually reset a new alert lower that is a "get out no matter what level". Stop was briefly hit twice. After it reverses I set my alert back up and continue on.
This my new, shorter term strategy I am developing. I will do a blog post at some point about it. Bought at .00136, Stop .00129, Target1 .00143, Target 2 .00150.

NZDUSD down move into the mean priceHi guys, and I hope you all had a great weekend.
NZDUSD looks good for some downside. I am expecting a move to the lows of the range. The price should break down, correct, and then have another down move where I expect price to finish at the mean price level. There is also lots of structure at the mean price level so this is a good indication that the target we have is legitimate and more reliable.
Best regards,
Tom_Killick
