GBPJPY LONGTrade had broke the resistance which then became the new support and then retested it. It since then started rising
I believe the trade will go up towards the trendline area, which I personally set take profit. The next decision happens from around that area whether it will break or respect.
If it breaks the trendline and closes above then I believe that it could possibly go higher to the next key area whereas if it respects the trendline it could just be a lower high and will drop after that point
Learntotrade

GBPJPY LONGThe trade has recently broke the resistance (now the new support) and then then tested the new support. Now currently rising
I think the trade will go up to the trendline which it has respected in the past and then the next decision is from there. If it breaks the trendline and closes above it could possibly go higher to next key area but if it doesn't and decides to respect the area it could then come back down, treating that area as a lower high

USDCAD IDEAMy thoughts on two alternate ideas:
IDEA 1 - If it breaks the support zone and the trendline it would go lower to the next zone which is either at the 38.2% or around the 61.8% on fibs (that's more long term those levels as I did the fibs a bit wider, however even if I did a smaller fibs the zones I drew out will still be around key levels).
IDEA 2. If it instead respects the trendline and pretty much the support zone then it can go to test the resistance zone. Also I did a counter trendline as that could be a possible confirmation for it to go higher plus a possible entry once it breaks and then retests. If it gets to the resistance zone at the top, breaks wait for the retest there and there's a good possible entry.
When it does break the zone that's when you drop down to the lower time frames to get more precise entries on the retest

CADCHF Pair Technical Outlook. Easily Headed South!CADCHF does not appear to have any rallying power what-so-ever. The chart looks exhausting, the news surrounding the pair is uneventful, and the technicals are pointing south on the daily and weekly. In my opinion CADCHF is headed for down.
-Wish you guys much success; don't give up.
-StampsFX

Possible GJ Sell Idea!Looks to me that the GBPJPY will struggle around the resistance heavily as it has tested it multiple times already and hasn't broken through in the past. Who knows though maybe it will, you can never know? However more likely a sell looks more like a viable option, dropping heavily all the way to the 61.8% on the Fibonnaci which is a key support zone also. On the way down there is a second possible trade entry also midway at the first support zone, in case you get in late but wait for the pull back once it breaks the zone. Yet again it may not break the support and then test the resistance again, so who knows?
But overall, as I see it right now it looks like a very good trade.

EUR/USD medium-term long.The price has overbalanced the previous Lower-High so this is a good bullish signal.

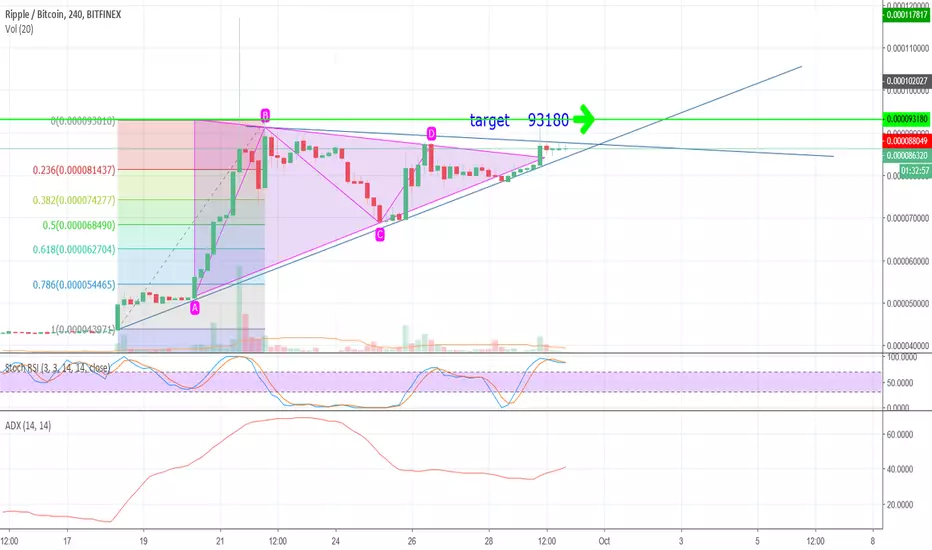
looking @ another xrp jump/ what do you think? if you are going to be an ass just stay away, looking at the 4 hour will we see retest and climb?
could this be the next line of climb that xrp gives us? what are your thoughts and projections?

xrp looking up and long EOY xrp looking like it might take a short bounce and test some support levels before moving up even more
Real Price vs Heikin Ashi PriceHi!
This is just a quick study for my own curiosity.
It maps out the real world closing price vs the Heikin Ashi closing price. I think I'll make the indicator a mainstay of my trading charts, as it's useful to see. It also makes manual backtesting more viable.
Some interesting observations:
Long-term average difference between real world closing and HA closing ranges from 1 - 4 pips.
There are intermittent spikes of up to 10 - 12 pips. These happen fairly infrequently (depending on the time frame being viewed).
On average, HA prices are closer than I thought to real world prices. I would have expected an average greater than 1 - 4 pips.
Spikes in difference often signify important points. Primarily they seem to signify new or continued trend activity in the relevant direction, but sometimes they can indicate tops or bottoms. Could be interesting to try and build a strategy around it.
I'm not sure if I'll publish the Real Price indicator (it's literally just a few lines of code), but let me know if you want a copy of it.
Cheers,
DreamsDefined

Platinum with a lot potential to the upsideAnyone familiar with the Commitment of Traders Report knows that the commercials have reached an extreme range that leaves much room for rising prices. Added to this is that the chart image with the recently formed double bottom looks bullish.
This is what a trade might look like:
- Entry immediately
- Stop Loss below the last local low
- Take profit with multiple exits (scaling out) first profit taking at $875

BTC We picked the RALLY, now let us show you how to PROFIT from
In our first post we said BTC had shown its first REAL Bullish signs and we needed to be patient. The bullish run is now confirmed with us also above a long Term Trendline.
This is where trading skill and experience comes in. The longer it goes up, the stronger it looks the more the amateur wants to buy it. But the more the professional knows that price us getting closer and closer to a pullback and must learn from watching his wife shop for shoes, and wait for a better price.
So we are waiting for some of the existing buyers to take some profits and turn the market down. A pullback to our 6913 level (Black Line) and the 50ema (Red Line) seems most likely at this stage. Then we will look for a buying bar in our time frame and look to enter. I will talk you through this as we go. (I do aplogise for no recent posts a bit of a bug has kept me in a different room in the house).
The time is coming for profits to return to BTC traders. Be a bit more patient wait for the best entries and give yourself the best chance to join the party.
Trust your TA that’s Technical Analysis not Technical Poop or Technical Meditation or any other hyped up Darkness. Just trust the Analysis and be patient and start and make some money.
Remember if you want to make Dollars your decisions need to make sense. If you want that to happen Likes are nice, but FOLLOWING is how you get the best information first.
Chill

USDJPY BIG Drop knocking at your door USDJPY IS OVERBOUGHT IN OUR 4 HOUR TIME FRAME IN DIVERGENCE TO THE DAILY CHART. EXPECTING TO REVERSE
www.facebook.com

Soy Crush Spread at its EXTREMEKeep an eye on this extraordinary extreme in the soy crush spread. This spread includes 3 futures: soybeans, soybean oil and soybean meal and to be exactly now it is time to sell this spread!
What do you need to do to sell this spread?
To sell this spread you have to make 3 transactions:
BUY 1 soybeans contract
SELL 1 soybean oil contract
SELL 1 soybean meal contract
Why do I see numbers in front of the chart symbols?
You can see different numbers in front of the contracts like "2.2*ZM1!+11*ZL1!-ZS1!" because of the different multipliers in the futures contracts.
Of course, you also make this trade with CFDs, in this particular case you need to have positions sizes with a similar nominal value

Spread in an extreme areaThis calendar spread is currently close to an extreme again. If you want to short this spread to exploit the mean reversion effect be careful because this specific spread (September/October) is only tradable until mid of August!
A first take profit could be the level of $1 if you are conservative. If you are a bit more aggressive then you can close the trade at a lower level, for example, $0.80 or even lower.

GBPCHF Short Trade EntryGBPCHF has broken to the downside on a 3 wave structure on the daily time frame and has done so on the H4 time frame as well. This is an indication of a continuation to the downside.
Trading Signal Service: www.greenboxmarkets.com
Forex Trading Course: www.greenboxmarkets.com

HOW TO TRADE CONSOLIDATION The short answer: DONT.
I've decided to use EUR/GBP today as a prime example of when to sit on the sidelines and not risk a cent of your capital. As you can see, the past 7 weeks have been an absolute mess with price looking very indecisive and all over the place. This means that traders are not able to come to a consensus of whether they are bullish or bearish on this particular pair. Now remember when you are trading you want to be able to identify and execute your trades where there is likely to be a large amount of buy/sell orders (particularly 'smart money' orders however this is a lesson in itself) and if price is just moving sideways, how exactly will you be able to do that? The answer is most likely you most likely will not be able to. The trick with trading consolidation is being able to stay patient and let the masses fight over a measly amount of pips while waiting for the market to show you the direction it is heading next. You will be able to identify this when price clearly breaks the current consolidation either to the upside or downside. When this happens after a long period of consolidation, you might notice it does this with tremendous strength (I like to picture this as the market 'coiling' up before releasing its stored energy to either the bull or bear side). Now the question you should be asking yourself after that point is ''How can I now take advantage of this potentially newly formed trend?''. Instead of just getting long or short as hell after seeing a breakout, I like a little more confirmation before putting any of my capital at risk. This usually comes in the form of a pullback to the first potential lower high/higher low after the breakout has occurred and this is usually where I look to place an entry if my strategy signals to do so.
Hope you were able to take some value from this mini lesson, let me know in the comments or PM me if you want more short lessons similar to this!
Have a great trading week.

Short the Soy CrushThis very interesting soybean crush spread is very close to its extremes and we think it is a good idea to short this spread. To do this, you need to buy 1 contract in soybean meal, 1 contract in soybean oil and buy 1 contract of soybeans. Our target is the level of 130 and we are willing to sell one more spread at the level of 180.

EDUCATIONAL MATERIAL- Bitcoin I was thinking about this educational material for a long time and finally I have the chance to share it with you, all of you who want to improve your trading style, to be more profitable. This is specially for those who find it too difficult to trade and everything goes against them. I spent years to improve myself and become profitable, starting from the bottom, never had a personal teacher and never went to a finance university, learning everything by myself. A lot of times I wished to have someone who could help me or give me some tips but I had to learn everything on the hard way
I will start with the thing that I think is the most important in profitable trading .
Price action. Listen, there are a lot of strategies out there which work, everybody has their own style. Boolinger bands, pitchforks, heikin ashi candles, renko and dozens of indicators. All indicators are made from price action; open/close high/low of candlesticks.
Price action is the most important tool for a trader. It is used by institutional traders, by big houses and is the most accurate indicator of an asset, for the next move. And here I will teach you how to use price action in your favor.
On a daily chart, you can put a moving average to see clear how is the trend. Is there a bullish market, bearish market or ranging. Let’s see for example on my chart the 20 period Exponential moving average. After price action, the 20- period EMA is very important, especially on a daily chart for bitcoin because it acted like a resistance for many times this year. You can check the chart. Why not a single top trader from TV is using or telling something about it is a mistery for me. Few days ago I could bet the last move up will find difficulties to march further when it touches the 20 EMA. So simple. Let’s go back on price action. I marked on my chart LOWER HIGHS and LOWER LOWS. When you see a market moving like this you don’t want to go LONG until this trend is over or is bouncing back from a strong trend line.
First rule of a reversal; keep this in mind: If there is a downtrend the price has to make a higher low and then a higher high for a clear confirmation of reversal. In case we have a trend line wich acts like a support and if price bounces from it we don’t need to wait for a higher low and higher high. Let’s say we exclude that trend line, for a revearsal, usually the price needed to stay above the previous low made on 28th of May at 7065 dollars; then move higher than the previous LOWER HIGH marked by me with yellow, and after that a retest of it. Retests of the previous lower high usually occur and that is a clear confirmation of a revearsal. This is the most important weapon you need to master to be profitable in trading.
Same thing is when the trend changes from moving up to go down. First, you have HH and HL , then usually fails to make a higher high, it drops lower than the previous low, goes a little bit up again to retest the previous low and boom, trend is changed, the market is falling. Perfect example look for Bitcoin’s price action from 25th of February to thirtheen of march (on a daily time frame- is easier on the beginning because it takes out the noise).
Look for trendlines, try to analyse how long can you do it to see everything, the details. Support and resistance zones are very important also, look at my chart white dotted lines around 7800. See how the marked reacted around them and try to memorise. You have to learn the chart patterns. The most of the time you will see wedges, flags and triangles and around revearsal zones there will be double tops, bottoms, head&shoulders. Try to learn them and practice to recognize them because it will be easier for you in future, helping you to know where the price will go. There are a lot of tutorials about chart patterns on the internet.

BTC Realtime Analyse #1Hello all my friends,
First of all i need to thanks all of you for your great feed backs and lovely comments and messages after my first serious work on TV.when i started i didn't really know if you like my style or not but i figured out that my style in analyse all micro waves and patterns in short time frames really can help you to learn more and trade base on those waves.It made me happy when i saw 12 people made money with that style and that happiness really made me satisfied.Many of you my friends wanted a TELEGRAM channel to notify easier and i will create one in new week.what you need to know its that i work as a Graphic Designer in my day time and Trading in my second job that have better income from my first job but i struggling for time and always searching for more time because of that it's little hard for me to update in several apps like telegram and twitter but i will make one and when it reach a good number in followers,i will start to publish there too.
Second,i must open this for those that not read my last TA.Realtime analye its a new style that focus on short time frames and finding patterns in them.with this style we can earn from little waves by swing trading and after that learn more by seeing different patterns and sign in day instead of one week or more.we will mixing MACD ,Ichimuko, RSI and classic charting to find answers in this style.
So let's back to the chart now:
We had 3 Scenario in our last TA here that 2 of them survived.we are stick to red scenario now but yellow one is in the play and we have not any sign to announce that one failed.for now we will continue Red Scenario that i draw it here.Red Scenario consist of channel that i draw and 2 triangle that i draw with dotted line.for now it's our long term trend line that we need to keep it live but as i said before we have many limits that make us doubt in it.this triangle formation from months ago can not have no meaning.for now it made for us two turning point.one at 8560 and another at 9060.if we break this limits our triangles will join in history.but don't forget our channel roof around 10500.it will biggest limit in our way to reach our ATH 1.95% but maybe our channel is not as strong as we think!!!Yeah that's can't true,every channel or trend line need 3 impact point to make it creditable and we have three too.because of that it can be easy to reach that point and break it,but for now let's see at past and not future.
As you see we are so close to break downward channel and after that we need to test it as a support then continue our new upward trend.for now we close 2 candle in 4hr time frame above EMA50 and it's a good sign,we need to test it as support and by that make a bounce over the downward trendline .
We have an almost crossover signs in MACD D time frame it can easily move us to 8200-8500.
We are above of ichimuko cloud in shirt time frames and near to break it in 4HR time frame.again it's good buy signal always.for those that did not entered with us from $7100 better to wait for break out and confirmation now,we are in little risky situation.
I will update this idea as soon as find new sign.
For now,Good Luck my Friends
Best Regards
Peyman A

EURUSD Head & Shoulders Pattern/Long Term Buy OpportunityEURUSD is heading down towards the weekly support at around 1.16414 then I expect that it would then go back up towards 1.20850 and could then either form a head and shoulders pattern or could go over and continue to go up towards the weekly resistance area at 1.25701.
Looking at the indicators such as the RSI and Stochastic also on the Weekly chart, the Rsi looks as if it's heading towards the 30 mark and the stochastic is already below 20. If the Rsi gets below 30 (Oversold Zone) and then the blue line crosses the stochastic and is now on top of the red line then expect that it would go up.
Keep a look out for the rsi and stochastic though when it gets to around 1.20850 as it could show signs of reversing. Other than that guys it looks like a good long term buy or head and shoulders pattern.
You could place shorter terms trades on M15 in between to make money as the market moves around

GBPJPY Potential Daily H&SThis could go either way right now, look for the Break of the 147 Neckline for a very nice short opportunity on the retest. Alternatively look for Buy confirmations back up-to 150 or even to the upper trend-line for the Wedge Formation.
Double Demand confirmation of Trendline and Support area so the Bias has to be upwards until broken.

GBPCAD Retest of Triple Bottom Formation WeeklyWe have 3 instances of Demand being hit right now, the 200EMA coming into play on the Weekly and the Daily so we can look Long on price action confirmation. Potential Triple Bottom completion and retest before moving up in wave 5.
Potential Trend-Line Break is a slight worry but with good price action it could be a very nice Swing.

Gold Potential Double Demand Hit Gold has dropped to just above the $1300 threshold once again - This time in conjunction with the Daily 200 EMA. We could see a nice move up however it may be limited to the 38.2 where it would meet a potential Trend-line break (Retest) before continuing down, on the Flip side of that, the push from the EMA could push it through the Supply at the top for a Long Term Hold.
Price Action is Mandatory as the USD is very strong right now and it could easily push below.
