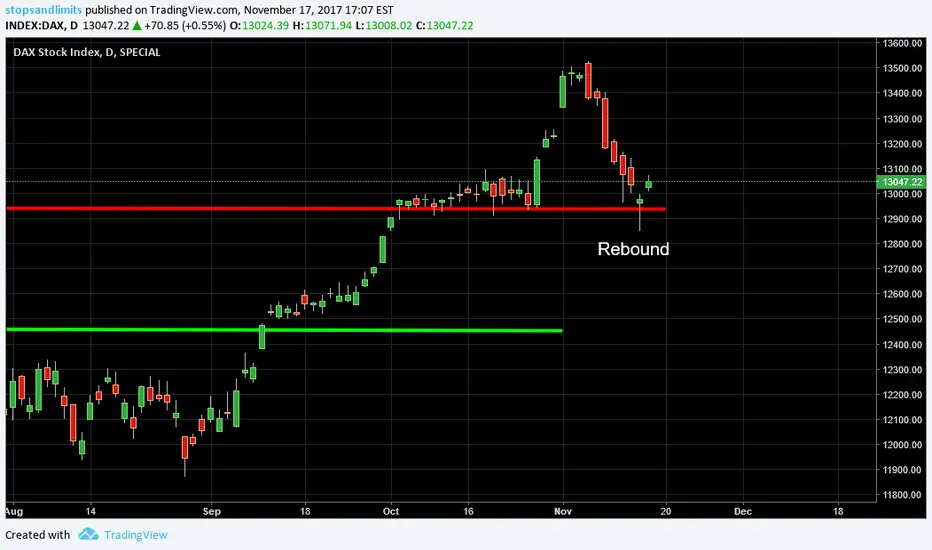
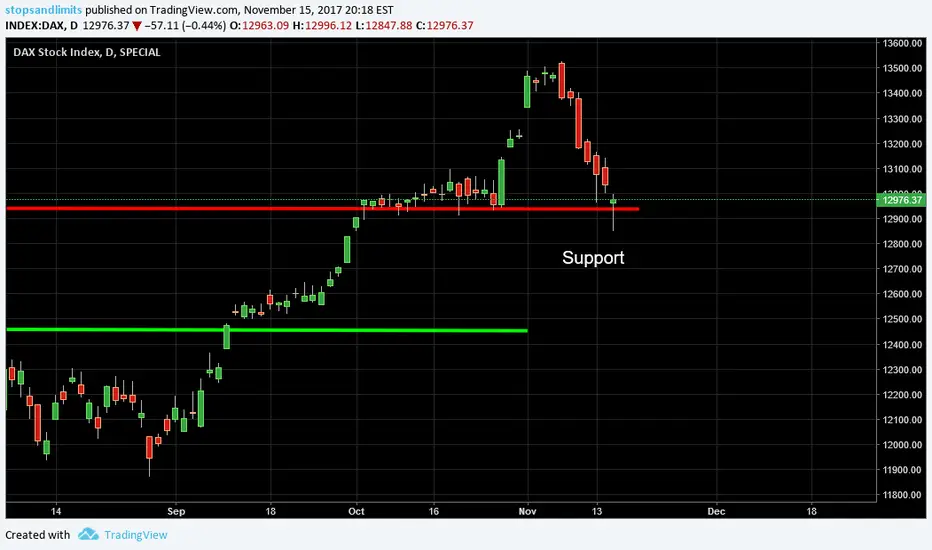
14/12/2017 FTSE100 AnalysisThere is a setback after a strong bullish trend, reaching the support level again.
Level


Expecting 4000.00 correction on BTCUSD PT 9517.00We are 3 deviations out on our apocalypse band.
We have rallied all the way from my entrance at roughly 2600 to 13800.00
A forced correction is coming.

ETHUSD Update Good for Day Traders, others look for lower entry ETHUSD Update Neutral in near term but still bearish whilst trapped under 440
Very interesting price action here: having sold at 468/9 we were waiting to see if ETH could hold up above the lower
parallel...it tried so hard for a few hours but eventually it succumbed...failed breaks: remember the pyschology gone
over in past posts...day traders are out almost immediately an ETH dives to find structure to left, losing the line at 446 like a
hot knife through butter, finding support around the next line of support at 433/target level for bears to close out shorts
with a low at 432 (mid structure here, so far) on the chart. Although day traders have bailed out some have bought back
lower and others, bemused by the price action remain long...the pattern is confusing in the very near term at that
point...bulls say it's cool, spike down, correction done, it's OK so long as 446 holds it up ...those looking at the bigger
picture are not so sure ...we did the right thing to trap in profits close to the highs of the run: and not to get trapped at
the 480 levels even though it was looking fine for a few hours before failing. It was OK to close out shorts at 433 too. But
this pattern is not healthy now. ETH has not finished its rinse out by look of it. More stale bulls need taking out, still,
before this is ready to rock again...it's till under pressure whilst unable climb back above 440 and hold up there...432
must hold now if ETH is to have a chance of stabilising here. Any failure here will tip ETH back into bear territory, forcing
price lower to 418 and likely spiking as low as 410 before rallying back to 432/3. Annd if at any point 410 gives way
by more than 3points look to shoort again on next pull back to 410 fr another decline to 385. Good trades here so long as we
follow what the chart is telling us. Initial resistance at 439-440. Needs to break above here and hold before the bears
will let go, then it should run up to 446-8 again and come off one more time from there.
Good moves for day-traders here but for swingers and those looking to buy this at a good price it looks like we'll get
a better chance from lower down if we wait, and not be tired by waiting, etc.


AAP New 1 Year Price Target: 152.59Arbitrage Level and Advance level are both above the 0 line which indicates all 5 of Arbitrage Bands are all pointing up for the first time since May of this year.
We have a new higher on yesterday within our Arbitrage Tick indicator
And 3 days ago Arbitrage Bands signaled a new up trend was beginning.
Stop loss is set at 86.54 which is the value of our RSI line within our Arbitrage Band

Fall down Friday Pick of the day : Vmw Price target 114.63We have topped out our Arbitrage Band, Novice Band and Advance Band.
Expecting it to test support on the Arbitrage Band at 114.63 before the next possible/probable move up.
Our Arbitrage Advance Level is struggling to stay above the 0 line which means our Arbitrage Band itself is changing direction and slowing turning down.
VMW has been rallying since it's first new higher high on July 17th of this year. The first new lower low will confirm the new trend.

JCP New 1 Year Price Target:4.95 Arbitrage advance level has finally crossed the 0 line which means our Arbitrage Band is finally pointing up
Arbitrage Tick has signaled we had a new higher high within the last 2 days
And the Arbitrage Band has signaled a green flag letting us know it's time to enter the trade.
3 standard deviations from our mean puts JCP at 4.95 within the year.

GBPUSD Buy point for entry long on cable. We find this entry point or turn point level for this session.
Ready for sell if this level will borken.

30/11/2017 S&P500 Analysis"Investors gained confidence that the Republican party’s push for a U.S. tax overhaul would succeed. " www.reuters.com

Long ULTA PT: 225.00Just got our green flag on the band.
Level is showing positive momentum on the stock
and tick is showing a new higher high!

29/11/2017 BTC/USD AnalysisAfter having broken the $ 10,000 level, the price reached a historic high exceeding $ 11,000, however, it had a strong drop to $ 9,000 and a subsequent recovery back to the $ 10,000 level. This situation shows the high volatility of the asset, strongly influenced by the important level of $ 10,000. www.reuters.com

SQNS PT: 4.51 within the next 3 monthsThe arbitrage band's rsi line has reached the bottom of the band and leveled out.
We also have a green flag signaling the beginning of an up trend.
The advance level on arbitrage level just crossed the 0 line which means our arbitrage band is finally also pointing up
Arbitrage Tick is also signaling a new higher high with Green crossing over red on the daily chart

Bitcoin: BTCUSD Update Key Levels inside the parallels now Bitcoin BTCUSD Badly Drawn Boy
Wow. Broken the upper parallel and now consolidating around
where we sold. It looks like a buy from 8530 but must hold
here or it's likely to fall away more, potentially back to 8410
at lowest so stops on longs from here need to be quite tight
underneath.
Bit slow to see the new fantastic parallels emerging...should
have used that and not the other dying parallels from the last
couple of days as exit.My slowness, looking at other stuff - But
have left the old parallels on which may look confusing but
it's interesting so see these old resistance lines now seem to
act as support, containing the consolidation inclose up...draw
these lines on your chart! They live...so no bying under that
big new powerful parallel now in control of the upside, and
careful with day trading...you can seewhat it's
doing...dancing between the parallels...so wild. Use
this...fine lines..fishing...for now. It should build a little
flag as it does it...two strikes on the lower line will show hot.
Otherwise not so much near term
And the Alts V Bitcoin will get some respite now so they are a
buy...You got this now. yes?

GE Mean reversion PT: 28.02 within the next 6 monthsUsing our weekly Arbitrage Band we see that GE is at a 3 deviation mean reversion which means within the next 6 months we are expecting it to revert back to it's means because it has fallen too far too fast.
See you at the top!

Bitcoin: BTCUSD Now that's a green candle - it needs sustaining Bitcoin: BTCUSD Lots of opportunities to get long again off the blue support at 7426 and a few points higher before Bitcoin blasted higher,
doing just what we needed it to without messing with heads at 7570. Now that's a green candle...worried we might see another blow off
top as the great whale surfaces and blows, like last time, leaving a great spout from here to 7890. so it's
Ok to take profits at the old highs and just under at 7850-7890 if they get tested today. We are running some serious profits
again so far and they need protecting, either running the stop close to the last minor low or at lowest 7550. And then, if we
see 7900 broken we can go long again with stops just under 7850.


Expecting HTZ Mean Reversion on Htz Hourly Chart PT:24.53Arbitrage Level has hit the bottom and Arbitrage Band is also touching it's 3rd deviation. Should be a nice bounce.


