Watch this Level: EURAUD Four-Hour #forexA good level to watch for trades for short term traders, watch for a rebound or breakout.
Good luck
Exclusively Subscribers to my mailing list will get one month access to my trading account . Subscribe here thefxchannel.com ,
My best regards
Technician
Level

Watch this Level: EURJPY Monthly Resistance #forexLooks like EURJPY is testing a key resistance here, watch out for short term bearish bounces. A breakout above that resistance more precisely the top of this resistance region at 1.3667 may also signal good long setups.
Good luck
Exclusively Subscribers to my mailing list will get one month access to my trading account . Subscribe here thefxchannel.com ,
My best regards
Technician

Watch this Level: EURAUD Monthly #forex1.4100 has been a critical level, so far the price fails to close a monthly candle below that support level.
We also have the rising trend line that started from August 2011 major bottom.
Exclusively Subscribers to my mailing list will get one month access to my trading account . subscribe here thefxchannel.com ,
Technician

DOW INDUSTRIALS - % STOCKS > KEY EARNINGS LEVELI've been doing this analysis by hand since April 28, 2015 in a spreadsheet at Google.
4/28/2015 1:30 PM 46.70% 53.30% 18111 17960
4/29/2015 9:44 AM 40.00% 60.00% 18083 17975 PFE, MRK reported
4/29/2015 2:26 PM 46.70% 53.30% 18055 17975
4/30/2015 9:55 AM 46.70% 53.30% 17968 17970
4/30/2015 10:47 AM 43.30% 56.70% 17930 17977
4/30/2015 3:54 PM 40.00% 60.00% 17876 17977
5/1/2015 10:30 AM 46.70% 53.30% 17977 17977
5/4/2015 10:47 AM 43.30% 56.70% 18102 18052 Apple rally faded right near KEY LEVEL.
5/4/2015 3:50 PM 43.30% 56.70% 18070 18038
5/5/2015 4:00 PM 40% 60% 17928 18039
5/6/2015 11:40 AM 40% 60% 17,865.67 18039 Biggest spread from the KEY LEVEL I've seen. Bond mkt and US DOLLAR tumbling
I've also added "% of stocks above their 50 day moving average" since I think that might approximate this indicator and to just see how helpful it is and to learn.
I've noticed so far that the market has traded quite closely to the KEY LEVEL so far.
Note we are right on the 66-day moving average, which is 1-quarter of data, which certainly is the time frame of the distance between earnings reports.
I put "short" on here because the DOW is below the KEY EARNINGS LEVEL of 18039.
How you want to trade it is up to you: I think you can execute right "at" the KEY level by selling a rally up to it and risking 1 average range. The target might be just 1 average range also. That is just one method of trading this. You could certainly trade this any way you see fit. The key is knowing if the market is being "accumulated" or "distributed" and as it is now, it is being "distributed" since we are below the average KEY LEVEL. It shows that people are disappointed with the earnings reports and the forecasts for the coming quarter.
Cheers.
Tim 12:02PM EST May, 6, 2015

AUD/USD Analysis 30.04.2015Background:
Aud/Usd Remains in a downtrend but we found support @0.75600 ish level and price found balance,
we formed a minor range between 0.7560 support and 0.7914 resistance , where price broke thru resistance
but price traded back into the broken resistance, however its not over for the bulls as the up channel is still intact
and if we find buyers we may head back aboove to retest the current high @0.80600
Signs of Strenght:
price found support
broken resistance
up channel
Signs of Weakness:
Downtrend
broken resistance didnt turned support @ retest
Key Levels above current price:
80750
82500
79800
Key Levels below current price:
78180
77200
75600
sidenote:
A Trading channel is nothing but a diagonal trading range where the upper limits is the oversold level and the lower limits is the oversold level , whereas the mean in this case rising represents fair value. and as it rises so does demand , if price fails to take out the lower limits of the channel and we break the RED trendlines this indicates that demand is in charge and any higher low can be used as an entry signal for a long position

Anticipatory OverviewWe are sitting on a prior consolidation level (230-235).
These are the possible outcomes:
235 holds, we break up, inverse H&S resolves, target 280-290
235 breaks resulting in a meassured move down to 180
Last time market retested such a major consolidation level from above,
OBV was in a downtrend, thus price continued the downtrend.
Rightnow we have a similar situation only that OBV is in an uptrend.
This may be a hint for a bullish resolution of this situation.
Also we have a tripple bottom with long wicks at this level, suggesting strong support.
Large volume is required to create a convincing breakdown.
Check out the charts linked bellow for more details about my bullish bias here.
Cheers : ]

Watch this level: WTI Oil DailyThe next potential key resistance area to watch for the NYMEX light sweet crude over the near term.. watch for a reversal or a breakout. A good trade could be at hand soon.
www.thefxchannel.com visit.. vote..subscribe

Watch this Level: SPX Daily The key support area to watch for the SPX over the near term.. watch for a reversal or a breakout.
www.thefxchannel.com visit.. vote..subscribe

Watch this Level: AUDCAD Daily The next potential key support area to watch for the AUDCAD over the near term.. watch for a reversal or a breakout.
Note: could be a good area to scalp longs..
www.thefxchannel.com visit.. vote..subscribe

Watch this Level : EURGBP DailyThe next potential key resistance area to watch for the EURGBP over the near term.. watch for a reversal or a breakout.
Note: could be a good area to scalp shorts..
www.thefxchannel.com visit.. vote..subscribe

XAUUSD Potential ShortBearish Trend could continue if we see positive NFP results for the USD, If the respected level is broken we could see a major crash in the price of Gold.

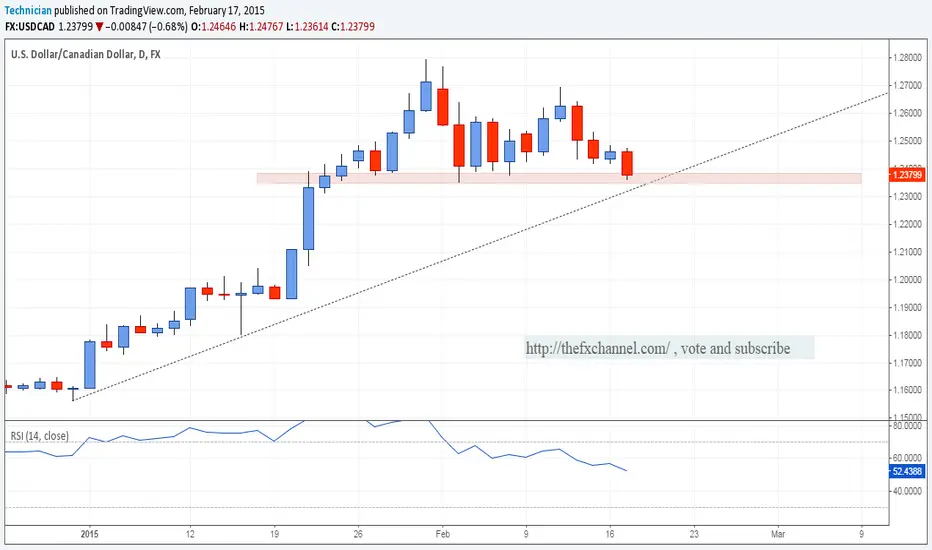
Watch this Level: USDCAD Daily The next major Daily (short term) support level to watch for the USDCAD. Watch for a rebound or a breakout. Looks like a great tradable level. A break below increases the chances of more downside.
Check my new website thefxchannel.com , vote and subscribe
My best regards,
Technician
Watch this level: #Copper DailyThe next major Daily (short term) resistance level to watch for Copper. Watch for a rebound or a breakout. Looks like a great tradable level
Check my new website thefxchannel.com , vote and subscribe
My best regards,
Technician

Watch this Level: Johnson&Johnson Weekly The next major weekly(medium term) Support level to watch for J&J. Watch for a rebound or a breakout.
Even if witness a breakout, usually short term bounces are highly probable before any sustained breakout.
Check my new website thefxchannel.com , vote and subscribe
twitter.com
My best regards,
Technician

Watch this Level: #CADJPY Weekly | #FOREXThe next major weekly(medium term) Support level to watch for the CADJPY . Watch for a rebound or a breakout.
Even if witness a breakout, usually short term bounces are highly probable before any sustained breakout.
Trade forex with me, check my new website thefxchannel.com , vote and subscribe
Join me at twitter.com
My best regards,
Technician

Watch this Level: #Google Daily The next major Daily (Short term) Resistance level to watch for Google. Watch for a rebound or a breakout.
Even if witness a breakout, usually short term bounces are highly probable before any sustained breakout.
Trade forex with me, check my new website thefxchannel.com , vote and subscribe
Join me at twitter.com
My best regards,
Technician

Watch this Level: #GBPCAD Monthly | #FOREXThe next major Monthly support level to watch for the GBPCAD.. This level was recently broken and turns now to a support, we might see bullish resumption on a retest of that support , seems like a great place to look for long setups...
www.thefxchannel.com .. visit .. vote.. subscribe
Technician

Watch this Level: #EURGBP Monthly | #FOREXThe next major Monthly Resistance level to watch for the EURGBP.. This level was recently broken and turns now to a resistance, we might see bearish resumption on a retest of that resistance, looks like a great place to look for short setups...
www.thefxchannel.com .. visit .. vote.. subscribe
Technician

Watch this Level: SP500 Daily | #FOREXThe next major daily(Short term) Support level to watch for the SP500. Watch for a rebound or a breakout. A breakout below this support could be harmful...
www.thefxchannel.com .. visit .. vote.. subscribe
Technician

Watch this Level : WTI Oil Daily | #FOREXThe next major daily(Short term) Resistance level to watch for WTI Oil. Watch for a rebound or a breakout.
Note: Good scalping opportunities at that resistance.
thefxchannel.com .. visit .. vote.. subscribe
Technician

Hidden OTE LongPut the fib at the real breakout level (cause that's where the rally started then) and you get an OTE at 252. that makes good sense in combination with the price action we are seing now ... long wicks down to the ote (typical ote buying) !

Watch this Level: #EURNZD Monthly | #FOREXThe next major Monthly(Long term) Support level to watch for the EURNZD. Watch for a rebound or a breakout.
Even if witness a breakout, usually short term bounces are highly probable before any sustained breakout.
Trade forex with me, check my new website thefxchannel.com , vote and subscribe
Join me at twitter.com
My best regards,
Technician

Watch This Level: #USD Index Monthly | #FOREXThe next major Monthly(Long term) Resistance level to watch for the dollar index. Watch for a rebound or a breakout.
Join me at twitter.com
www.facebook.com
plus.google.com
My best regards,
Technician
