USDCAD Short trade setupUSDCAD in descending channel in currently on vertical level, expected to go down ward.
Level

ETH LONG OR SHORT?HERE WE GOOOOOOOOOOOOOOOOOOOOOOOOO
CIRCLED AREAS- PAST RESISTANCE/SUPPORT!
UP OR DOWN ARROWS- MOST LIKELY PRICE MOVEMENT!
EXCLAMATION MARKS- CONFIRMATION AREAS!
-LEAVE A LIKE!
-COMMENT!
-LEAVE SOME REP!
-FOLLOW ME!!

GOLD Important Resistance Cluster Ahead! Sell!
Hello,Traders!
GOLD has now broken a minor resistance level
And is going up for now
But the most important resistance level is ahead
So far I am bearish biased
And I think Gold will bounce off this level
And we will see a pullback to retest the support
But if you are bullish biased don't buy BEFORE the BREAKOUT
Sell!
Like, comment and subscribe to boost your trading!
See other ideas below too!

SFP/BTC - Will the level 0.000042 provoke pumping?Hello everyone, analyzed the SFP/BTC pair
Long fall period
Exit from the triangle. Several retests to the support level.
Target on the chart. Stop loss for your trading system. A close above the level of 0.000042, in my opinion, will provoke an impulse growth. I do not look into the future - I trade wisely, and I wish you the same.

XVS/USDT - The price is pressing the support levelHello everyone, analyzed the XVS/USDT pair
The trading chart shows the zones from which you can work in #long
I expect a "false" breakout of this level and already from such marks as 31-33 one can take orders to buy.
You can also trade on the breakout of this channel. It all depends on how the price behaves.
"This is just my opinion, trade with your trading system."
"Have a nice day everyone and come."

GBP/USD - More Downside Potential Imminent?We have been bullish on the USD for some time now.
We've seen a break of our ascending channel and key level in the market in the latest bearish 4HR.
Right now we're seeing some rejection of 1.38.
Be careful trading this market today with NFP figures out!


Black Ducks to Resist Banknifty in near terms.Theres no denying to the level of sell off and thus looking forward to these resistance levels.

Weekly Outlook! 3/1 - 3/5Here we go over last weeks video and we take a look at a few things we are keeping an eye on for the coming week!


🏛GOLD WILL GO DOWN ↗️SHORT🔥
☑️GOLD is trading below a resistance level
From where I think it will drop down
In a correction move to retest the lower levels of demand
SHORT↘️
✅Like and subscribe to never miss a new idea!✅

GBP/USD - 1.41 Tag. The bull run continues.GBP/USD - 4HR Chart
Price has tagged 1.41. Last week we saw price finish above 1.40. This key psychological level (1.41) in price is coinciding with the top of our ascending channel on Cable, so will we see a bearish day for the pair?
Keep an eye on this pair. It is currently very fundamental. How much weight do these psychological levels have in these market conditions?

GBP/NZD - Break of Ascending Structure Will we see further downside movement on this pair?
We saw a break of structure last week after price tagged the top of our ascending channel around a key long term level in the market. Will we see price cycle down to the bottom of previous structure?
This pair indicates strength vs strength in the forex markets at the moment. Want to know what this means? Drop me a message?

USD/JPY - Price Following Forecast with Break to the UpsideWe've seen continued JPY weakness in the markets and a USD resurgence of late taking this pair higher and breaking through a key level in previous structure to the upside.
Currently price is following our forecast. Will we see a retracement to retest our level - or will price continue to head higher as the bullish cycle continues on the 4HR?

EUR/AUD - Bullish Push Imminent?Price is residing at long term lows in the market. We are seeing a triple bottom formation, and price begin to squeeze between our descending trendline and support zone. Can we expect a bullish push, breakout and reversal in the coming days and weeks?

Key Levels on bitcoin:-Bitcoin is on oversold Zone:-
Some correction is expected on day chart:-
Short only bitcoin if bearish confirmation candle forms:-


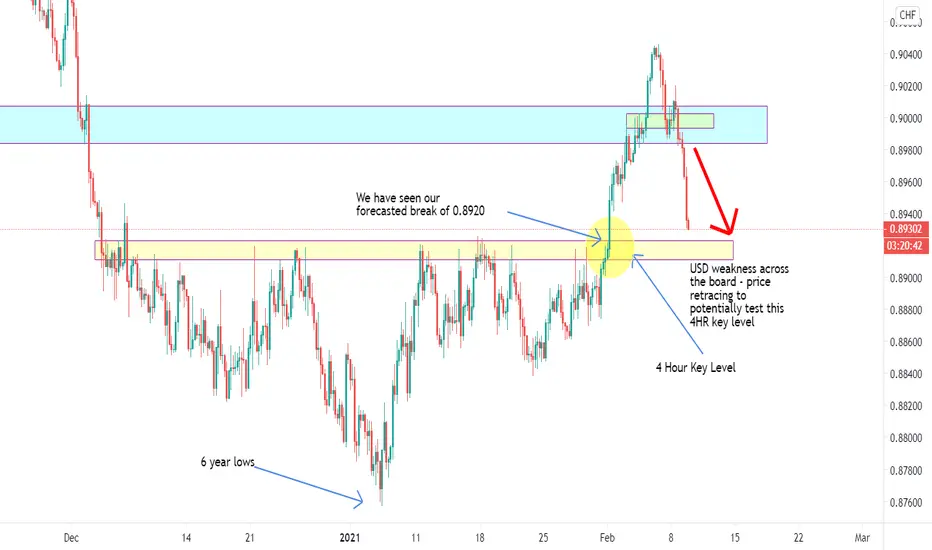
USD/CHF - Price cycles down to previous key levelWe've seen a very weak dollar through Asian and into London. We may be seeing a test of this 4HR key level we spoke so much about prior to the break. Will we find support at this level or will this bearish momentum be too strong for the buyers sitting at this level?
Bearish-Crab PatternGood morning and good weekend to everyone. We now are climbing steady. We since noon yesterday now can see a trend going up successfully. The market has flipped a switch to follow another Flubberbuster. We now have a Bearish-Crab pattern. We all on February 11 are going to a 1.10 mark. Small dip is able to be possible at 1.05 this evening. We on the 10 at 2:30 will enter a dip down to .9103030 or lower. This morning we all can see dip after 1.05. On February 9 we all can see a dip to .92916 or less. Not moneies advice. The gains forward.

EUR/USD - Price Update Heading into the New Trading WeekWe've seen price rally from our Daily Key level. We consistently predict these turning points in the market.
Will we see a test of our bottom consolidation zone for further downside movement next week?

EUR/USD - USD Strength Prevails as price tags HTF key levelMarket Update. Bears continue to take control of this market. We've tagged our HTF key level and we're seeing a bounce. We still may see USD lose some gains on the week during trading today. Be careful with the NFP data released today.
For our potential break and retest trade setup - we didn't find a retest for our entry. However, one may come next week if USD loses some recent gains. That being said - our directional bias and USD strength has proven to be correct this week.

GBP/JPY - Clear Breaks to the Upside in line with HTF AnalysisOn the daily we are in an ascending channel. Scale down and you'll find key levels on the 4hr. See how these key levels are being broken to the upside? This indicates bullish momentum in the markets and aligns with our longer term outlook on the pair.
The blue levels here are key levels in the market where price has gravitated to and bounced from more often than not.
Any questions drop me a DM!
