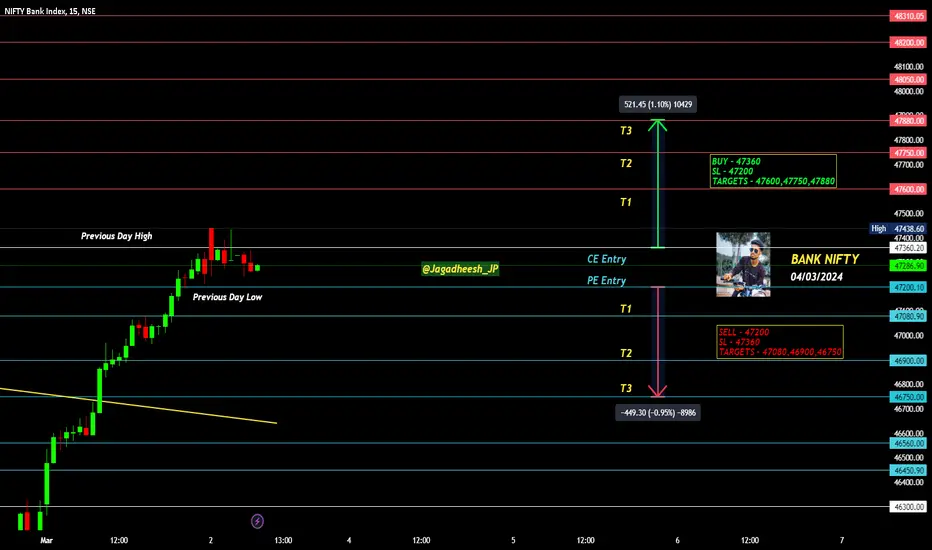
BANK NIFTY INTRADAY LEVELS FOR 04/03/2024BUY ABOVE - 47360
SL - 47200
TARGETS - 47600,47750,47880
SELL BELOW - 47200
SL - 47360
TARGETS - 47080,46900,46750
NO TRADE ZONE - 47200 to 47350
Previous Day High - 47350
Previous Day Low - 46300
Based on price action major support & resistance's are here, the red lines acts as resistances, the green lines acts as supports. If the price breaks the support/resistance, it will move to the next support/resistance line. White lines indicates previous day high & low, high acts as a resistance & low acts as a support for next day.
Trendlines are also significant to price action. If the price is above/below the trendlines, can expect an UP/DOWN with aggressive move.
Please NOTE: this levels are for intraday trading only.
Disclaimer - All information on this page is for educational purposes only,
we are not SEBI Registered, Please consult a SEBI registered financial advisor for your financial matters before investing And taking any decision. We are not responsible for any profit/loss you made.
Request your support and engagement by liking and commenting & follow to provide encouragement
HAPPY TRADING 👍
Levels
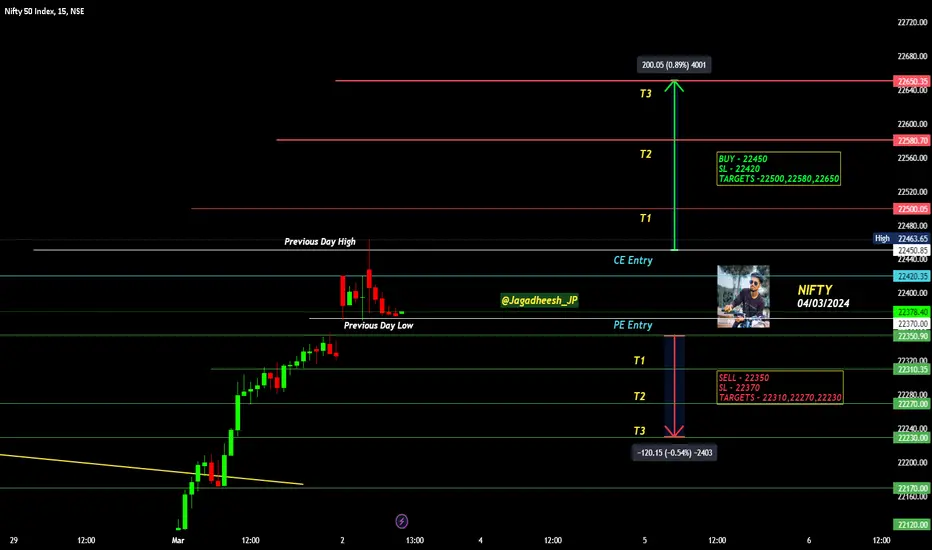
NIFTY INTRADAY LEVELS FOR 04/03/2024BUY ABOVE - 22450
SL - 22420
TARGETS -22500,22580,22650
SELL BELOW - 22350
SL - 22370
TARGETS - 22310,22270,22230
NO TRADE ZONE - 22350 to 22450
Previous Day High - 22450
Previous Day Low - 22370
Based on price action major support & resistance's are here, the red lines acts as resistances, the green lines acts as supports. If the price breaks the support/resistance, it will move to the next support/resistance line. White lines indicates previous day high & low, high acts as a resistance & low acts as a support for next day.
Trendlines are also significant to price action. If the price is above/below the trendlines, can expect an UP/DOWN with aggressive move.
Please NOTE: this levels are for intraday trading only.
Disclaimer - All information on this page is for educational purposes only,
we are not SEBI Registered, Please consult a SEBI registered financial advisor for your financial matters before investing And taking any decision. We are not responsible for any profit/loss you made.
Request your support and engagement by liking and commenting & follow to provide encouragement
HAPPY TRADING 👍
BANK NIFTY INTRADAY LEVELS FOR SATURDAY 02/03/2024BUY ABOVE - 47360
SL - 47200
TARGETS - 47600,47750,47880
SELL BELOW - 47200
SL - 47360
TARGETS - 47080,46900,46750
NO TRADE ZONE - 47200 to 47350
Previous Day High - 47350
Previous Day Low - 46300
Based on price action major support & resistance's are here, the red lines acts as resistances, the green lines acts as supports. If the price breaks the support/resistance, it will move to the next support/resistance line. White lines indicates previous day high & low, high acts as a resistance & low acts as a support for next day.
Trendlines are also significant to price action. If the price is above/below the trendlines, can expect an UP/DOWN with aggressive move.
Please NOTE: this levels are for intraday trading only.
Disclaimer - All information on this page is for educational purposes only,
we are not SEBI Registered, Please consult a SEBI registered financial advisor for your financial matters before investing And taking any decision. We are not responsible for any profit/loss you made.
Request your support and engagement by liking and commenting & follow to provide encouragement
HAPPY TRADING 👍

NIFTY INTRADAY LEVELS FOR SATURDAY TRADING 02/03/2024BUY ABOVE - 22350
SL - 22210
TARGETS -22230,22170,22120
SELL BELOW - 22940
SL - 21990
TARGETS - 21890,21850,21800
NO TRADE ZONE - 22310 to 22350
Previous Day High - 22350
Previous Day Low - 22060
Based on price action major support & resistance's are here, the red lines acts as resistances, the green lines acts as supports. If the price breaks the support/resistance, it will move to the next support/resistance line. White lines indicates previous day high & low, high acts as a resistance & low acts as a support for next day.
Trendlines are also significant to price action. If the price is above/below the trendlines, can expect an UP/DOWN with aggressive move.
Please NOTE: this levels are for intraday trading only.
Disclaimer - All information on this page is for educational purposes only,
we are not SEBI Registered, Please consult a SEBI registered financial advisor for your financial matters before investing And taking any decision. We are not responsible for any profit/loss you made.
Request your support and engagement by liking and commenting & follow to provide encouragement
HAPPY TRADING 👍

BANK NIFTY INTRADAY LEVELS FOR 01/03/2024BUY ABOVE - 46300
SL - 46100
TARGETS - 46450,46560,46750
SELL BELOW - 45930
SL - 46100
TARGETS - 45730,45570,45330
NO TRADE ZONE - 45930 to 46300
Previous Day High - 46300
Previous Day Low - 45730
Based on price action major support & resistance's are here, the red lines acts as resistances, the green lines acts as supports. If the price breaks the support/resistance, it will move to the next support/resistance line. White lines indicates previous day high & low, high acts as a resistance & low acts as a support for next day.
Trendlines are also significant to price action. If the price is above/below the trendlines, can expect an UP/DOWN with aggressive move.
Please NOTE: this levels are for intraday trading only.
Disclaimer - All information on this page is for educational purposes only,
we are not SEBI Registered, Please consult a SEBI registered financial advisor for your financial matters before investing And taking any decision. We are not responsible for any profit/loss you made.
Request your support and engagement by liking and commenting & follow to provide encouragement
HAPPY TRADING 👍

NIFTY INTRADAY LEVELS FOR 01/03/2024BUY ABOVE - 22060
SL - 22020
TARGETS -22120,22170,22230
SELL BELOW - 22940
SL - 21990
TARGETS - 21890,21850,21800
NO TRADE ZONE - 21940 to 22060
Previous Day High - 22060
Previous Day Low - 21850
Based on price action major support & resistance's are here, the red lines acts as resistances, the green lines acts as supports. If the price breaks the support/resistance, it will move to the next support/resistance line. White lines indicates previous day high & low, high acts as a resistance & low acts as a support for next day.
Trendlines are also significant to price action. If the price is above/below the trendlines, can expect an UP/DOWN with aggressive move.
Please NOTE: this levels are for intraday trading only.
Disclaimer - All information on this page is for educational purposes only,
we are not SEBI Registered, Please consult a SEBI registered financial advisor for your financial matters before investing And taking any decision. We are not responsible for any profit/loss you made.
Request your support and engagement by liking and commenting & follow to provide encouragement
HAPPY TRADING 👍

Warning: Bitcoin Has Just Reached a Multi-Year Resistance LevelTraders,
I must warn my followers of the resistance level that Bitcoin is now up against. Bitcoin has been shocking the world with price action these last several months and now would seem to be fairly over-extended. Additionally, Bitcoin has a serious resistance level that it must move through if it wants to move higher.
I am normally not an overly dogmatic type of analyst. This is where I become fairly biased. I do not see Bitcoin breaking this resistance without quite a bit of accumulation preceding momentum.
When we reached resistance at 53k, I called for sideways to down price action with the potential to touch 48k before proceeding upwards. We got our sideways action for over a week but we did not get any break of support. This is when I knew the bulls were going to attempt to continue upwards. You saw me making many altcoin entries at this point and we are still winning on those trades (more to come here).
But now, we have reached new resistance and this resistance is significant. It is not something to take lightly. We started this trendline back in 2019. So, for 5 years it has acted as either support or, in this case, resistance (see below):
I have been anticipating that at some point in the future, we would simultaneously reach our mid-cycle top as well as retract/retest our 48k neckline from that larger Cup and Handle pattern I have discussed for so long. I THINK NOW IS THAT TIME. Be ready.
However, it may take days, weeks, or even months to pull back and touch 48k. I believe now is the time to prepare for doing so. I am so confident that our resistance will hold the bulls off from further upside that I may enter a big short here soon. So, watch for that.
Until then, stay tuned and I will keep you up to date on the battle of our trendline here.
Stewdamus

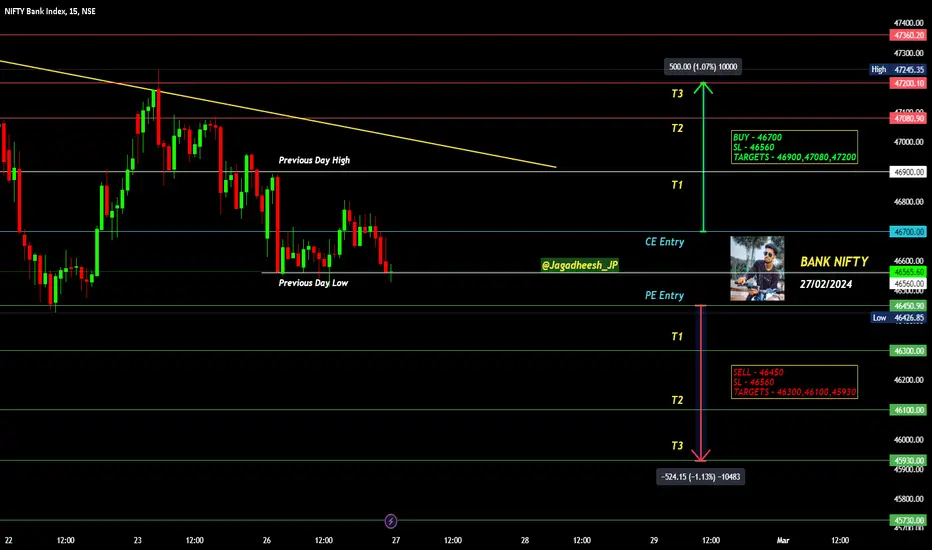
BANK NIFTY INTRADAY LEVELS FOR 28/02/2024BUY ABOVE - 46700
SL - 46560
TARGETS - 46900,47080,47200
SELL BELOW - 46450
SL - 46560
TARGETS - 46300,46450,46300
NO TRADE ZONE - 46560 to 46700
Previous Day High - 46700
Previous Day Low - 46300
Based on price action major support & resistance's are here, the red lines acts as resistances, the green lines acts as supports. If the price breaks the support/resistance, it will move to the next support/resistance line. White lines indicates previous day high & low, high acts as a resistance & low acts as a support for next day.
Trendlines are also significant to price action. If the price is above/below the trendlines, can expect an UP/DOWN with aggressive move.
Please NOTE: this levels are for intraday trading only.
Disclaimer - All information on this page is for educational purposes only,
we are not SEBI Registered, Please consult a SEBI registered financial advisor for your financial matters before investing And taking any decision. We are not responsible for any profit/loss you made.
Request your support and engagement by liking and commenting & follow to provide encouragement
HAPPY TRADING 👍

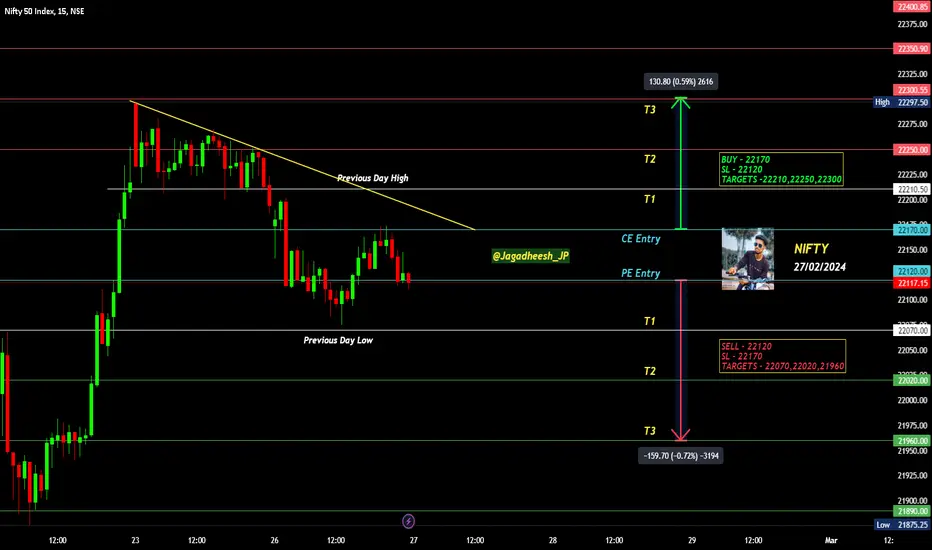
NIFTY INTRADAY LEVELS FOR 27/02/2024BUY ABOVE - 22170
SL - 22120
TARGETS -22210,22250,22300
SELL BELOW - 22120
SL - 22170
TARGETS - 22070,22020,21960
NO TRADE ZONE - 22120 to 22170
Previous Day High - 22210
Previous Day Low - 22070
Based on price action major support & resistance's are here, the red lines acts as resistances, the green lines acts as supports. If the price breaks the support/resistance, it will move to the next support/resistance line. White lines indicates previous day high & low, high acts as a resistance & low acts as a support for next day.
Trendlines are also significant to price action. If the price is above/below the trendlines, can expect an UP/DOWN with aggressive move.
Please NOTE: this levels are for intraday trading only.
Disclaimer - All information on this page is for educational purposes only,
we are not SEBI Registered, Please consult a SEBI registered financial advisor for your financial matters before investing And taking any decision. We are not responsible for any profit/loss you made.
Request your support and engagement by liking and commenting & follow to provide encouragement
HAPPY TRADING 👍
BANK NIFTY INTRADAY LEVELS FOR 27/02/2024BUY ABOVE - 46700
SL - 46560
TARGETS - 46900,47080,47200
SELL BELOW - 46450
SL - 46560
TARGETS - 46300,46100,45930
NO TRADE ZONE - 46450 to 46700
Previous Day High - 46900
Previous Day Low - 46560
Based on price action major support & resistance's are here, the red lines acts as resistances, the green lines acts as supports. If the price breaks the support/resistance, it will move to the next support/resistance line. White lines indicates previous day high & low, high acts as a resistance & low acts as a support for next day.
Trendlines are also significant to price action. If the price is above/below the trendlines, can expect an UP/DOWN with aggressive move.
Please NOTE: this levels are for intraday trading only.
Disclaimer - All information on this page is for educational purposes only,
we are not SEBI Registered, Please consult a SEBI registered financial advisor for your financial matters before investing And taking any decision. We are not responsible for any profit/loss you made.
Request your support and engagement by liking and commenting & follow to provide encouragement
HAPPY TRADING 👍
BANK NIFTY INTRADAY LEVELS FOR 26/02/2024BUY ABOVE - 47080
SL - 46900
TARGETS - 47200,47360,47600
SELL BELOW - 46700
SL - 46900
TARGETS - 46450,46300,46100
NO TRADE ZONE - 46700 to 47080
Previous Day High - 47200
Previous Day Low - 46700
Based on price action major support & resistance's are here, the red lines acts as resistances, the green lines acts as supports. If the price breaks the support/resistance, it will move to the next support/resistance line. White lines indicates previous day high & low, high acts as a resistance & low acts as a support for next day.
Trendlines are also significant to price action. If the price is above/below the trendlines, can expect an UP/DOWN with aggressive move.
Please NOTE: this levels are for intraday trading only.
Disclaimer - All information on this page is for educational purposes only,
we are not SEBI Registered, Please consult a SEBI registered financial advisor for your financial matters before investing And taking any decision. We are not responsible for any profit/loss you made.
Request your support and engagement by liking and commenting & follow to provide encouragement
HAPPY TRADING 👍

S&P 500 INTRADAY SYMMETRICAL TRIANGLE FOR 26/02/2024BUY ABOVE - 5100
SL - 5088
TARGETS - 5110,5120,5135
SELL BELOW - 5081
SL - 5088
TARGETS - 5070,5057,5047
NO TRADE ZONE - 5081 to 5100
Previous Day High - 5110
Previous Day Low - 5081
Based on price action major support & resistance's are here, the red lines acts as resistances, the green lines acts as supports. If the price breaks the support/resistance, it will move to the next support/resistance line. White lines indicates previous day high & low, high acts as a resistance & low acts as a support for next day.
Trendlines are also significant to price action. If the price is above/below the trendlines, can expect an UP/DOWN with aggressive move.
Please NOTE: this levels are for intraday trading only.
Disclaimer - All information on this page is for educational purposes only,
we are not SEBI Registered, Please consult a SEBI registered financial advisor for your financial matters before investing And taking any decision. We are not responsible for any profit/loss you made.
Request your support and engagement by liking and commenting & follow to provide encouragement
HAPPY TRADING 👍

#ES_F Day Trading Prep Week 2.18 - 2.23Shortened week ahead, lets break down structure and areas of interest to lean on this week.
Last Week :
We opened the week above VAH and under Key HTF Edge, we knew that this is the area where we can see size sellers step in and an area where size longs could be taking profits which creates different sets of sellers to give more pressure to the lower levels, as mentioned this could be the Edge that will stop our run at least for time being.
Market consolidated above VAH, pushed into the Edge, tagged 5066.50 to the tick and failed to take it out which gave a nice sell back into VAH. Tuesday before the data we knew we had Supply trapped above and if Key Support gets taken out we can see a move lower and if we followed down level to level we ended up testing the bottom Edge, taking out one of the weak lows but we only had enough to barely take it and found buying again. By end of the week we ended up back in 5013.75 - 5066.50 Range and Friday we balanced inside under the Key Resistance without tagging it and with a few Key Support tests.
This Week :
Market closed on Friday inside Key Support with what looked like end of day break but Globex opened and pushed away from Key Support again keeping us inside 5013.75 - 5066.50 Range for now. We have a shorter week coming and question is will we stay consolidating in this Current Range and try to push out of VAH towards the Edge again or will the market stay inside Value with a possible move through the Mean towards VAL.
If we end up holding under VAH under 5048.75 - 45.75 // 34-31 areas could bring in weakness once enough supply builds up to break Current Key Support and if that happens we could target move to lower levels towards VAL, we have to be careful looking for too much downside unless Key Levels break and market shows continuation because we could stay balancing inside our Value unless stronger volume comes in. First targets under to watch would be 5001.75 - 97.75 and VAL top at 4988.25 - 84.25 which could find buying to hold us over, if not we have Key Support at 4972 - 67 which we would need to take out for any continuation towards bottom Edge.
If we do end up holding this range and can't take out Current Key Support, we can see more balance in Current range again and if enough buying comes in and we can take out upper Resistance areas at 5034-31 we would need to hold over 5041.50 and take out 5048.75 - 45.75 to see another attempt at the upper Edge. We would need to take out and accept over 5066.50 - 60.75 for any more upside from this range and above target would be towards the top of the Edge where we could watch for failure or continuation.
Area over 5066.50 - 60.75 is big Resistance for now and if we finally have selling from size longs and shorts don't need to pay over Value too much then we could continue to hold under so need to be careful with any pushes over 34 - 41.50 area as they may not hold unless we get strong buying through them.
Levels to Watch :
Current Resistance 5034 - 31 // 5048.75 - 45.75
Key Resistance 5066.50 - 60.75
Targets if above 5086.25 - 81 - 77.75
Current Key Support 5019 - 13.75
Targets below 5001.75 - 97.75 // 4988.25 - 84.25 Needs to break for attempt lower
Key Support 4972 - 67 Would need to hold under for any continuation towards lower Edge.

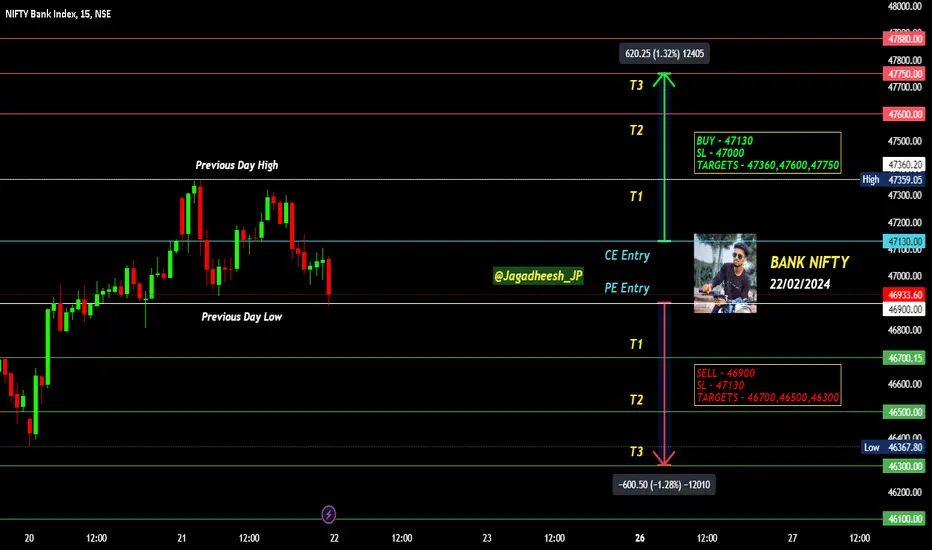
BANK NIFTY INTRADAY LEVELS FOR 22/02/2024BUY ABOVE - 47130
SL - 47000
TARGETS - 47360,47600,47750
SELL BELOW - 46900
SL - 47130
TARGETS - 46700,46500,46300
NO TRADE ZONE - 46900 to 47360
Previous Day High - 47360
Previous Day Low - 46900
Based on price action major support & resistance's are here, the red lines acts as resistances, the green lines acts as supports. If the price breaks the support/resistance, it will move to the next support/resistance line. White lines indicates previous day high & low, high acts as a resistance & low acts as a support for next day.
Trendlines are also significant to price action. If the price is above/below the trendlines, can expect an UP/DOWN with aggressive move.
Please NOTE: this levels are for intraday trading only.
Disclaimer - All information on this page is for educational purposes only,
we are not SEBI Registered, Please consult a SEBI registered financial advisor for your financial matters before investing And taking any decision. We are not responsible for any profit/loss you made.
Request your support and engagement by liking and commenting & follow to provide encouragement
HAPPY TRADING 👍
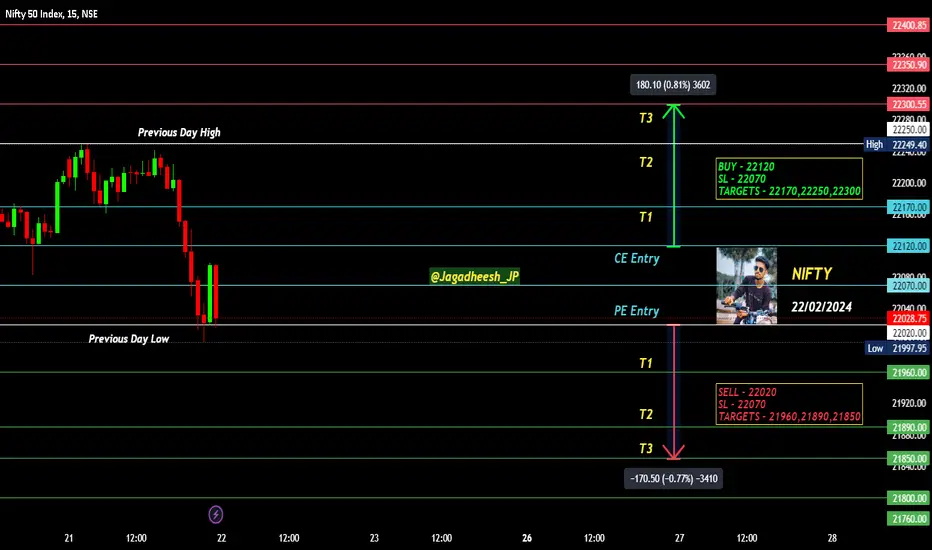
NIFTY INTRADAY LEVELS FOR 22/02/2024BUY ABOVE - 22120
SL - 22070
TARGETS - 22170,22250,22300
SELL BELOW - 22020
SL - 22070
TARGETS - 21960,21890,21850
NO TRADE ZONE - 22020 to 22120
Previous Day High - 22250
Previous Day Low - 22020
Based on price action major support & resistance's are here, the red lines acts as resistances, the green lines acts as supports. If the price breaks the support/resistance, it will move to the next support/resistance line. White lines indicates previous day high & low, high acts as a resistance & low acts as a support for next day.
Trendlines are also significant to price action. If the price is above/below the trendlines, can expect an UP/DOWN with aggressive move.
Please NOTE: this levels are for intraday trading only.
Disclaimer - All information on this page is for educational purposes only,
we are not SEBI Registered, Please consult a SEBI registered financial advisor for your financial matters before investing And taking any decision. We are not responsible for any profit/loss you made.
Request your support and engagement by liking and commenting & follow to provide encouragement
HAPPY TRADING 👍
S&P 500 INTRADAY LEVELS FOR 21/02/2024 BUY ABOVE - 4980
SL - 4968
TARGETS - 4992,5000,5008
SELL BELOW - 4968
SL - 4980
TARGETS - 4958,4948,4940
NO TRADE ZONE - 4968 to 4980
Previous Day High - 4992
Previous Day Low - 4958
Based on price action major support & resistance's are here, the red lines acts as resistances, the green lines acts as supports. If the price breaks the support/resistance, it will move to the next support/resistance line. White lines indicates previous day high & low, high acts as a resistance & low acts as a support for next day.
Trendlines are also significant to price action. If the price is above/below the trendlines, can expect an UP/DOWN with aggressive move.
Please NOTE: this levels are for intraday trading only.
Disclaimer - All information on this page is for educational purposes only,
we are not SEBI Registered, Please consult a SEBI registered financial advisor for your financial matters before investing And taking any decision. We are not responsible for any profit/loss you made.
Request your support and engagement by liking and commenting & follow to provide encouragement
HAPPY TRADING 👍

Euro can rebound from resistance line and fall to 1.0725 levelHello traders, I want share with you my opinion about Euro. Observing the chart, we can see that the price recently entered to downward channel, where it rebounded from the resistance line and in a short time fell to the 1.0835 resistance level, which coincided with the seller zone. After this price some time traded between this level and later rose from the support line to the resistance line of the downward channel and then turned around and declined until to the support level, which coincided with the buyer zone, thereby breaking the 1.0835 level and exiting from the downward channel. Then Euro bounced from the support level and started to rise in an upward channel, where it first rose to the resistance line and then made a downward impulse to the support line, breaking the 1.0725 level, but soon it backed up. After this movement, EUR continued to rise in the channel and a not long time ago price approached to resistance line of the resistance line of the upward channel. So, in my mind, the Euro can rise to this line and even higher to the resistance level and then start to decline to the 1.0725 support level, where I set my target. Please share this idea with your friends and click Boost 🚀

BANK NIFTY INTRADAY LEVELS FOR 15/02/2024BUY ABOVE - 46170
SL - 46010
TARGETS - 46300,46500,46670
SELL BELOW - 45730
SL - 46010
TARGETS - 45570,45330,45150
NO TRADE ZONE - 45730 to 46170
Previous Day High - 45730
Previous Day Low - 44950
Based on price action major support & resistance's are here, the red lines acts as resistances, the green lines acts as supports. If the price breaks the support/resistance, it will move to the next support/resistance line. White lines indicates previous day high & low, high acts as a resistance & low acts as a support for next day.
Trendlines are also significant to price action. If the price is above/below the trendlines, can expect an UP/DOWN with aggressive move.
Please NOTE: this levels are for intraday trading only.
Disclaimer - All information on this page is for educational purposes only,
we are not SEBI Registered, Please consult a SEBI registered financial advisor for your financial matters before investing And taking any decision. We are not responsible for any profit/loss you made.
Request your support and engagement by liking and commenting & follow to provide encouragement
HAPPY TRADING 👍

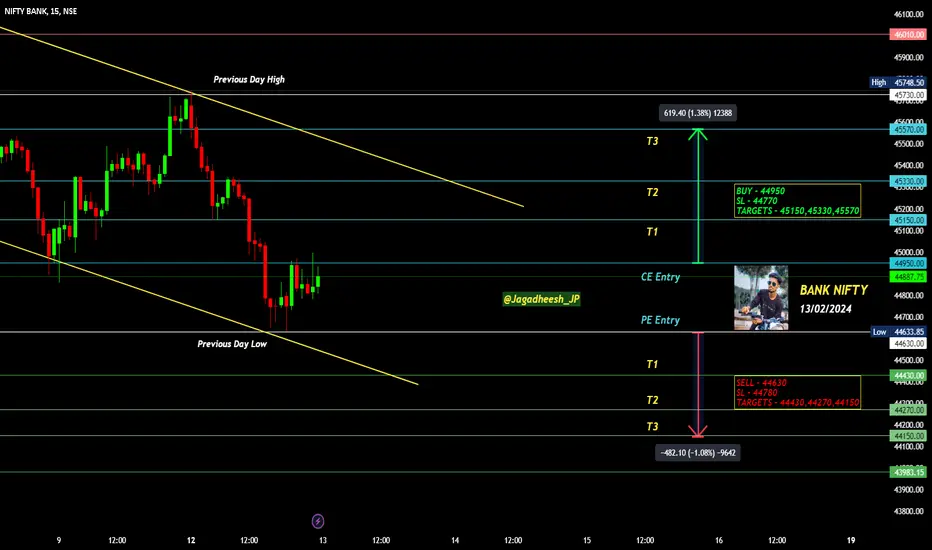
BANK NIFTY INTRADAY LEVELS FOR 13/02/2024BUY ABOVE - 44950
SL - 44770
TARGETS - 45150,45330,45570
SELL BELOW - 44630
SL - 44780
TARGETS - 44430,44270,44150
NO TRADE ZONE - 44630 to 44950
Previous Day High - 45730
Previous Day Low - 44630
Based on price action major support & resistance's are here, the red lines acts as resistances, the green lines acts as supports. If the price breaks the support/resistance, it will move to the next support/resistance line. White lines indicates previous day high & low, high acts as a resistance & low acts as a support for next day.
Trendlines are also significant to price action. If the price is above/below the trendlines, can expect an UP/DOWN with aggressive move.
Please NOTE: this levels are for intraday trading only.
Disclaimer - All information on this page is for educational purposes only,
we are not SEBI Registered, Please consult a SEBI registered financial advisor for your financial matters before investing And taking any decision. We are not responsible for any profit/loss you made.
Request your support and engagement by liking and commenting & follow to provide encouragement
HAPPY TRADING 👍
S&P500 INTRADAY LEVELS FOR 12/02/2024BUY ABOVE - 5030
SL - 5020
TARGETS - 5045,5060+
SELL BELOW - 5015
SL - 5020
TARGETS - 5008,5000,4992
NO TRADE ZONE - 5015 to 5030
Previous Day High - 5030
Previous Day Low - 5000
Based on price action major support & resistance's are here, the red lines acts as resistances, the green lines acts as supports. If the price breaks the support/resistance, it will move to the next support/resistance line. White lines indicates previous day high & low, high acts as a resistance & low acts as a support for next day.
Trendlines are also significant to price action. If the price is above/below the trendlines, can expect an UP/DOWN with aggressive move.
Please NOTE: this levels are for intraday trading only.
Disclaimer - All information on this page is for educational purposes only,
we are not SEBI Registered, Please consult a SEBI registered financial advisor for your financial matters before investing And taking any decision. We are not responsible for any profit/loss you made.
Request your support and engagement by liking and commenting & follow to provide encouragement
HAPPY TRADING 👍

BANK NIFTY INTRADAY LEVELS FOR 12/02/2024BUY ABOVE - 45730
SL - 45570
TARGETS - 46010,46200,46300
SELL BELOW - 45330
SL - 45570
TARGETS - 45110,44900,44610
NO TRADE ZONE - 45330 to 45730
Previous Day High - 45730
Previous Day Low - 44900
Based on price action major support & resistance's are here, the red lines acts as resistances, the green lines acts as supports. If the price breaks the support/resistance, it will move to the next support/resistance line. White lines indicates previous day high & low, high acts as a resistance & low acts as a support for next day.
Trendlines are also significant to price action. If the price is above/below the trendlines, can expect an UP/DOWN with aggressive move.
Please NOTE: this levels are for intraday trading only.
Disclaimer - All information on this page is for educational purposes only,
we are not SEBI Registered, Please consult a SEBI registered financial advisor for your financial matters before investing And taking any decision. We are not responsible for any profit/loss you made.
Request your support and engagement by liking and commenting & follow to provide encouragement
HAPPY TRADING 👍

NIFTY INTRADAY LEVELS FOR 12/02/2024BUY ABOVE - 21810
SL - 21770
TARGETS - 21860,21910,21970
SELL BELOW - 21730
SL - 21770
TARGETS - 21670,21580,21530
NO TRADE ZONE - 21730 to 21810
Previous Day High - 21810
Previous Day Low - 21670
Based on price action major support & resistance's are here, the red lines acts as resistances, the green lines acts as supports. If the price breaks the support/resistance, it will move to the next support/resistance line. White lines indicates previous day high & low, high acts as a resistance & low acts as a support for next day.
Trendlines are also significant to price action. If the price is above/below the trendlines, can expect an UP/DOWN with aggressive move.
Please NOTE: this levels are for intraday trading only.
Disclaimer - All information on this page is for educational purposes only,
we are not SEBI Registered, Please consult a SEBI registered financial advisor for your financial matters before investing And taking any decision. We are not responsible for any profit/loss you made.
Request your support and engagement by liking and commenting & follow to provide encouragement
HAPPY TRADING 👍

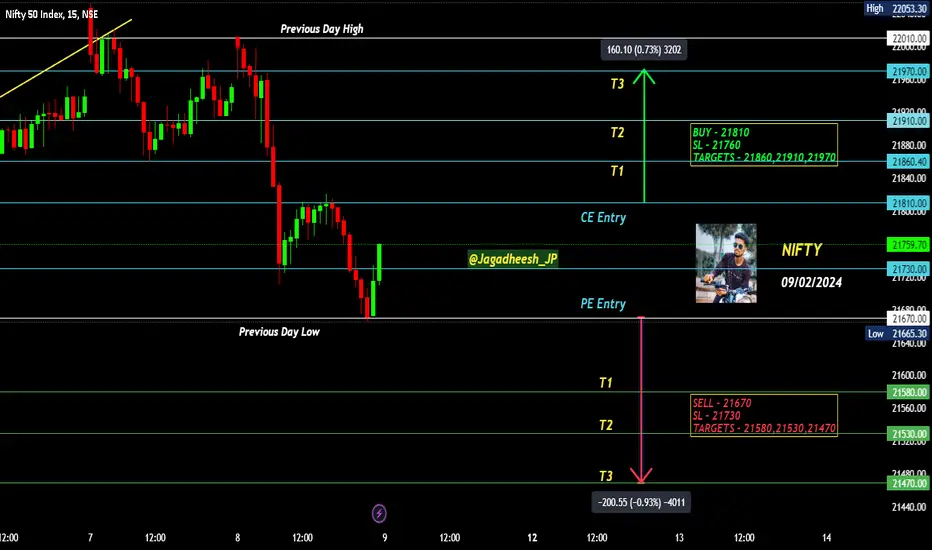
NIFTY INTRADAY LEVELS FOR 09/02/2024BUY ABOVE - 21810
SL - 21760
TARGETS - 21860,21910,21970
SELL BELOW - 21670
SL - 21730
TARGETS - 21580,21530,21470
NO TRADE ZONE - 21670 to 21810
Previous Day High - 22010
Previous Day Low - 21670
Based on price action major support & resistance's are here, the red lines acts as resistances, the green lines acts as supports. If the price breaks the support/resistance, it will move to the next support/resistance line. White lines indicates previous day high & low, high acts as a resistance & low acts as a support for next day.
Trendlines are also significant to price action. If the price is above/below the trendlines, can expect an UP/DOWN with aggressive move.
Please NOTE: this levels are for intraday trading only.
Disclaimer - All information on this page is for educational purposes only,
we are not SEBI Registered, Please consult a SEBI registered financial advisor for your financial matters before investing And taking any decision. We are not responsible for any profit/loss you made.
Request your support and engagement by liking and commenting & follow to provide encouragement
HAPPY TRADING 👍