CIPLA Stock is facing resistance in daily time frame#CIPLA
Stock is facing resistance in daily time frame .Can expect good upmove once it breaks and sustains above the resistance.Keep on Radar.
Disclaimer:-All views are my personal and only for educational purpose.
#StockMarketIndia
#LetsLearnTogether
Levels

TATAMOTORS, Positional Trade Duration: 2-3 months
#TATAMOTORS,
Positional Trade Duration: 2-3 months
Entry: 760-780
Targets: 946, 1042, 1165
Buy on Dips till 720
Reversal from support with strong volume.
Institutions expecting a strong earning in Feb and Dec sales have been good.
No buy or sell recommendation.

Bharati Airtel Ltd view for Intraday 5nd jan #BHARTIARTL
Bharati Airtel Ltd view for Intraday 5nd jan #BHARTIARTL
Resistance 1600 Watching above 1603 for upside movement...
Support area 1570 Below 1580 ignoring upside momentum for intraday
Support 1570 Watching below 1568 or downside movement...
Resistance area 1600
Above 1580-1585 ignoring downside move for intraday
Charts for Educational purposes only.
Please follow strict stop loss and risk reward if you follow the level.
Thanks,

AXISBANK LevelsSupport Level: This is a price level where a stock tends to find buying interest, causing it to reverse direction or consolidate. It's the "floor" of the stock's price.
Resistance Level: This is a price level where selling interest tends to emerge, preventing the price from rising further. It's the "ceiling" of the stock's price.
Methods to Identify Support and Resistance:
Historical Price Action: Look at the past price chart of Axis Bank and identify areas where the stock has previously reversed or consolidated. These can act as potential support or resistance levels.
Round Numbers: Traders often watch psychological price levels like ₹1000, ₹1200, ₹1500, etc., as they tend to act as support or resistance.
Trendlines: Draw trendlines that connect lows (for support) or highs (for resistance). These can act as dynamic support or resistance levels.
Moving Averages: Simple Moving Averages (SMA) or Exponential Moving Averages (EMA) like the 50-day and 200-day moving averages can serve as support or resistance levels, especially when the stock is trending.
Fibonacci Retracement Levels: Fibonacci levels can help identify possible areas of support and resistance based on key percentages like 23.6%, 38.2%, 50%, 61.8%, and 78.6%.
Volume Analysis: High-volume areas near certain price points can signify strong support or resistance.
If the stock is currently trading at ₹980 and starts trending towards ₹950 without breaking below, then ₹950 becomes a strong support level. Similarly, if the stock faces selling pressure at ₹1050, it could be a resistance level.

BITCOIN 1 HR POSSIBLE SCENARIOS 🚨 BITCOIN 1-Hour Analysis 🚨
Here’s what we’re watching:
📈 Upside Targets:
• TP1:94650
• TP2: 95150
📉 Downside Targets:
• TP1: 93380
• TP2: 92400
So we have to watch out for $93900- $9400 level. If BTC stays below then you can target downside targets and if above then you can target above levels mentioned as TP(take profit)
Keep an eye on key levels and trade smart! 💹
What’s your take? Drop a comment below and share this with your trading crew! 🚀

NQ Weekly and Longer term Bias (We were fire last week, check)hey guys just my weekly chart and levels going into the week. everyone expecting a santa rally, not so positive... i could see it mooning from here, don't get me wrong. im much more bullish this week than last now that we got some sort of correction (check last weeks analysis for real, read the chart and play the thing for the week, we cooked, hope you all did too, all 3).
anyway a lot on there, i think it's downward, people buying the wrong dip in my opinion, much more liquidation to come.
good luck

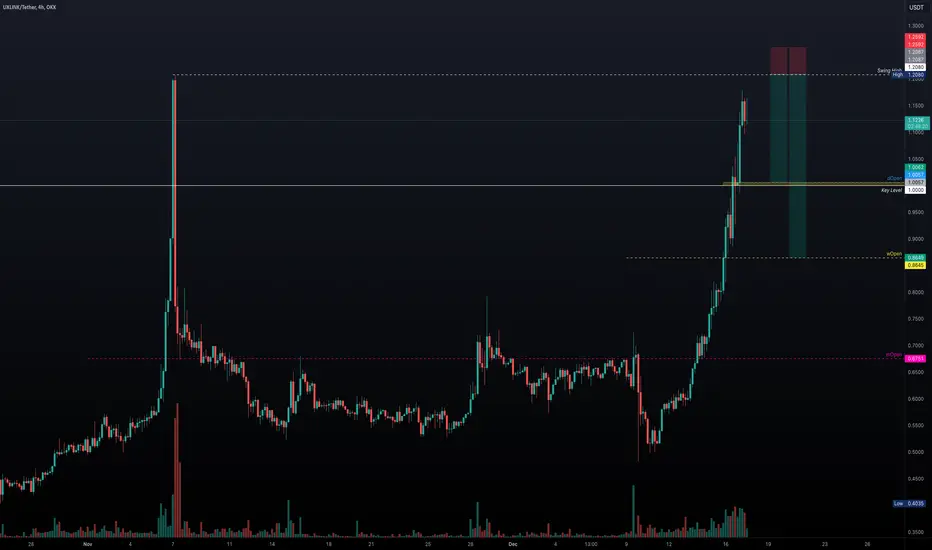
UXLINK - Is a Reversal Imminent? SHORT SETUPUXLINK has seen impressive gains over the past 7 days, rising +140% and approaching the swing high at $1.208. This price action suggests the possibility of a correction, providing an attractive short opportunity if it faces rejection at these levels.
Key Observations:
Recent Bullish Momentum: UXLINK has been on a 7-day bullish run, rising significantly, which increases the likelihood of a short-term pullback or correction.
Swing High at $1.208: As UXLINK nears the swing high at $1.208, this could act as a potential rejection point. A rejection here could provide an excellent shorting opportunity.
Riskier Trade: If you prefer a more aggressive position, a short could be taken now, targeting the swing high with a laddered approach towards that level.
Possible Correction Ahead: With 7 consecutive bullish days, a correction is likely in the near future. The dOpen at $1 serves as a strong support level to target for a short.
Break Below $1: If UXLINK breaks below the $1 level, the next target becomes the wOpen at $0.8645.
Reward-to-Risk Potential:
Target 1: $1 (dOpen) offers a 4:1 risk-to-reward, with a potential 16.45% gain.
Target 2: $0.8645 (wOpen) offers a 7:1 risk-to-reward, with a possible +28.5% gain.
Elliot Wave Count: According to Elliot wave theory, UXLINK is approaching the completion of its 5-wave structure, which may further indicate that the upward trend is nearing exhaustion.
Summary:
Bullish run over the past 7 days makes UXLINK susceptible to a correction.
Swing high at $1.208 could provide an ideal short opportunity, with strong targets at $1 and $0.8645.
Reward-to-risk ratios are favorable, offering 4:1 or even 7:1 if the trade is executed properly.
Elliot Wave suggests the end of the current upward movement, further supporting the case for a potential short.
Virtuals Protocol: +16,850% Surge Nearing Its End?Virtuals Protocol has experienced an astronomical +16,850% surge in price over the past 164 days, marking a parabolic advance that appears to be nearing exhaustion. Price action suggests that the final 5th wave of this bullish cycle may be completing, raising the question: Is Virtuals Protocol set for a correction, or is there still upside potential?
Key Observations:
1.) End of the 5th Wave:
The Elliott Wave count indicates that the asset is likely completing the final 5th wave of a large bullish cycle.
Parabolic moves of this magnitude typically end with a sharp correction as profit-taking accelerates.
2.) Weekly RSI Overbought:
The RSI on the weekly timeframe is at 95, signaling extreme overbought conditions.
Such elevated RSI levels are unsustainable and often precede corrections to reset market momentum.
3.) 6 Consecutive Bullish Weekly Candles:
A string of 6 green weekly candles suggests strong bullish momentum but also hints at exhaustion as buyers may struggle to sustain such momentum.
4.) Fibonacci Target and Weekly Open Confluence:
Using a Fibonacci retracement from the current wave, the 0.618 level aligns perfectly with the Weekly Open (wOpen) at $2.711.
This confluence zone serves as a strong short-term take-profit target for short sellers or a potential re-entry point for bulls looking for a correction.
Outlook:
Bearish Scenario: The completion of the 5th wave and the extreme overbought RSI suggest a correction is imminent. A retrace towards the 0.618 Fib level ($2.711) is a highly probable scenario.
Bullish Continuation: For further upside, the price must consolidate and find fresh buying volume to support continuation beyond the current highs.
Conclusion:
Virtuals Protocol is flashing clear signs of exhaustion, with extreme weekly RSI levels and a completed Elliott Wave cycle. Traders should watch the $2.711 zone closely as a potential correction target, with the 0.618 Fibonacci retracement and Weekly Open providing strong confluence.

NQ1 Weekly Bias Dec. 15-20 with Levels of InterestYeah yeah yeah, I'm bearish I get it I am a horrible idiotic terrible person. Anyway here is a starter chart for shorter term levels on the way down if that indeed is the way we go for a retracement. I think end of the year cycling out of winners is inevitable especially in the over-valued nasdaq big boys. Also looking at last week, we rejected the upper 800s, which is not a good sign. Almost looked like "they" pushed it off Friday open to see if there was any retail left. Turning from cautious to bearish based on all macro evidence and other indicators. Not full blown panic mode yet, we could possibly put on another month or three of gains, but we are much much closer to the end than anyone is talking about.
Also food for thought, when it's in the news it's in the price. There's tons of euphoria in the markets at the moment, with everyone pointing and chattering about the "Santa Rally" wherever I turn. Always be cautious when everyone is talking and feeling the same way, just my advice. Risk reward and risk management is all of trading. Reward for buying another 10% against a risk of losing 40% doesn't seem like something I really want to jump head first into at record setting levels of overvaluations metrics everywhere.
Good Luck this week Bosses, any question as always feel free to reach out or ask in the comments.

NQ Week of Dec8 Levels and Areas of Interest Part 1 (4h Chart)Shorter time frame chart with more specific near term levels, mostly bearish. Any bullish numbers refer to the Daily chart in part 1 and look for those upper level trendlines. Not much else to say on this one, any questions feel free to ask.

NQ Week of Dec8 Levels and Areas of Interest Part 1 (1d Chart)Daily Chart for NQ this week. Hard to be a bear, but looking hard to be a bull as well. When everyone expects it to trade like a 2016 Trump victory, that's normally when it doesn't. Just saying. Not bearish but cautious for sure. "They" have been sizing out since the end of July / Start of August (check the overnight gains versus us opens) and leaving retail with the bag. FOMO seems to be kicking in everywhere. That's a minor synapses without going far into the macro details, and the sizes being thrown around on dark pools. Anyway, part 2 will have shorter term areas (mostly for bear setups, bounces, dips etc).
Anything higher I have to rely on the trendlines since we are essentially in price discovery mode if we keep pushing. Looking for resistance on the top trendlines, and imagine the bottom short term trend line will be easily broken if we have any corrections. Good luck this week, feel free to ask any questions if anyone reads this :)

Turning Up, the BB mid/50 average band has been brokenTurning Up, the AVWAP mid/50 average band has been broken, we expect next resistances are 2598-2608-2617-2631-2636-2643.
We had 4 tests already as i stated yesterday a 'Minds' which already broken in 5th test at up-side.

Review and plan for 4th November 2024Nifty future and banknifty future analysis and intraday plan in kannada.
Swing idea included.
This video is for information/education purpose only. you are 100% responsible for any actions you take by reading/viewing this post.
please consult your financial advisor before taking any action.
----Vinaykumar hiremath, CMT

XRP Price Analysis: Potential 20% Drop Amid Key Support LevelsXRP is currently trading within a box pattern, with a lower high suggesting a higher probability of a downside breakout. If the crucial support level of $0.5213 is lost, there is a 20% potential drop in price, targeting $0.4164. If you are holding XRP, you might consider selling, or alternatively, you could take a short position upon a clear break of the $0.5213 level. Given the importance of this support, a sharp decline is expected if it breaks. Keep an eye on this critical zone for any significant moves.

Title: Key Support Levels for Short and Long Positions: CriticalIt seems we have experienced enough upward momentum, and now, with the support level at 66,842, a short position can be considered. However, since this position goes against the main trend, it’s crucial to set a tight stop-loss to manage risk and ensure an early exit with a favorable risk-reward ratio. The next support level for this strategy could be 65,359.8.
On the other hand, if you're planning to open a long position, you might consider entering at 67,898.7, but be cautious with the stop-loss placement. A wider stop-loss would be advisable, possibly below 66,687.4, to allow room for market fluctuations.

BANK NIFTY INTRADAY LEVELS FOR 10/10/2024BUY ABOVE - 51340
SL - 51160
TARGETS - 51600,51820,51990
SELL BELOW - 50920
SL - 51160
TARGETS - 50600,50300,49930
NO TRADE ZONE - 50920 to 51340
Previous Day High - 51600
Previous Day Low - 50920
Based on price action major support & resistance's are here, the red lines acts as resistances, the green lines acts as supports. If the price breaks the support/resistance, it will move to the next support/resistance line. White lines indicates previous day high & low, high acts as a resistance & low acts as a support for next day.
Trendlines are also significant to price action. If the price is above/below the trendlines, can expect an UP/DOWN with aggressive move.
Please NOTE: this levels are for intraday trading only.
Disclaimer - All information on this page is for educational purposes only,
we are not SEBI Registered, Please consult a SEBI registered financial advisor for your financial matters before investing And taking any decision. We are not responsible for any profit/loss you made.
Request your support and engagement by liking and commenting & follow to provide encouragement
HAPPY TRADING 👍

NIFTY INTRADAY LEVELS FOR 10/10/2024BUY ABOVE - 25060
SL - 24970
TARGETS - 25120,25180,25230
SELL BELOW - 24970
SL - 25060
TARGETS - 24890,24800,24700
NO TRADE ZONE - 24970 to 25060
Previous Day High - 25280
Previous Day Low - 24970
Based on price action major support & resistance's are here, the red lines acts as resistances, the green lines acts as supports. If the price breaks the support/resistance, it will move to the next support/resistance line. White lines indicates previous day high & low, high acts as a resistance & low acts as a support for next day.
Trendlines are also significant to price action. If the price is above/below the trendlines, can expect an UP/DOWN with aggressive move.
Please NOTE: this levels are for intraday trading only.
Disclaimer - All information on this page is for educational purposes only,
we are not SEBI Registered, Please consult a SEBI registered financial advisor for your financial matters before investing And taking any decision. We are not responsible for any profit/loss you made.
Request your support and engagement by liking and commenting & follow to provide encouragement
HAPPY TRADING 👍

NIFTY INTRADAY LEVELS FOR 09/10/2024BUY ABOVE - 25060
SL - 24980
TARGETS - 25120,25180,25230
SELL BELOW - 24890
SL - 24980
TARGETS - 24800,24700,24600
NO TRADE ZONE - 24890 to 25060
Previous Day High - 25060
Previous Day Low - 24800
Based on price action major support & resistance's are here, the red lines acts as resistances, the green lines acts as supports. If the price breaks the support/resistance, it will move to the next support/resistance line. White lines indicates previous day high & low, high acts as a resistance & low acts as a support for next day.
Trendlines are also significant to price action. If the price is above/below the trendlines, can expect an UP/DOWN with aggressive move.
Please NOTE: this levels are for intraday trading only.
Disclaimer - All information on this page is for educational purposes only,
we are not SEBI Registered, Please consult a SEBI registered financial advisor for your financial matters before investing And taking any decision. We are not responsible for any profit/loss you made.
Request your support and engagement by liking and commenting & follow to provide encouragement
HAPPY TRADING 👍

BANK NIFTY INTRADAY LEVELS FOR 09/10/2024BUY ABOVE - 51340
SL - 50920
TARGETS - 51650,51820,51990
SELL BELOW - 50920
SL - 51160
TARGETS - 50600,50300,49930
NO TRADE ZONE - 50920 to 51340
Previous Day High - 51340
Previous Day Low - 50300
Based on price action major support & resistance's are here, the red lines acts as resistances, the green lines acts as supports. If the price breaks the support/resistance, it will move to the next support/resistance line. White lines indicates previous day high & low, high acts as a resistance & low acts as a support for next day.
Trendlines are also significant to price action. If the price is above/below the trendlines, can expect an UP/DOWN with aggressive move.
Please NOTE: this levels are for intraday trading only.
Disclaimer - All information on this page is for educational purposes only,
we are not SEBI Registered, Please consult a SEBI registered financial advisor for your financial matters before investing And taking any decision. We are not responsible for any profit/loss you made.
Request your support and engagement by liking and commenting & follow to provide encouragement
HAPPY TRADING 👍

BANK NIFTY INTRADAY LEVELS FOR 08/10/2024BUY ABOVE - 51000
SL - 50600
TARGETS - 51340,51650,51820
SELL BELOW - 50300
SL - 50600
TARGETS - 49930,49700,49530
NO TRADE ZONE - 50300 to 51000
Previous Day High - 51820
Previous Day Low - 50300
Based on price action major support & resistance's are here, the red lines acts as resistances, the green lines acts as supports. If the price breaks the support/resistance, it will move to the next support/resistance line. White lines indicates previous day high & low, high acts as a resistance & low acts as a support for next day.
Trendlines are also significant to price action. If the price is above/below the trendlines, can expect an UP/DOWN with aggressive move.
Please NOTE: this levels are for intraday trading only.
Disclaimer - All information on this page is for educational purposes only,
we are not SEBI Registered, Please consult a SEBI registered financial advisor for your financial matters before investing And taking any decision. We are not responsible for any profit/loss you made.
Request your support and engagement by liking and commenting & follow to provide encouragement
HAPPY TRADING 👍

NIFTY INTRADAY LEVELS FOR 08/10/2024BUY ABOVE - 24890
SL - 24800
TARGETS - 24990,25060,25120
SELL BELOW - 24700
SL - 24800
TARGETS - 24600,24530,24460
NO TRADE ZONE - 24700 to 24890
Previous Day High - 25120
Previous Day Low - 24700
Based on price action major support & resistance's are here, the red lines acts as resistances, the green lines acts as supports. If the price breaks the support/resistance, it will move to the next support/resistance line. White lines indicates previous day high & low, high acts as a resistance & low acts as a support for next day.
Trendlines are also significant to price action. If the price is above/below the trendlines, can expect an UP/DOWN with aggressive move.
Please NOTE: this levels are for intraday trading only.
Disclaimer - All information on this page is for educational purposes only,
we are not SEBI Registered, Please consult a SEBI registered financial advisor for your financial matters before investing And taking any decision. We are not responsible for any profit/loss you made.
Request your support and engagement by liking and commenting & follow to provide encouragement
HAPPY TRADING 👍

BANK NIFTY INTRADAY LEVELS FOR 07/10/2024BUY ABOVE - 51990
SL - 51820
TARGETS - 52120,52260,52400
SELL BELOW - 51670
SL - 51820
TARGETS - 51530,51400,51230
NO TRADE ZONE - 51400 to 51670
Previous Day High - 52600
Previous Day Low - 51400
Based on price action major support & resistance's are here, the red lines acts as resistances, the green lines acts as supports. If the price breaks the support/resistance, it will move to the next support/resistance line. White lines indicates previous day high & low, high acts as a resistance & low acts as a support for next day.
Trendlines are also significant to price action. If the price is above/below the trendlines, can expect an UP/DOWN with aggressive move.
Please NOTE: this levels are for intraday trading only.
Disclaimer - All information on this page is for educational purposes only,
we are not SEBI Registered, Please consult a SEBI registered financial advisor for your financial matters before investing And taking any decision. We are not responsible for any profit/loss you made.
Request your support and engagement by liking and commenting & follow to provide encouragement
HAPPY TRADING 👍

NIFTY INTRADAY ANALYSIS FOR 07/10/2024BUY ABOVE - 25080
SL - 25020
TARGETS - 25130,25180,25230
SELL BELOW - 24950
SL - 25020
TARGETS - 24900,24850,24800
NO TRADE ZONE - 25950 to 25080
Previous Day High - 25490
Previous Day Low - 24950
Based on price action major support & resistance's are here, the red lines acts as resistances, the green lines acts as supports. If the price breaks the support/resistance, it will move to the next support/resistance line. White lines indicates previous day high & low, high acts as a resistance & low acts as a support for next day.
Trendlines are also significant to price action. If the price is above/below the trendlines, can expect an UP/DOWN with aggressive move.
Please NOTE: this levels are for intraday trading only.
Disclaimer - All information on this page is for educational purposes only,
we are not SEBI Registered, Please consult a SEBI registered financial advisor for your financial matters before investing And taking any decision. We are not responsible for any profit/loss you made.
Request your support and engagement by liking and commenting & follow to provide encouragement
HAPPY TRADING 👍
