BANK NIFTY TRADING SETUP FOR 11/07/2023BUY ABOVE - 44940
SL - 44850
TARGETS - 45100,45240,45370
SELL BELOW - 44850
SL - 44940
TARGETS - 44720,44600,44500
Disclaimer - All information on this page is for educational purposes only,
we are not SEBI Registered, Please consult a SEBI registered financial advisor for your financial matters before investing And taking any decision. We are not responsible for any profit/loss you made.
HAPPY TRADING GUYS
Levels

NIFTY TRADING SETUP FOR 10/07/2023BUY ABOVE - 19400
SL - 19360
TARGETS - 19470,19510,19560
SELL BELOW - 19340
SL - 19370
TARGETS - 19250,19160,19110
Disclaimer - All information on this page is for educational purposes only,
we are not SEBI Registered, Please consult a SEBI registered financial advisor for your financial matters before investing And taking any decision. We are not responsible for any profit/loss you made.
HAPPY TRADING GUYS

BANK NIFTY TRADING SETUP FOR 10/07/2023BUY ABOVE - 44940
SL - 44850
TARGETS - 45100,45240,45370
SELL BELOW - 44850
SL - 44940
TARGETS - 44700,44600,44500
Disclaimer - All information on this page is for educational purposes only,
we are not SEBI Registered, Please consult a SEBI registered financial advisor for your financial matters before investing And taking any decision. We are not responsible for any profit/loss you made.
HAPPY TRADING GUYS

BANK NIFTY TODAY'S MOMENT - 07/07/2023Hii Guys
How was todays market analysis
what about your day ?
& What about your trades ?
Are you guys satisfied with my levels
Give your precious words in the comment box

NIFTY TODAY'S MARKET MOMENT - 07/07/2023Hii Guys
How was todays market analysis
what about your day ?
& What about your trades ?
Are you guys satisfied with my levels
Give your precious words in the comment box

NIFTY ANALYSIS - 07/07/2023BUY ABOVE - 19510
SL - 19470
TARGETS - 19560,19630,19700
SELL BELOW - 19470
SL - 19510
TARGETS - 19430,19400,19340
Disclaimer - All information on this page is for educational purposes only,
we are not SEBI Registered, Please consult a SEBI registered financial advisor for your financial matters before investing And taking any decision. We are not responsible for any profit/loss you made.
HAPPY TRADING GUYS

BANK NIFTY (SAUCER PATTERN) Trade Setup For 07 JUL 2023BUY ABOVE - 45390
SL - 45300
TARGETS - 45500,45650,45850
SELL BELOW - 45270
SL - 45340
TARGETS - 45100,45000,44900
Today (06/07/2023) Buy triggered above 45270 and it gave small gain of 140+ points just like yesterday (05/07/2023).
It has formed a saucer pattern in 15 min time frame which is a bullish sign.
Above 45390 we can expect good upside momentum. incase 45270 is broken then this will be invalid and there will be bearish action.
Coming to Friday's trade setup, if index opens flat and a 15 min candle closes above 45390 then we will go with upside trade for the targets of 45500,45650 & 45850.
For selling we need a 15 candle close below 45270. targets 45100,45000 & 44900
In case of big gap up/down, wait till 10 O'clock and mark the high and low of the trading range. Trade on this range breakout.
Disclaimer - All information on this page is for educational purposes only,
we are not SEBI Registered, Please consult a SEBI registered financial advisor for your financial matters before investing And taking any decision. We are not responsible for any profit/loss you made.
HAPPY TRADING GUYS

BANK NIFTY ANALYSIS - 28/06/2023BUY ABOVE - 44100
SL - 43940
TARGETS - 44260,44480,44600
SELL BELOW - 43940
SL - 44100
TARGETS - 43810,43700,43530
Trade Safe & Happy Trading Guys
This is only for educational purpose so TAKE YOUR OWN RISK REWARD

NIFTY ANALYSIS - 06/07/2023BUY ABOVE - 19400
SL - 19340
TARGETS - 19470,19540,19600
SELL BELOW - 19340
SL - 19400
TARGETS - 19250,19200,19160
Disclaimer - All information on this page is for educational purposes only,
we are not SEBI Registered, Please consult a SEBI registered financial advisor for your financial matters before investing And taking any decision. We are not responsible for any profit/loss you made.
HAPPY TRADING GUYS

BANK NIFTY ANALYSIS - 06/07/2023BUY ABOVE - 45270
SL - 45190
TARGETS - 45390,45500,45650
SELL BELOW - 45100
SL - 45190
TARGETS - 45000,44900,44790
Disclaimer - All information on this page is for educational purposes only,
we are not SEBI Registered, Please consult a SEBI registered financial advisor for your financial matters before investing And taking any decision. We are not responsible for any profit/loss you made.
HAPPY TRADING GUYS

BANK NIFTY ANALYSIS - 05/07/2023BUY ABOVE - 45350
SL - 45220
TARGETS - 45500,45650,45850
SELL BELOW - 45250
SL - 45350
TARGETS - 45100,45000,44900
Disclaimer - All information on this page is for educational purposes only,
we are not SEBI Registered, Please consult a SEBI registered financial advisor for your financial matters before investing And taking any decision. We are not responsible for any profit/loss you made.
HAPPY TRADING GUYS

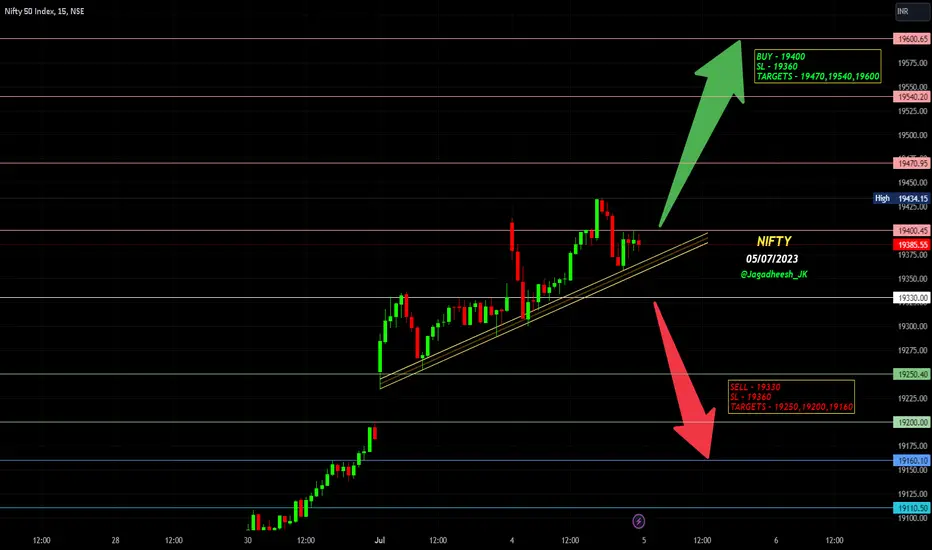
NIFTY ANALYSIS - 05/07/2023BUY ABOVE - 19400
SL - 19360
TARGETS - 19470,19540,19600
SELL BELOW - 19330
SL - 19360
TARGETS - 19250,19200,19160
Disclaimer - All information on this page is for educational purposes only,
we are not SEBI Registered, Please consult a SEBI registered financial advisor for your financial matters before investing And taking any decision. We are not responsible for any profit/loss you made.
HAPPY TRADING GUYS
NIFTY ASCENDING TRIANGLE - 04/07/2023NIFTY50 Formed ASCENDING TRIANGLE PATTERN
BUY ABOVE - 19330
SL - 19290
TARGETS - 19400,19470,19540
SELL BELOW - 19290
SL - 19330
TARGETS - 19250,19200,19160
Disclaimer - All information on this page is for educational purposes only,
we are not SEBI Registered, Please consult a SEBI registered financial advisor for your financial matters before investing And taking any decision. We are not responsible for any profit/loss you made.
HAPPY TRADING GUYS

BANK NIFTY SYMMETRICAL TRIANGLE - 04/07/2023BANK NIFTY Formed SYMMETRICAL TRIANGLE PATTERN
BUY ABOVE - 45250
SL - 45140
TARGETS - 45350,45500,45640
SELL BELOW - 45100
SL - 45220
TARGETS - 44900,44790,44700
Disclaimer - All information on this page is for educational purposes only,
we are not SEBI Registered, Please consult a SEBI registered financial advisor for your financial matters before investing And taking any decision. We are not responsible for any profit/loss you made.
HAPPY TRADING GUYS

NIFTY ANALYSIS - 03/07/2023BUY ABOVE - 19200
SL - 19160
TARGETS - 19260,19330,19400
SELL BELOW - 19160
SL - 19200
TARGETS - 19110,19060,19010
Disclaimer - All information on this page is for educational purposes only,
we are not SEBI Registered, Please consult a SEBI registered financial advisor for your financial matters before investing And taking any decision. We are not responsible for any profit/loss you made.
HAPPY TRADING GUYS

BANK NIFTY ANALYSIS - 03/07/2023UPTREND BREAKDOWN HAPPEND
BUY ABOVE - 44790
SL - 44700
TARGETS - 45000,45120,45230
SELL BELOW - 44700
SL - 44790
TARGETS - 44600,44500,44310
Disclaimer - All information on this page is for educational purposes only,
we are not SEBI Registered, Please consult a SEBI registered financial advisor for your financial matters before investing And taking any decision. We are not responsible for any profit/loss you made.
HAPPY TRADING GUYS

ALL TARGETS DONE (NIFTY50) - 30/06/2023HELLO TRADERS
How was todays market
Are you happy with my nifty targets
How many Traders received this profits today
please Comment below in the Comment Box
I need all your Responses, Then only i will give more accurate Strategies daily with your support

NIFTY ANALYSIS - 30/06/2023BUY ABOVE - 19010
SL - 18950
TARGETS - 19060,19120,19200
SELL BELOW - 18950
SL - 19010
TARGETS - 18860,18830,18800
Trade Safe & Happy Trading Guys
This is only for educational purpose so TAKE YOUR OWN RISK REWARD

BANK NIFTY ANALYSIS - 30/06/2023BUY ABOVE - 44100
SL - 43940
TARGETS - 44260,44480,44600
SELL BELOW - 43940
SL - 44100
TARGETS - 43810,43700,43530
Trade Safe & Happy Trading Guys
This is only for educational purpose so TAKE YOUR OWN RISK REWARD

BANKNIFTY--Will Touch ATH ??Observations::
The Banknifty index is showing selling pressure in ths zone @43900 level...
but failed to take the price below yesterday's supply zone @43700 levels.
until price breaks this level and retest don't think of short again...
False breakdown may also happens....don't go for short until price breaks 43600 level. It may again reverse...
if we see the chart, price respect the demand zone @43400 and will again moving upwards...
on top we have strong resistance levels @44100-44200 level...
if price consolidates between these 2 levels and will gives us breakout...
if price consolidates between 44100-44200 level and moves upward..
we have strong fall area 44350 level,may push the price downwards again but area of value @44100-44200 will again push the price upside...
so consider it as a pullback to 44100-44200 level.
Again price is also near its trendline breakout...

TRADE PATTERNSFIBONACCI LEVELS
How retracement levels works in fibonacci
BULLISH CHART PATTERNS
Identify this type of patterns in live market and take perfect entry & get your profits without loss
Make sure you definitely main the stoploss & trade

NIFTY ANALYSIS - 28/06/2023BUY ABOVE - 18830
SL - 18800
TARGETS - 18880,18950,19000
SELL BELOW - 18800
SL - 18830
TARGETS - 18750,18720,18650
Trade Safe & Happy Trading Guys
This is only for educational purpose so TAKE YOUR OWN RISK REWARD

NIFTY ANALYSIS - 27/06/2023BUY ABOVE - 18720
SL - 18650
TARGETS - 18750,18800,18830
SELL BELOW - 18650
SL - 18720
TARGETS - 18580,18480,18410
Trade Safe & Happy Trading Guys
This is only for educational purpose so TAKE YOUR OWN RISK REWARD
