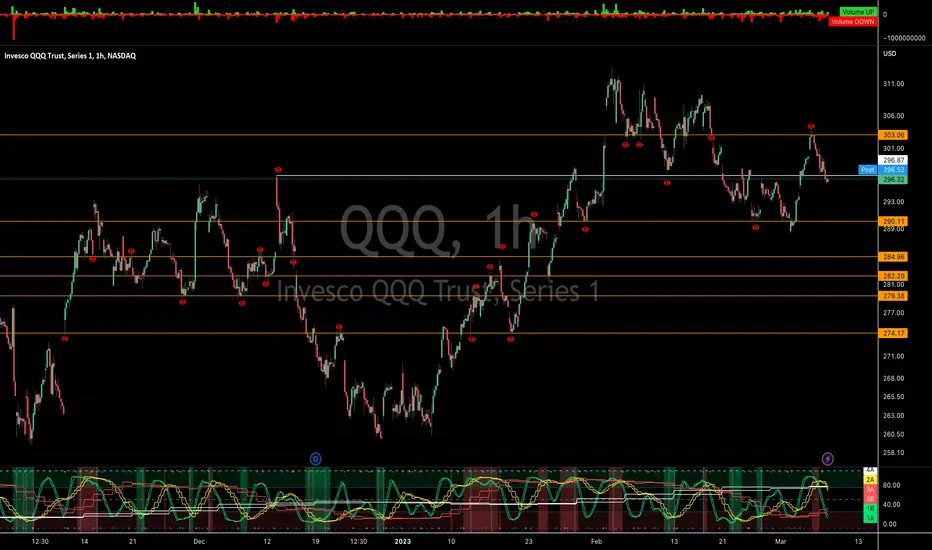
QQQ Support and Resistance is KEYI have a short story for you all but first it's important to mention that we're right at an important level that was created on December 13. If we stay trading below this level, the next important level is near 290. That's a decent drop from where we are today. Keep a watchful eye on your indicators as there's more downside as a possibility.
Once upon a time, there was a young trader named Jack. He had just learned about support and resistance levels in trading and was eager to apply his newfound knowledge to the markets.
Jack studied the charts and noticed that the price of QQQ was approaching an important resistance level. He knew that if the price broke through this level, it would signal a bullish trend and the bulls would be in control of the market. However, if the price failed to break through the resistance level, it would indicate a bearish trend, and the bears would be in control.
Jack placed an options trade on QQQ, betting that the price would break through the resistance level. However, the market had other plans. The price failed to break through the resistance level, and instead, it started to drop rapidly.
Jack watched in horror as his trade plummeted. He quickly realized that the bears were now in control of the market. He tried to cut his losses and sell the stock, but it was too late. The market had already moved against him, and he had lost a significant amount of money.
Jack learned to always pay attention to support and resistance levels in trading. He knew that if the price was below an important resistance level, it was a sign that the bears were in control, and he should avoid placing bullish options trades. Instead, he would wait for the price to break through the resistance level before placing any trades, ensuring that he was always trading with the trend and not against it.
Levels
BANK NIFTY ANALYSIS - 08/03/2023Buy Above - 41440
SL - 41350
Targets - 41670,41880,42000
Sell Below - 41260
SL - 41350
Targets - 41160,40900,40730
Trade Safe & Happy Trading Guys
This is only for educational purpose so TAKE YOUR OWN RISK REWARD

NIFTY ANALYSIS - 08/03/2023Buy Above - 17750
SL - 17710
Targets - 17800,17910,18000
Sell Below - 17670
SL - 17730
Targets - 17630,17580,17540
Trade Safe & Happy Trading Guys
This is only for educational purpose so TAKE YOUR OWN RISK REWARD

CAD - Trade idea! CAD - Trade idea!
Another week, another trade opportunity!
USDCAD - Very clear levels.
Currently we are within the ranges. Highs: 1.36600 Lows: 1.35375
A break of key resistance highs, we could go towards 1.37730 areas. However, we if break below the lows and further down below 200 EMA I expect it to reach towards 1.34380.
Keep in mind false breaks out, take a look at crude and most importantly NFP this week!
Trade Journal

AAPL Aims to Reach $160 Target in Near FuturePrice action in financial markets often gravitates towards key supply zones, which are areas where selling pressure has previously been strong enough to drive prices lower. Traders and investors often use supply zones as important levels to watch for potential price reversals or to enter short positions.
AAPL is no stranger to this, and when looking at the price action mixed with the key indicators on this 4h timeframe, we can see the last few times that the wave master indicator called a buy and sell:
DEC 10 2021: SELL: 179.50 (-6%)
DEC 30 2021: SELL: 178.19 (-14%)
FEB 03 2022: SELL: 173.00 (final warning -14% before -27%)
JUN 14 2022: BUY: 133.25 (+32%)
JAN 05 2023: BUY: 126.50 (+22.4% so far)
We're not geting a solid sell signal yet, but we're darn close. Look at ALL the waves. red, yellow, white are all overbought and the green wave is almost there. That will be the first time we've seen this since Feb 03 2022 but the chart formation looks more like the DEC 30 sell signal.
I'd be very cautious as a drop is likely to occur over the next 1-2 weeks. Probably won't be super deadly like other drops have been but it'll be enough to kill some late bulls for sure.

DAX - Up Up & Away!DAX
We've had European indices out-perform compared to US indices, this would be due to international opportunities increase this has been executing for while a hedge against US, we look at US yields we are 5% roughly now that into consideration of going into US indices the need of making a return is relative high, now compared to the opportunities and growth of Europe! In my previous posts you can see FTSE100 that idea playing out well.
Now I am sharing the DAX chart as I think we could even re-test those highs that has been tested couple times, a break through key resistance where we are currently at the momentum is still on long side and targets would be 16250 areas and look that 1.618 Fib. However, if we break below 15150 areas and break out down side of this beautiful channel then I'd expect 50 EMA areas to be your target areas.
My thoughts overall, we really need pay attention to DXY where that's going to play further, daily close perhaps below of ranges we are at a pull back will occur but we do have NFP and if that is above let's say 220k and is strong number higher expect DXY to rally yields, and we also need to take not only NFP into consideration this week, let's not forget next week we have CPI. Take in all this important US data, and then we need think is market still pricing just 25 basis point hike or will we go 50, currently its pricing 25...Time will tell! I still think housing crises will increase and the automotive industry will face further issues.
Key tip: Don't forget to look at the bigger picture!
Have a great week ahead,
Trade Journal

BANK NIFTY ANALYSIS - 06/03/2023INTRADAY TRADING LEVELS
Buy Above - 41390
SL - 41280
Targets - 41550,41670,41880
Sell Below - 41160
SL - 41260
Targets - 40900,40730,40600
Trade Safe & Happy Trading Guys
This is only for educational purpose so TAKE YOUR OWN RISK REWARD

BANK NIFTY SWING TRADING - MARCH 2023BANK NIFTY
MARCH - SWING TRADING ANALYSIS
Buy Level - 41500
SL - 40500
Target 1 - 42000
Target 2 - 43000
Target 3 - 40400
Trade Safe & Happy Trading Guys
This is only for educational purpose so TAKE YOUR OWN RISK REWARD

BTCUSDT - Falling Wedge and LevelsBTCUSDT 15 minute UTC + 1
Today 23,400 morning has been heavy resistance. I was expecting the nPoc at 23,100 was quite surprised the breakout from the middle of maybe nowhere. Hmm, maybe a swing failure, to trap longs.
Amazing the levels how well respected they have been, nPoc, Weekly etc. It a beautiful thing. I missed the trade personally, and thinking a retrace to nPoc, well at least where I find a value area to trade. Too much volatility, to enter late and after a pump, riskay.
Not trying to predict the price movement. This is a good indication of support and resistance levels. Know your levels. Next major resistance is the daily open price. This will flip the current big resistance level at approx. 23,400 as a support. 23,300 my current support level (toit - aka tight).

BANK NIFTY ANALYSIS - 03/03/2023Buy Above - 40500
SL - 40420
Targets - 40600,40720,40800
Sell Below - 40300
SL - 40480
Targets - 40140,40000,39900,39750
Trade Safe & Happy Trading Guys
This is only for educational purpose so TAKE YOUR OWN RISK REWARD

BANK NIFTY - 02/03/2023Buy Above - 40720
SL - 40650
Targets - 40800,40900,41080
Sell Below - 40600
SL - 40680
Targets - 40530,40350,40150
Trade Safe & Happy Trading Guys
This is only for educational purpose so TAKE YOUR OWN RISK REWARD

NIFTY ANALYSIS - 02/03/2023PARALLEL CHANNEL PATTERN
Buy Above - 17470
SL - 17430
Targets - 17530,17600,17680
Sell Below - 17430
SL - 17460
Targets - 17340,17300,17250
Trade Safe & Happy Trading Guys
This is only for educational purpose so TAKE YOUR OWN RISK REWARD

BANK NIFTY ANALYSIS - 01/03/2023I'm Sorry for my late uploading Trade Strategy
I'm Not Available today
Buy & Sell Levels are given in the Chart Please Check it
Trade Safe & Happy Trading Guys
This is only for educational purpose so please TAKE YOUR OWN RISK REWARD

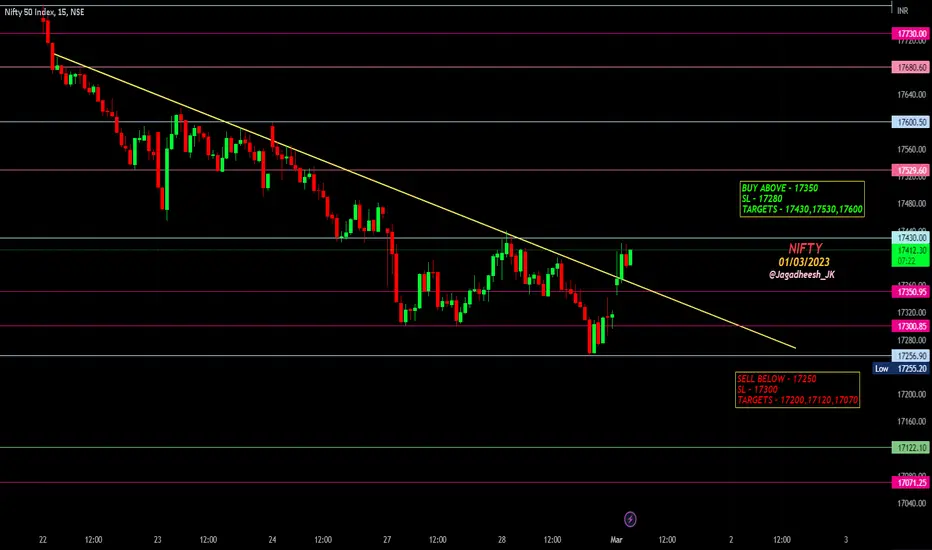
NIFTY ANALYSIS - 01/03/2023I'm Sorry for my late uploading Trade Strategy
I'm Not Available today
Buy & Sell Levels are given in the Chart Please Check it
Trade Safe & Happy Trading Guys
This is only for educational purpose so please TAKE YOUR OWN RISK REWARD
Can ACH keep going?Watching ACH and have been for weeks. Here's my primary observation right now.
We've had several areas that acted as support on the way down that broke.
Ever since January 14, we've been breaking those support levels which were acting like resistance and we keep flipping them. Until some important support levels get taken out, I'm going to remain bullish.
Disclaimer - I purchased ACH below 0.01 - it was closer to 0.008 and I locked in profit as you should as soon as it hit 100%. Now the trade is 230% but that shouldn't be a reason for you to fomo. Watch for good retests of levels (outlined in the chart) for a potential entry.
Crypto will get a pullback eventually. Don't go heavy into positions like this one now. That time has come and gone.

BTCUSDT - LevelsDaily levels - 1. Levels ping pong. Daily open to previous day close etc. Look closely at these levels! Dotted lines are High wicks - ends. Weekly is yellow 25,030. 23,775 deadly buy signal. 2 weeklies. Dotted yellow.

EURUSD - IMPORTANT LEVELS 📉The EURUSD Price touched the resistance zone
Currently, the price is testing 1.06774 support level
i'm waiting for a breakout 📉
then! we will see a bearish move !
TARGET: 1.05500
...
if you agreed with this IDEA, please leave a LIKE, FOLLOW or COMMENT!

End of Jan projection ETHUSDExpecting the following targets to be achieved by the end of March, with the first one achieved by end of Jan 2023.

Width measurement up to 3 levels of FTMWith the beginning of the same sufferings, we can expect the continuation of the process up to three levels ."

NIFTY ANALYSIS - 15/02/2023Buy Above - 17960
SL - 17920
Targets = 18020,18080,18140
Sell Below - 17900
SL - 17930
Targets - 17860,17800,17780
Trade Safe, Strictly follow your STOPLOSS
Happy Trading Guys

Watch big round numbers and their halvesSee how price reacts at 1000 pips increments (1, 1.10, 1.20, 1.30) and their quarters (1.25, 1.05, 1.075 and so on).
The reaction at those levels is nearly guaranteed. Once price hit 1.10 recently, we saw a pullback of 350 pips to the downside.
Those psychological levels will be highly useful to any trader. They work well on majors (USD baed pairs), less so on crosses.
For educational purposes only.

Upper and Lower Fair Value Gaps; immediate levels based on FibsFVGs from Previous week labeled includes 15min and smaller time frame gaps within. Opening prices for ES in green. Fib levels from swing points.

UPDATE: Week Commencing Feb 6 GBPJPY Outlook: Still long UPDATE: WC0206 GBPJPY Outlook: Still long until DTF LL is broken
MTF Analysis
Check annotations in the anchored notes for M-W-D-H4-H1 analysis.
I've updated GJ's outlook for this week from the last one published in January -- specifically the Weekly Anchored Note
Weekly Timeframe Outlook
Sun,1/22/23 -
Bearish downtrend
UPDATE:
Mon, 2/6/23
1. WC 30 Jan weekly candle ended up being a lower high. A 120 pip rejection wick from December's low.
2. There is a weekly and monthly imbalance that is coinciding with
- December's 50% level (almost)
- January's high
- Previous week's high
- This is supported by the 200 EMA (Daily TF) as it will be tapping it / be under it.
Weekly BIAS:
1. Price is bullish until it reaches/ taps #2's confluence areas.
2. Once it taps #2 conf areas, it will melt until it reaches January's low (which is also coinciding with the last Daily TF lower low) -- price will tap this daily and monthly conf area and then it will rocket and resume the bullish trend that it has been having.
ON THE FLIP SIDE.
1. The last low of the Daily TF. 155.39 X January low -- if price pierces that level and continues all the way down then it may just melt until the next monthly key level which is around 150.75
2. It may just continue the uptrend all the way at least to the M&W trendline
FUNDAMENTAL HIGH IMPACT NEWS FOR GJ FEB AND MARCH
Date Country & Event
2023, February 07, 08:01 (United Kingdom) BRC Retail Sales Monitor YoY
2023, February 10, 15:00 (United Kingdom) Goods Trade Balance Non-EU
2023, February 10, 15:00 (United Kingdom) Goods Trade Balance
2023, February 10, 15:00 (United Kingdom) GDP MoM
2023, February 14, 15:00 (United Kingdom) Employment Change
2023, February 14, 15:00 (United Kingdom) Claimant Count Change
2023, February 14, 15:00 (United Kingdom) Unemployment Rate
2023, February 15, 15:00 (United Kingdom) Inflation Rate YoY
2023, February 16, 07:50 (Japan) Balance of Trade
2023, February 17, 15:00 (United Kingdom) Retail Sales YoY
2023, February 17, 15:00 (United Kingdom) Retail Sales MoM
2023, February 17, 15:00 (United Kingdom) Retail Sales ex Fuel MoM
2023, February 17, 15:00 (United Kingdom) Retail Sales ex Fuel YoY
2023, February 21, 17:30 (United Kingdom) S&P Global/CIPS UK Services PMI
2023, February 21, 17:30 (United Kingdom) S&P Global/CIPS Manufacturing PMI
2023, February 24, 08:01 (United Kingdom) Gfk Consumer Confidence
2023, March 01, 17:30 (United Kingdom) S&P Global/CIPS Manufacturing PMI
2023, March 02, 13:00 (Japan) Consumer Confidence
2023, March 03, 17:30 (United Kingdom) S&P Global/CIPS UK Services PMI
2023, March 07, 08:01 (United Kingdom) BRC Retail Sales Monitor YoY
2023, March 10, 11:00 (Japan) BoJ Interest Rate Decision
2023, March 10, 15:00 (United Kingdom) Goods Trade Balance Non-EU
2023, March 10, 15:00 (United Kingdom) GDP MoM
2023, March 10, 15:00 (United Kingdom) Goods Trade Balance
2023, March 14, 15:00 (United Kingdom) Unemployment Rate
2023, March 14, 15:00 (United Kingdom) Claimant Count Change
2023, March 14, 15:00 (United Kingdom) Employment Change
2023, March 16, 07:50 (Japan) Balance of Trade
2023, March 22, 15:00 (United Kingdom) Inflation Rate YoY
2023, March 23, 20:00 (United Kingdom) BoE Interest Rate Decision
2023, March 24, 07:30 (Japan) Inflation Rate YoY
2023, March 24, 08:01 (United Kingdom) Gfk Consumer Confidence
2023, March 24, 15:00 (United Kingdom) Retail Sales MoM
2023, March 24, 15:00 (United Kingdom) Retail Sales YoY
2023, March 24, 15:00 (United Kingdom) Retail Sales ex Fuel MoM
2023, March 24, 15:00 (United Kingdom) Retail Sales ex Fuel YoY
2023, March 24, 17:30 (United Kingdom) S&P Global/CIPS Manufacturing PMI
2023, March 24, 17:30 (United Kingdom) S&P Global/CIPS UK Services PMI
