Imaginary levels: wave exhaustion priceCan't explain this 4 real until I explain how to properly locate levels & distinguish buying & selling waves. I KNOW I'M MESSING UP WITH ORDER OF INFO SUPPLY, SORRY.
Still...
Pretty soon you'll understand that 3393.52 and 2191.86 are the levels, and there's one buying wave between em.
Point 1 is the wave start.
Point 2 is the wave end.
When 3393.52 get cleared, another buying wave starts originating @ 3393.52 & point 2.
All the details & questions will be explained & answered later.
Now just focus on the wave exhaustion prices.
Every wave becomes exhausted in terms of price when it's range exceeds the range of the previous wave in the same direction. Not a lil bit before, exclusively past the threshold value.
So after getting past this level and considering the other conditions that would be explained later the current wave becomes prone to end and consequent start of another wave in the opposite direction.
Just as with partition levels (that are imaginary as well), these levels don't make much use any more when the real price activity start to emerge there. Imaginary levels are used when there's no alternative, but a decision has to be made.
Levels

Imaginary levels: partitionsImaginary levels are used when there’s no alternative, but a decision has to be made. We need something to "snap" to.
No, these are not the binary levels like 512, 8912 or 65536 that I'm sure a lot of funny people are hiding or present as super secret, lol no.
When there's truly nothing else and just the empty medium, we take partition function, give her all the integers, and get the levels around which the long-term order flow might change direction. Dem are already calculated, called Sequence A000041 , more info there .
That's the natural way how to find level in the emptiness.
After having the real trading activity at these levels we can forget dem partition levels, ain't no reason to use em anymore.
Since the start of 20th century, mainstream text book science seem to forget about the concept of aether (tldr the emptiness is an object itself, and it's not uniform, 'everything' exists in a medium including waves & light, totally obvious if you use your own head for thinking). As usually, the lovely market, as a sub-universe in our universe, is the same, teaching the real stuff & proving fakies wrong.

Dot - And a bunch of Alts look the sameMost of my titles are pondering, watching, stalking. That sort of thing. I see the potential setup according to my trade rules and sit on my hands awaiting. This one is no different.
Bunch of Alts look basically the same. Showing a spike down to an area that has shown some strength as a level in the past. If you draw levels, go right to left. Decide on strength of level. Have things you watch for, and trade on.
I'm on the lookout for a swing failure pattern, as always will depend on context, how price moves into the area and overall market strength. I get the sense that this next little bit will be BTC/ETH focused however, will keep an eye out.
Don't get too hung up on the candles in blue, just showing what an SFP may look like. Results will vary.

Longer term downside targets into 2023My type of trading works in finding longer term channels that the $SPX will trade in and sell or buy trendlines as we move along into the year. It pays to find these channels early to be able to follow price well. One of these ways that could be worth a shot is connecting the tops and bottom and finding fibonacci levels that make sense based on 2022.

The price has formed a triangle. Good entry pointThe asset is traded on volumes. The price has formed a triangle, a situation for the continuation of the movement. Fixed below the volumetric level of POC. The market is negative. I expect a fall, the target is 0.2809$

Good volumes. Expect a drop below The asset is traded on volumes. We came to the level of resistance, got a reaction. Fixed below the volume level of POC, which indicates weakness. We also broke through the sloping support level. I expect the fall to continue. Goal - 0.477$

strong resistance level on the round number. Good entry pointThe asset is traded on volumes. The price approached a strong resistance level on the round number - $ 1.2. We can observe periodic flashes of volumes that ended in shadows, which indicates the weakness of the buyer. An inclined level in support has formed, we shake it. I expect a breakdown and movement to the volumetric level of POC - 1.135$

EUR-USD Technical Analysis!
Hello,Traders!
EUR-USD is now retesting
A horizontal resistance level 1
While trading in an uptrend
And I am bullish biased mid-term
Short term however, we can expect
Some range trading between
Support and resistance levels
And after the likely bullish breakout
The next goal for the pair
Will be to reach horizontal resistance 2
From where we are likely to see
A bearish pullback
Like, comment and subscribe to boost your trading!
See other ideas below too!

Technical analysis for FLMHigh sales volume failed to dump the price that shows us strong buyers. Higher than average volumes and probable liquidity grab demonstrate long movement continuation. Open long on high activity only.

$NZD - Where to next?$NZD - Where to next?
Here is the great element of trading us traders can take advantage of even we are within ranges - there are still opportunities. Here's a clear view of the levels it can go towards.
Today we have PPI which will move the markets and next week we have FOMC - Take advantage of the moves and data that's coming through whilst sticking to your OWN trade plan.
Best,
Trade Journal

BB Looking Bullish At Support!BB is currently at support and it looking to move higher. Stop loss should be set below the support box which is a clear invalidation. ES1 & S&P500 are currently looking bearish on the higher TFs but a quick pump can happen before the higher TFs play out.
Love it or hate it, hit that thumbs up and share your thoughts below!
Every day the charts provide new information. You have to adjust or get REKT.
Don't trade with what you're not willing to lose. Safe Trading, Calculate Your Risk/Reward & Collect!
This is not financial advice. This is for educational purposes only.

Large volumes appeared. I expect a rebound from the support leveThe price has been in a downward movement for a long time. Large volumes appeared. Got a reaction from the level. An oblique level in the resistance was formed. I expect a rebound from the support and movement towards the boundaries of the inclined level. Goal - 0.477$

$XAU - Gold, where are you heading?$XAU - Gold, where are you heading?
Another day, another great opportunity...Precious metals within the ranges a break to either direction!
Trade Journal

USDJPY trailing stops, EURJPY short comingThe yen’s up by nearly 8% against a correcting dollar, and by more than 10% against all the Latam currencies which have been the best FX performers this year. Back in 1998, USD/JPY was halfway through a correction that took it almost back to 100, after rallying from just above 100 to just below 1 150 in1996/1997, and then falling back in 1998/1999. A cynic might point out that US/JPY has averaged 108 over the last 30 years, gyrating in the 75-150 range. All sound and fury, but not actually signifying much! Purchasing Power Parity was never of any use for forecasting but on that basis, USD/JPY was, until a few weeks ago, a chapter relative to the dollar than it has been at any point since the end of Bretton Woods. Over 50 years, USD/JPY has averaged 150, PPP has averaged 170. A 20% JPY overvaluation. From there 40% undervalued is an extreme move and while we can understand why it happened, the potential for a whipsaw correction similar in magnitude to what we saw in 1998/1999, 2002/2004, 2007/2011, or 2016, is clear. Japanese investors have been significant sellers of foreign bonds this quarter, hardly surprising but a positive for the yen on days when geopolitics, energy prices, and the BOJs current policy stance aren’t dominating the market. The story this morning (and catalyst for the yen’s bid, focuses on anti-Covid-Zero protests in China, which have punctured some of the re-opening optimism and hurt risk-sensitive currencies everywhere but AIUD, NZD, and KRW in particular. AUD wasn’t helped by weak retail sales., either. The euro started slowly but has found a bid amid ongoing slightly hawkish ECB rhetoric. Ahead, we have CPI data this week (Germany tomorrow, EZ on Wednesday) and we expect lower core inflation for the Eurozone, and I’m not confident of a break in EUR/USD 1.05 (which would drag money into the euro) but will be watching. EUR/GBP is currently failing to break lower, which may mean GBP short covering is all but complete, though sentiment is bad enough to prove sterling with more support than it deserves. The rest of the week will see attention on Friday’s labor market data in the US and Canada, month-end, and football. © Sociéte Genérale
The USDJPY has been falling along with yield curves and oil. The yen is clearly strengthening as the drag effect of monetary policy and the energy crisis wains. But it could also be the canary in the coal mine that reflects the market's mood around China and the disruptions happening there. The yen is a safe haven currency and usually, the yen is the indicator that not all is well in the world. Though the US dollar has been the ultimate safe haven due to the rate differentials. The market is trying to tell us something.
The EURJPY is about to follow the USDJPY and this means we could potentially have a trend trade about to start.

The coin is traded on volumes. Support for the POC volumes levelThe price broke through the inclined level and fixed higher. The coin is traded on volumes. After the impulse, we returned to the retest. At the bottom there is support for the POC level, stop for the level. I recommend entering the position from $ 4.723. First goal - 4.85$

Local highs are decreasing. We broke through the inclined levelLocal highs are decreasing. We broke through the inclined level, secured lower and went to the retest with a large shadow. Got a response from the POC level. Volumes are falling. I expect a return to the mirror level. Goal - 1228$

NasdaqIt's been a while since I posted my thoughts about the indices. Watch out for a breakdown of the 12130 and 12480 levels. Around there we might see a reversal and the end of the cristmass rally. But I do not exclude the change of the trend. When all around are shouting about further falling - we should take it, I think.

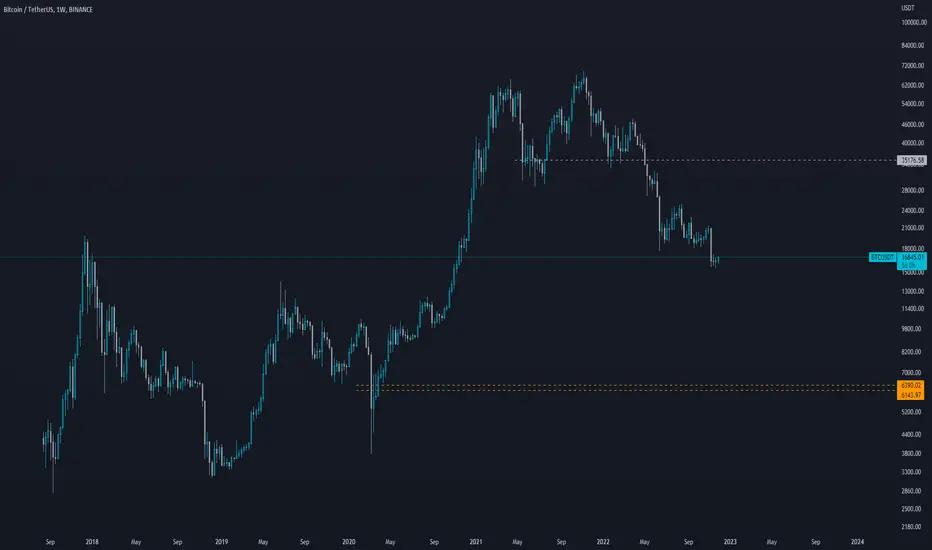
BTC Bottom TheoryTheory that im currently working with would dictate that we take out these previous lows before flipping momentum. Meaning there is significant amount of pain to come. I think if the casual traders in general had a better idea of what they were doing, than the market would find equilibrium easier. As it stands, there are too many easy targets out there with the ICT and "smart money concept" traders misunderstanding price action that the market just gobbles them up. Be careful out there folks, and good luck traders. I would say not to get truely macro long until this 7k level is swatted at the very least by a wick. Ideally these lows are taken out.
The coin formed an upward wedge. Time to sell!The coin formed an upward wedge, which is a bearish structure. The riders do not have the strength to push the price higher. At the moment, the breakdown of the ascending structure and the breakdown of support down at elevated volumes begins. I expect an impulse decline with confirmation of volumes in the seller's glass to the lower support levels. The goal of reducing 1-3% of impulse movement.

BARRISH STRUCTURE PATTERENS !!!!!!!Hello everyone, if you like the idea, do not forget to support it with a like and follow.
Through technical analysis, the market will be bearish if the coin has a week fundamental similar to **BTC.D **.Support and resistance levels come into play at this point.If the fundamental analysis reflects the reality of the market, the method has the potential to provide accuracy of up to 99 percent.
The research also indicates that a method known as barrish fakeout can be observed.
If you like my ideas then do support them with like and follow.
Also, share your views in the comment section.

My #NFLX Analysis (Levels)Still Neutral on NFLX, Going to see what it does today for possible either way. Let me know your thoughts on NFLX.

Updated local highs. Breakout of the inclined levelThe asset has updated local highs. Came out on volumes from the sidebar. The price broke through the inclined level and fixed higher. I expect the movement to continue. Target - 0.0809$

Level breakdown on a round numberA deal to continue the short movement along the trend. Level with 2 clear touches on a round number!
I expect a pulse breakdown after a smooth approach to the level and a clamping on the lower timeframe, a retest is also possible after breaking through the level.
