Market Update - BULLISH! - And how I trade levels in a downtrendIn this video:
* A quick review of the current market sentiment
* I am bullish!
* Everything is moving as expected
* I review and instruct on a more advanced trading technique/strategy - How to trade levels in a correcting or bearish market?
* You can make gainz by going long in a bear trend!
Happy New Year Traders!
Levels

Basic Attention Token - Is $2.50 still in play? How I trade thisIn this video:
* I discuss BATUSD
* Entry levels
* Trade strategies
* Exit points
* Targets
* Possibilities
* How I would trade this.

Fantom FTMUSD Charting on the fly. Learn with me. Target $4.00! In this video:
* I chart on the fly with you all so that you can see how I do what I do
* I chart trendlines, levels, fibonacci, and bullish divergence on the 4 hr.
* We can see a longer term swing trade target of $4.00
Best of luck traders!

EUR/GBP BACK AROUND 0.8500 ZONE AFTER THE BREAKEUR/GBP stays remains unchanged in the downtrend channel after the BoE surprisingly hiked interest rates for the first time since the outbreak of the coronavirus pandemic.
Intraday bias in EUR/GBP remains neutral first and with 0.8380 minor support intact, further rally is in favor. On the upside, a firm break of 0.8600 resistance will be the first sign of a larger bullish reversal and target 0.8660 resistance next. If that level doesn’t stop the price it will activate more bulls on the market and the trades can see a price around 0.8720.
On the downside, however, a break of 0.8453 will turn bias back to the downside to retest 0.8383 low instead and it probably moves the price to test again the downside channel line around 0.8346.
Risk Disclosure: Trading Foreign Exchange (Forex) and Contracts of Difference (CFD's) carry a high-risk level. By registering and signing up, any client affirms their understanding of their own personal accountability for all transactions performed within their account and recognizes the risks associated with trading on such markets and such sites. Furthermore, one understands that the company carries zero influence over transactions, needs, and trading signals. Therefore, it cannot be held liable nor guarantee any profits or losses.

AMD analysis updated after 3 months. How has it played out? Hi everyone,
I started investing in NASDAQ:AMD last year. Have done multiple chart and fundamental analyses since.
Let's see how the stock has been performing relative to my prediction.
Last post on NASDAQ:AMD was shared on September 21st . Price was at 100 at that time. I was adding to my position aggressively at that pullback.
Then we went through the 122 level in October and even touched 162 a couple of times in November.
As we are currently in the midst of stock market uncertainty, the price has been consolidating inside the blue box between 134 and 162 .
Watch 134 closely. If it breaks, c ya at 122 .
Congrats to everyone who bought inside the yellow boxes and held.
I still think the company is great and I have not sold my position.
Trade wisely and good luck!
-----------------------------------------------------------------------------------------------------------------
Disclaimer!!!
This is not financial advise.


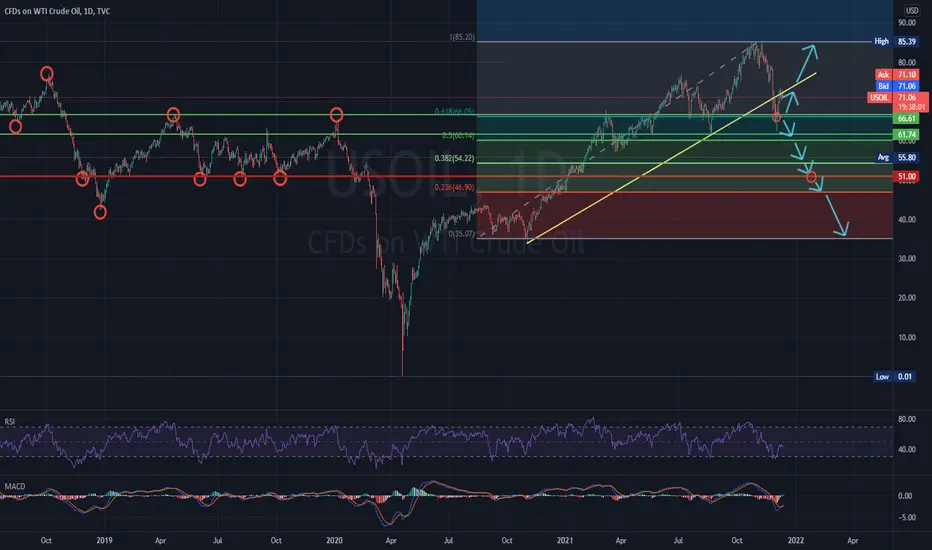
WTI STAYS BELOW AND CONFIRM SUPPORT AS A RESISTANCECrude oil is one of the most in-demand commodities, with the two most popularly traded grades of oil being Brent Crude and West Texas Intermediate (WTI). Crude oil prices reflect the market’s volatile and liquid nature, as well as oil being a benchmark for global economic activity.
Indeed, as markets await more clarity about the impact of Omicron on the global demand picture, rangebound trade makes sense. On which note, OPEC said it expected the impact of the Omicron Covid-19 variant to be mild as the world continues to adapt to the presence of the pandemic.
WTI crude oil traded lower on Monday after it hit resistance slightly below 73.60. The black liquid has been trading in a sideways manner, between that barrier and the support of 70.55 since December 7th, but overall, it remains below the downside confirmed resistance line which was the support price line taken from the low of November last year. Thus, the traders see more chances for a downside exit of the short-term range rather than an upside one. A clear break below the 61.8 Fibo and round figure of price level 66.00, would confirm a forthcoming lower low on a daily chart and may initially target the low and psychological level around 60.00. Slightly lower lies the 31.8 Fibo level around 54.50, the break of which could see scope for extensions towards the strong support line taken from 2019 around 51.00 per barrel.
Looking at our oscillator indicators we can see that RSI stopped and rebound from the oversold zone.
In order to start examining whether the bulls have gained the upper hand, the traders would like to see a strong rebound back and break through the daily support line above 76.00. This could confirm the break above the upside support line taken from the low of November 2020, and could initially target the previous high around 84.00 – 85.00 price zone.
Risk Disclosure: Trading Foreign Exchange (Forex) and Contracts of Difference (CFD's) carry a high-risk level. By registering and signing up, any client affirms their understanding of their own personal accountability for all transactions performed within their account and recognizes the risks associated with trading on such markets and such sites. Furthermore, one understands that the company carries zero influence over transactions, needs, and trading signals. Therefore, it cannot be held liable nor guarantee any profits or losses.
Futures Outlook | Planets Align (ES, NQ, ZN, CL, GC)I can make this one short and sweet. The stock indices were all up last week - a lot. The levels are all pretty clear. Can the Santa Rally continue? Apparently, the planets are literally aligned ... for something to happen. Ha!

S&P Futures Key LevelsOutlined are key levels within the range SP has been trading. Suffering a small pullback as we retest a Weekly level.

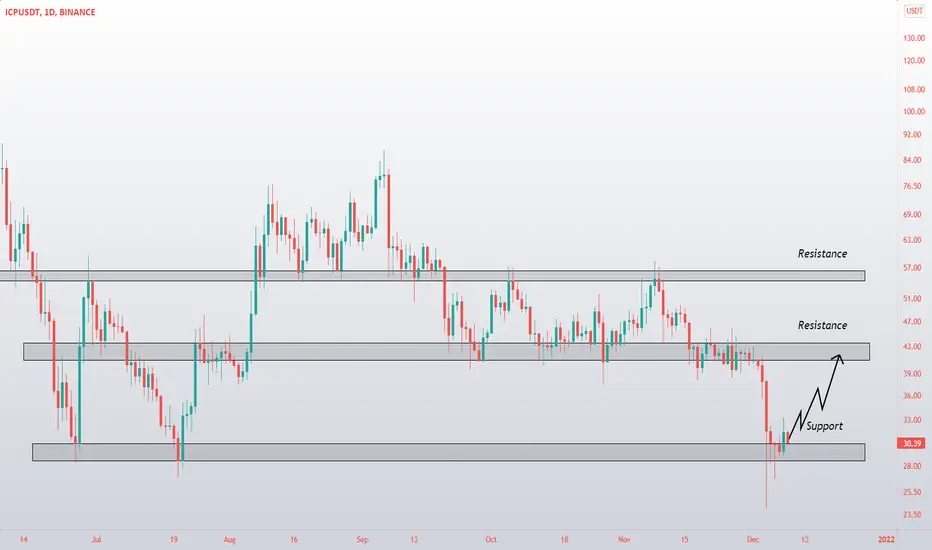
ICP/ important levelsI have marked the important ICP levels. Although the market is weak now, this does not prevent individual altcoins from shooting up.
Buys on BTCUSDThe increase in price since 4th of December looks like a new upside move on the hourly chart.
We now have higher lows and higher highs.
The next target is most likely going to be 56 083$
This is the current resistance from where we had a retracement, however the long term trades should break above it.
Follow us to find out the exact levels that we expect to see price next!

Daily Crypto Market Update - How I now plan to play my trades?In this video:
* With the crypto markets now looking to have gone bearish, I discuss what my trade strategy is moving forward
* I also discuss how we can still utilize level trading strategy in a downtrend

Sea Limited is plunging. Time to buy yet?Hi everyone,
We are currently in a midst of a moderate correction. I personally think it is almost over, based on DIX/GEX printing, the duration of elevated VIX, etc.
These kind of periods are great for your previous analysis review.
So let's do just that.
NYSE:SE has been plummeting since November 16 and has lost over 30% already.
It broke the rising trend and is far from it now.
However , my demand levels from the previous analysis showed great price interaction.
We saw some proper action at 308, 283 and 253 levels.
Every level lower is a signal for an increased size accumulation.
Next level on the way is 228 and I am looking forward to buying more if we get there.
Hope you are coping with this turmoil alright.
As always, trade wisely and good luck!
-----------------------------------------------------------------------------------------------------------------
Disclaimer!!!
This is not financial advise

GBP/CAD BUYGBPCAD is in a uptrend .
Price has already touched support on trendline and is currently making its way up to resistance
Bullish cycle is at level 1 and I await a breakout to upside
See this detailed analysis to have an insight as to why I am taking it long.

Basic Attention Token Entry Level Reached! Target 2.10 - 2.50 🚀In this video:
* We discuss the area of entry (our target down) which we have reached
* We discuss entry strategy
* We discuss our final target of $2.10 - $2.50 for Basic Attention Token.


EUR/GBP IN A SEDEWAYS AND ON 23.6 FIBONACCI EUR/GBP has been trading in a sideways manner since November 17th, between the 0.8380 and 0.8430 barriers on a 4-hours chart. However, bearing in mind the fundamentals and that the prevailing longer-term path has been to the downside, we would see more chances for the rate to exit the range to the downside rather than to the upside.
An apparent dip below 0.8380 would confirm a forthcoming lower low and may see scope for declines towards the low of February 25th, 2020, at around 0.8335. If that level cannot stop the fall, we could experience extensions towards the 0.8294 zone, which prevented the rate from falling lower back on December 12th and 13th, 2019, as well as between February 13th and 18th, 2020.
On the upside, the traders would like to see a break above the upper bound of the aforementioned range and 23.6 Fibo level before examining whether the bulls have gained the upper hand. This could result in advances towards the inside swing low of November 15th, at 0.8462 and 38.2 Fibo, the break of which could target the high of 50.0 Fibo level around 0.8483 or go higher to 61.8 level around 0.8513.
Risk Disclosure: Trading Foreign Exchange (Forex) and Contracts of Difference (CFD's) carry a high-risk level. By registering and signing up, any client affirms their understanding of their own personal accountability for all transactions performed within their account and recognizes the risks associated with trading on such markets and such sites. Furthermore, one understands that the company carries zero influence over transactions, needs, and trading signals. Therefore, it cannot be held liable nor guarantee any profits or losses.

EUR/TRY SKYROCKETS AFTER INTEREST RATE CUTSEUR/TRY skyrocketed today after Turkish President Recep Tayyip Erdogan defended the massive and continuous interest rate cuts amid double-digit inflation. He said this is part of an “economic war of independence,” rejecting calls from investors and analysts to adopt a different strategy. Turkey's short-term external debt stock rose to $124.4 billion, an increase of +8.8% since the end of 2020. The rise in USD/TRY and EUR/TRY rates will exacerbate Turkey's debt problems over the coming months. According to data released by the CBRT, nearly 43% of the country’s debt was denominated in US Dollars, and just over 25% was denominated in Euros. Inflation is near 20% in Turkey, and the Turkish central bank has cut interest rates by 400bps since September, with the latest one being 100bps, delivered last week. This, combined with investors' fear over the lack of independence of Turkey’s central bank, has resulted in a 40% drop in the lira this year and 20% since the start of last week alone.
From a technical trading perspective and looking at our oscillator indicators, we notice that MACD is above zero, and the trigger line and RSI is strongly in the overbought zone. The price yesterday stopped at 2.00 Fibo level, and it would be interesting how it will react in the following days. According to the experts, the rate would continue conquering fresh highs, and the price could reach the next Fibo level 2.272 at a price around 15.50. But if it starts correction from this key point, it is possible to drop down to 1.618 Fibo level at price levels around 13.50, and if the price breakthrough the following story, it is possible to see the rate dropping all the way back around 11.50 levels.
Risk Disclosure: Trading Foreign Exchange (Forex) and Contracts of Difference (CFD's) carry a high-risk level. By registering and signing up, any client affirms their understanding of their own personal accountability for all transactions performed within their account and recognizes the risks associated with trading on such markets and such sites. Furthermore, one understands

GBPUSD wave Analaysis and price prediction(fibo levels)I think one of these routs will work properly.the short trade is more possible.
the prices are spotted on the chart.

Bitcoin analysisI prefer not to take any decisions for for trades that last between 15 to 30 days.
We are in uncertain conditions, so it is better to wait to see where the market is going. With the failure of the box in any direction, we'll do in the same direction of the market breaking the box.
Loner term and shorter term trades may be in a good situations to make.

EURUSD Daily Price prediction and best entrances points(BUYSELL)There are 2 most possible setups for EURUSD trade in daily timeframe according to fibo levels.
first scenario is sell after falling under the oriented trendline after valid descending engulfing(or your favourite signal),
and the second scenario is buy trade if the price breaks up the fibo level(0.236) plus valid ascending engulfing (or your favourite signal),
the TPs are spotted on the chart and SLs must be according to your strategy(like previous swing high/low).
welltrade friends!!!

GBPUSD will eat your stop losses.To all the GBPUSD buyers, Please set a managed stop loss if you don't want to risk a big chunk of your account.
GBPUSD will drop one more time before rising again so it's time to go against the grain and sell, place order 1.34800 all the way to 1.33000.

Learn the Range Trader Strategy | Part 1 - The LevelsIn this lesson, I discuss the important levels to know for the Range Trader Futures Trading Strategy.
The indicators on the chart that produce these levels and values are the following:
1) The "T-Line" is a 233 period Exponential Moving Average (EMA) | Built-ins >> Indicators
2) The prior session highs and lows are plotted using the 4C Yest HLC/O indicator | Community Scripts >> Search for the script name
3) The overnight or Globex highs and lows are plotted using the High/Low Of Custom Session indicator | Community Scripts >> Search for the script name
4) Volume Point of Control (VPOC) is calculated with a Session Volume HD script | Built-ins > Volume Profile (These scripts require a paid TradingView plan)
Now for the levels ...
Identify the prior session high and low.
Identify the overnight high and low.
Identify the prior session VPOC.
(Current session VPOC is noted only if the overnight range exceeds 50% ATR prior to the U.S. stock market open).
Identify if price is above or below the T-Line (233 EMA), indicating a bull/bear continuation or bull/bear neutral pattern.
Identify the 7-day Average True Range (ATR) for the instrument/product you are trading.
Follow Me here on TradingView to be alerted to the next videos in the series that go into set-ups, signals, and entries for the Range Trader based on these levels.
