EURUSD LongDecent probability conservative targets are hit even if its a continuation of downtrend to new lows. If this is continuation of a uptrend and longer timeframe reversal point the longer term targets are in play.
Levelsandzones

INTC Potential Short Set UpI think this is a relatively safe set up because of the way tech is looking as a whole.
Wait for price to break yellow line for extra confirmation of trade playing out.
Conservative stop is still pretty solid in terms of risk so hypothetically it could run that long and still play out. But probably best to just use the tighter stop, especially if yellow line is broken.
Deeper targets are very likely when this starts.

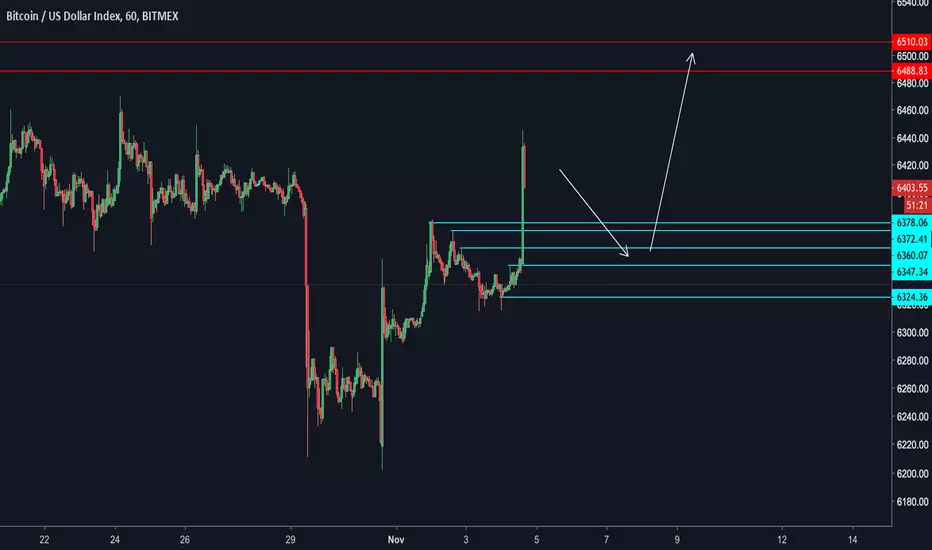
BTC Short Term TradeThe levels below are good spots for entry. The lower the better. Any of those could be where price rallies from.
Targets are next levels above around 6500. Could have strength to push further beyond but likely it will pause around 6500.
My long term targets for this leg up are 6900-7100s
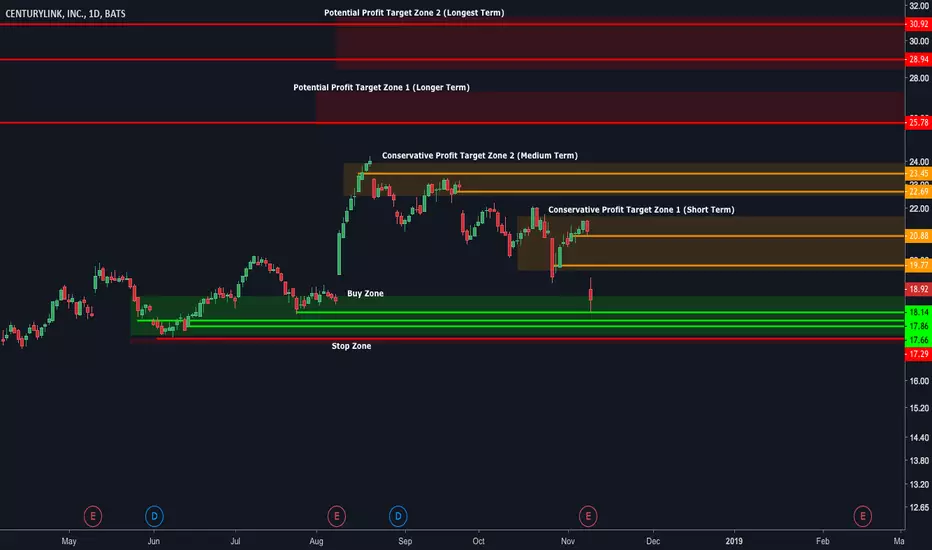
AMD Short-Mid Term Short ScenarioCould short with targets at green area. Or long at the green target areas.
Beware Longing though, this could very likely have much more downside than that green target range. Could go into the mid-low teens. May want to keep a portion of a short running past the target zone.


BIG MOVE COMING ON BTCUSDThe BTCUSD is due to a major move soon. The pair has been consolidating to the downside for several months now and it has been significantly squeezing until now.
During the last few months, the pair formed Lower Highs and Higher Lows, hence forming a nice pattern that is about to be broken.
The Sentiment Index is squeezing which is a great indication that something big is about to happen.
The Breakout Pivotal Bars is negative (red candles) so a breakdown seems more likely but we need to wait and see the color of the breakout candle.
Either way the price will break, we are prepared and ready to profit from the move.

POWRBTC Support and Resistance levelsWe are now at Good support and we are ready to buy
use a stoploss and take out some capital at each level so you can make profits
Buy around $ 0.15 or you can wait for the retrace to $ 0.125 but only if Bitcoin goes to 6000 dollar again.
stoploss at 5% below the support level
targets are at
$ 0.198
$ 0.248
$ 0.286
$ 0.325
mid/long term
$ 0.45
$ 0.54
$ 0.58
$ 0.65
If you have questions dont hesistate to comment below!

Breakout opportunity on AUDUSDA breakout opportunity is forming on the AUDUSD. The pair is in a downtrend from a few weeks and has already given three very great sell opportunities. The setup was identical for all the three:
• breakdown of price
• breakdown of Sentiment Index
• opportunities below resistance
Right now the breakout could be either to the upside or to the downside so let's just wait and see when the breakout comes.
Last but not least, always check confirmation from the indicators!

XRPEUR At support Wait for Bounce XRP at Support now and wait for Bounce or Break at 0.25 euro!
If price breaks than we will see 0.197 euro
please leave comment for more info

FACEBOOK, clear level (173.83) testing by price.The long-known X-Lines indicator proves that it's worth your attention. Pay attention to the accuracy with which the market has worked out an interesting price (173.83) received by the indicator.

HOW TO RIDE TRENDSThis educational idea refers to the last trading idea I published (linked below) and to many more I traded in the past.
The chart above shows the BTCUSD going from about 6'500 at the beginning of April up to around 10'000 in early May and all the way back down to about 6'500 in mid-June.
This idea shows how it was possible to ride the trend all the way up (4 buy opportunities) and all the way down (4 sell opportunities) with three indicators: the Breakout Pivotal Bars , the Sentiment Index and the Levels and Zones .
Here's how they work to identify setups:
Breakout Pivotal Bars
• For break-ups the candle must be coloured in green.
• For break-downs the candle must be coloured in red.
• Blue candles mean indecision so either trend continuation or imminent trend reversal. Depending on your strategy it is possible to trade them or not.
Sentiment Index
Possible situations are:
• Breakout (e.g. Bullish Sentiment in case 1 or Bearish Sentiment in case 8)
• Divergence with the price (Bullish Sentiment in case 8)
Levels and Zones
Gives a reference in real-time to where the most significant levels and their corresponding long/short zones are.
Let's see the 8 trading opportunities:
1. Break-up of consolidation (blue candle) + Break-up of Bullish Sentiment + Above Support -> GOOD OPPORTUNITY
2. Break-up of consolidation (green candle) + Break-up of Bullish Sentiment + Above Support -> GOOD OPPORTUNITY
3. Break-up of consolidation (blue candle) + Break-up of Bullish Sentiment + No Support nearby -> VALID OPPORTUNITY but pay attention
4. Break-up of consolidation (green candle) + Break-up of Bullish Sentiment + Resistance Above -> VALID OPPORTUNITY but pay attention
5. Break-down of consolidation (red candle) + Break-down of Bearish Sentiment (divergence in Bullish Sentiment) + Below Resistance -> GOOD OPPORTUNITY
6. Break-down of consolidation (red candle) + Break-down of Bearish Sentiment + Support is pretty far! -> GOOD OPPORTUNITY
7. Break-down of consolidation (red candle) + Break-down of Bearish Sentiment + Support is pretty far! -> GOOD OPPORTUNITY
8. Break-down of consolidation (red candle) + Break-down of Bearish Sentiment + Support is still pretty far! -> GOOD OPPORTUNITY

BREAKOUT ON BTCUSDA breakout occurred a few hours ago on BTCUSD.
Remember to always follow your strategy!

Long opportunity on EURUSDA long opportunity is emerging on EURUSD 60min.
• Price is consolidating
• A resistance turned into support at 1.1696
• Bullish sentiment is fading. We need a breakout of the trendline
Always wait for confirmation from your indicators.

The fall continuesAs we expected, the price had corrected to 1.20 and then rushed down again. We anticipate the dollar to strengthen further and an overall decline of the pair. At the moment the body of the candle is below the level of 1,1920 and in case of fixation on this level we expect the advance to the level of 1,1860.
Technical indicators are also giving confirmation on the sale. Because of that we advise to take short positions and set Take-Profits near the level of 1,1860.

ANTICIPATING THE MARKETThis idea shows how the Sentiment Index indicator clearly anticipates big shifts in the Market.
The first situation shows the EURUSD consolidating between late 2016 and spring 2017 – the consolidation was characterized by a consistent decline in the Bearish Sentiment which ultimately led to a strong uptrend until early 2018 (1500+ pips movement).
The second situation shows the EURUSD in an opposite setup – a sligthly shorter consolidation charaterized by a decline in the Bullish Sentiment and a consequent breakdown of the pair.

Predicting market moves with JUST ONE INDICATORThis idea shows how easy it was to identify a massive opportunity on BTCUSD with the Levels and Zones indicator.
Basically, after days of sideways movement, the pressure started to build up and ultimately a massive explosion took place!
First, the Resistance Level moved significantly down (hence pushing price lower), then the Support Level made its move up (hence pushing price higher). Give it a few more time for the pressure to increase further (price is forced to move into a tight channel) and then the explosion takes place.
You can find a similar setup before most of the major impulsive movements across any asset and timeframe. First, pressure builds up then, the explosion takes place!

BTCUSD, important levels for a 4-hour chart by X-Lines indicatorImportant levels for a 4-hour chart are built automatically using the X-Lines indicator. You can add the indicator to your favorites by clicking on the link below.

BREAKOUT ON GBPUSDA breakout occurred on the GBPUSD a few hours ago. A retest might be a good place to enter.
Remember to always follow your strategy!

BTCUSD Daily Analysis of Levels - 25th March 2018See chart. See link to related ideas as well. They are supposed to be viewed together.

BTCUSD Monthly Analysis of Levels - 25th March 2018See chart and look at linked/related notes. It is supposed to be viewed together.


