#LEVER/USDT #LEVER#LEVER
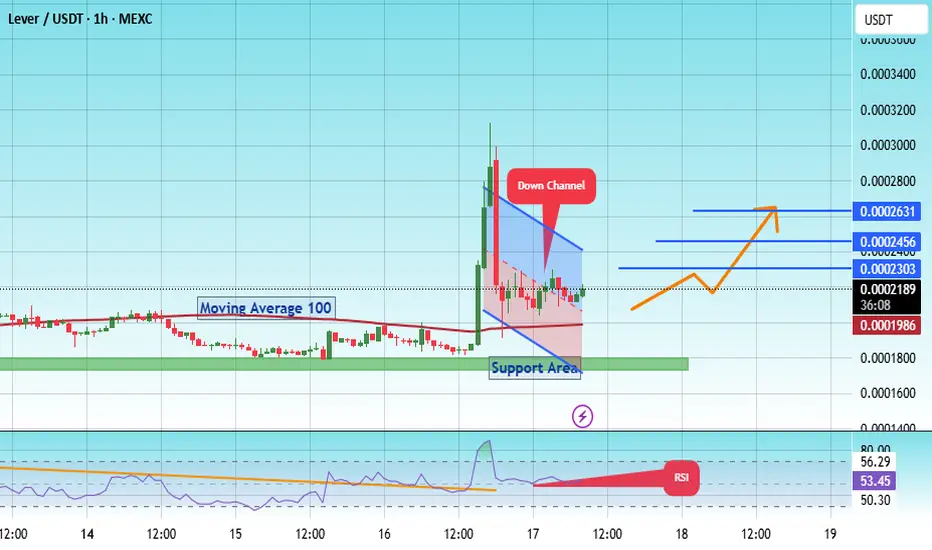
The price is moving within a descending channel on the 1-hour frame, adhering well to it, and is on its way to breaking it strongly upwards and retesting it.
We have support from the lower boundary of the descending channel, at 0.0001650.
We have a downtrend on the RSI indicator that is about to break and retest, supporting the upward trend.
There is a key support area (in green) at 0.0001764, which represents a strong basis for the upward trend.
Don't forget one simple thing: ease and capital.
When you reach the first target, save some money and then change your stop-loss order to an entry order.
For inquiries, please leave a comment.
We have a trend of stability above the Moving Average 100.
Entry price: 0.0002196
First target: 0.0002303
Second target: 0.0002456
Third target: 0.0002630
Don't forget one simple thing: ease and capital.
When you reach the first target, save some money and then change your stop-loss order to an entry order.
For inquiries, please leave a comment.
Thank you.
Lever
#LEVER/USDT Forming Strong Falling Wedge#LEVER
The price is moving within a descending channel on the 1-hour frame and is expected to break and continue upward.
We have a trend to stabilize above the 100 moving average once again.
We have a downtrend on the RSI indicator that supports the upward move with a breakout.
We have a support area at the lower boundary of the channel at 0.0001915, acting as a strong support from which the price can rebound.
We have a major support area in green that pushed the price upward at 0.0001672.
Entry price: 0.0001955.
First target: 0.0002087.
Second target: 0.0002283.
Third target: 0.0002472.
To manage risk, don't forget stop loss and capital management.
When you reach the first target, save some profits and then change the stop order to an entry order.
For inquiries, please comment.
Thank you.

#LEVER/USDT#LEVER
The price is moving within a descending channel on the 1-hour frame, adhering well to it, and is on its way to breaking it strongly upwards and retesting it.
We have a bounce from the lower boundary of the descending channel. This support is at 0.00016000.
We have a downtrend on the RSI indicator that is about to break and retest, supporting the upward trend.
There is a key support area in green at 0.0001500, which represents a strong basis for the upward trend.
Don't forget one simple thing: ease and capital.
When you reach the first target, save some money and then change your stop-loss order to an entry order.
For inquiries, please leave a comment.
We have a trend of stability above the Moving Average 100.
Entry price: 0.0001750
First target: 0.0001880
Second target: 0.0002163
Third target: 0.0002427
Don't forget one simple thing: ease and capital.
When you reach the first target, save some money and then change your stop-loss order to an entry order.
For inquiries, please leave a comment.
Thank you.

#LEVER/USDT#LEVER
The price is moving within a descending channel on the 1-hour frame and is expected to break and continue upward.
We have a trend to stabilize above the 100 moving average once again.
We have a downtrend on the RSI indicator that supports the upward break.
We have a support area at the lower boundary of the channel at 0.0001404, acting as strong support from which the price can rebound.
Entry price: 0.0001529
First target: 0.0001795
Second target: 0.0002040
Third target: 0.0002333
To manage risk, don't forget stop loss and capital management.
When you reach the first target, save some profits and then change the stop order to an entry order.
For inquiries, please comment.
Thank you.

#LEVER/USDT Bullish ?#LEVER
The price is moving within a descending channel on the 1-hour frame and is expected to break and continue upward.
We have a trend to stabilize above the 100 moving average once again.
We have a downtrend on the RSI indicator that supports the upward break.
We have a support area at the lower boundary of the channel at 0.000270, acting as a strong support from which the price can rebound.
We have a major support area in green that pushed the price upward at 0.000268.
Entry price: 0.000276.
First target: 0.000295.
Second target: 0.000315.
Third target: 0.000336.
To manage risk, don't forget stop loss and capital management.
When you reach the first target, save some profits and then change the stop order to an entry order.
For inquiries, please comment.
Thank you.

LEVERUSDT Forming Falling WedgeLEVERUSDT is showing a highly promising setup that’s generating buzz among traders and investors alike. The crypto pair is forming a classic Falling Wedge Pattern, which is widely recognized as a bullish reversal signal in technical analysis. This pattern often indicates that selling pressure is weakening and a breakout to the upside could be imminent. With volume picking up steadily, there is growing optimism that LEVERUSDT could deliver a significant price surge once it confirms a clean breakout above the wedge’s resistance line.
Many traders are particularly excited about LEVERUSDT because the expected gain for this setup is an impressive 160% to 170%+. This projection, combined with the clear technical pattern and rising investor interest, suggests that LEVERUSDT may soon become one of the standout performers in the altcoin market. The recent accumulation phase, reflected in steady volume inflows, hints that savvy traders are positioning themselves early ahead of a larger move.
Another important factor supporting this bullish outlook is the broader sentiment in the crypto market. As traders look for undervalued opportunities with high breakout potential, coins like LEVERUSDT that show strong bullish patterns and healthy trading activity become attractive bets. If the breakout confirms on the daily or 4H timeframe with sustained volume, it could trigger momentum-driven buying and push prices towards the projected targets.
For traders looking to diversify their crypto portfolio with high-potential setups, keeping a close watch on LEVERUSDT is definitely worthwhile. Remember to wait for a clear breakout confirmation before entering and manage your risk accordingly to make the most of this potential reversal.
✅ Show your support by hitting the like button and
✅ Leaving a comment below! (What is You opinion about this Coin)
Your feedback and engagement keep me inspired to share more insightful market analysis with you!

LEVERUSDT Forming Strong Falling WedgeLEVERUSDT is currently showing a strong Falling Wedge Pattern, a bullish reversal formation that often precedes sharp upward movements. The recent price structure suggests consolidation is ending, and buyers are preparing for a breakout. This setup, coupled with increasing volume, indicates accumulation at the lower end of the wedge and points toward a potential gain of 140% to 150%+ if the breakout confirms and momentum sustains.
LeverFi (LEVER) has gained traction among DeFi enthusiasts due to its innovative decentralized leverage trading platform. As more investors look to decentralized finance solutions, LEVER’s real-world utility is driving both user interest and investor confidence. This rise in engagement is reflected in recent price action, where bullish divergence and buying interest are becoming more evident on the charts.
The current chart pattern suggests the pair has formed a solid base, with decreasing selling pressure and a tightening range, which often leads to explosive moves once a breakout occurs. Traders will be watching key resistance levels above the wedge for breakout confirmation, and once surpassed, LEVERUSDT could trigger a rapid bullish continuation, attracting swing and momentum traders alike.
With strong fundamentals, rising community engagement, and a technically bullish chart, LEVERUSDT stands out as a potential outperformer in the current market phase. It's an ideal time for crypto traders to keep a close watch on this breakout opportunity.
✅ Show your support by hitting the like button and
✅ Leaving a comment below! (What is You opinion about this Coin)
Your feedback and engagement keep me inspired to share more insightful market analysis with you!

LEVERUSDT 1D AnalysisLEVER ~ 1D Analysis
#LEVER This trade is very risky. Buy if you still have confidence in this coin with a short term target of at least 15%+ from this support.

Possible x's on chessTo date, the market has reached the buying period of the second half of the week, which I outlined earlier. Against the background of extremely negative statistics for the United States over the past week and a half, ether sales were successfully repaid yesterday at the next bifurcation point, and purchases with an attempt to gain a foothold above 2100 will prevail until Sunday afternoon. Against this background, there is a new opportunity for altcoin mining.
First of all, I want to draw attention to chess, which has extremely high technical goals for retest up to $ 1 and can repeat the alpaca scenario with sufficient volatility. Today, there is a trend change and by the end of the week, the probability of a 0.1 level test prevails, which is necessary to increase volatility up to the 0.25 test. If the second half of the month opens above 0.1, we can expect the trend to continue until mid-June at least and the 0.25 test. Previously, large volumes of purchases were left for a hike above 0.25. Taking this level, in turn, opens the way up to 0.50-75, but this is probably the scenario for the fall. However, we should not rule out a sharp breakdown to 0.25 this week.
In addition to chess, I am primarily considering fio for work. Pivx adx and quick can also be considered for scalping, with possible growth waves of up to 40-60% for a local break of the last wave at least. These coins have fallen in price rather due to fears of another assignment of the monitoring tag and are highly undervalued relative to the current market position. Also this week, there is a high probability of a new bull run on fantokens with interruptions of up to 2-3. The most undervalued are the city atm acms, which I consider first.

LEVER Looks Bullish (4H)The structure of the Lever symbol has turned bullish.
Within the internal substructure, we are looking for buy/long opportunities.
We have identified and marked two optimized entry points on the chart. These are the levels where we plan to open positions.
Target levels have been set.
A daily candle closing below the invalidation level will invalidate this analysis.
Do not enter the position without capital management and stop setting
Comment if you have any questions
thank you

The opportunity to earn money on the vib exit pumpIn the coming days, against the background of the beginning pullback in the market, oversold coins from the delisting announcement may become very interesting for speculators, since for strong altcoins that have shown good growth this month, the probability of falling within the rollback prevails, and the threat of assigning the monitoring tag in the second half of the week hangs over weak coins. Today, there was not enough volatility in the market for the breakdown of vib wing and pda due to the lack of futures on them. After the stock market closes over the weekend, there is a possibility of a stable payback of these instruments with major breakouts. There is also a possibility of growth impulses at the beginning of the new week, especially from Tuesday evening to Wednesday, as part of a pullback on the current monthly candle, and on May 1st, a new monthly candle. Against the background of the beginning of the sales period, there is a possibility of disruptions tonight and from Sunday to Tuesday. Vib is in an extremely oversold position, and therefore a slight additional drawdown is possible. If the price approaches 0.01, there will be a good opportunity to buy, which will bring up to 150% profit even with weak dynamics and a retest of 0.025. An additional drawdown of up to 0.5 is possible for wing, and up to 0.00600-750 for pda. With sufficient volatility, there is a chance of growth up to 0.050-75 for vib, 2.5-3.5 for wing and 0.021-25 for pda.
Working with coins from the delisting announcement is extremely dangerous due to high volatility, but it can be extremely profitable, which we observed during the pumps of the previous delisting and the example of alpaca.
In the second half of the week, after assigning the monitoring tag, I will select coins without the tag that are insured against delisting.

The end of seasonal growth, reducing work positionsThe seasonal growth cycle is ending this week. For most of the market, the sales cycle begins on Sunday. In the new week, we can still expect pumps for the turn of the month for individual coins. From Sunday to Tuesday, the probability of a market drawdown prevails as part of a pullback on the current weekly candle and shadow rendering for the new week. For coins that have already attempted to turn the month around, the probability of stable sales until the end of May already prevails from this week. From Tuesday to May 7-9 or 11-12, there will still be a flat period, when, with a general market pullback, individual coins may show growth, then the probability of a return of ether to 1500-1600 prevails, with a possible reversal and drawdown of the altcoin market. Today and tomorrow, I recommend reducing positions on coins, especially those that have shown good growth, in order to avoid drawdowns in the new month.
In the first half of the new week, growth impulses for coins that have not yet attempted to turn the current monthly candle into a bullish one are more likely. In particular, pumping is possible using vib wing and pda, which are awaiting delisting. For coins without the monitoring tag, it is better to make further purchases after the announcement of the tag assignment in the new week, because after the rollback from Sunday to Tuesday, coins can lose up to 50% additionally in the second half of the week if the tag is assigned. I will collect the list of coins for work in May after the announcement of the tag assignment.

LEVERUSDT 5DLEVER ~ 5D Analysis
#LEVER Buy gradually from here with a short -term target of at least 20%+.

LEVERUSDT 5DLEVER ~ 5D
#LEVER if you still have Conviction on this coin,. Buy in stages from here with a minimum target of 20%++

LEVERFI WILL DROP 30%This BINANCE:LEVERUSDT shows a continuing downward sloping channel.
Observe that the support has been bridged trice. while price have only ticked resistance without piercing through.
The idea is to short at the top of the channel (red line) even if price break above redline, the purple channel provides another strong resistance.
Action plan
0.002258- 0. 002180 -- sell
0.002530 -0.002656 -- Stop loss
0.001450- 0.00168 -- take profits
Goodluck!!

LEVERUSDTLEVER ~ 1W
#LEVER If this Support block is retested again. Don't hesitate to buy. So far this support block continues to maintain prices.
minimum target 20%++

LEVERUSDTLEVER ~ 1W ✅
#LEVER If this Key Support is retested again. Don't hesitate to buy. So far this support block continues to maintain prices.

Will #LEVERUSDT Defy the Odds or Dive Deeper? Watch These LevelsYello, Paradisers! Is #LEVERUSDT about to take off, or are we in for another twist? Let's look at the latest analysis of the #LeverFi:
💎#LEVER is currently flashing signs of a bullish continuation from a key support zone that used to be a descending resistance. We've been tracking #LeverFi moving within a descending channel for a while now. Recently, it broke above this pattern, retested the upper channel, and is now showing strength at the crucial support level.
💎If #LEVER holds this support, we could see a significant bullish rally reminiscent of past trends. A breakout above the resistance at $0.0026 could pave the way for a move towards higher resistance zones.
💎Should the momentum fail to sustain at the current level, the next bullish rebound might occur around the lower bullish Order Block (OB) at $0.0015. If that fails, we may see further support tested at $0.0013.
💎Stay vigilant, Paradisers! A daily close below the demand area could negate the bullish scenario and lead to a deeper correction.
Stay focused, patient, and disciplined, Paradisers🥂
MyCryptoParadise
iFeel the success🌴

LEVERUSDT Is Critical Levels to Watch!!Yello, Paradisers! Are we on the brink of a significant move in #LEVERUSDT? Let's dive in.
💎#LEVER is currently showing signs of a successful breakout from the falling wedge pattern—a bullish signal that suggests upward momentum. However, the current price action is testing the resistance zone at 0.0019 - 0.00204 and has faced rejection. If LEVER fails to break out above this resistance soon, we could see the price retracing to the demand zone at 0.00159 to gather momentum for another attempt.
💎Should LEVER manage to break through the 0.00204 resistance, there's a high probability that the price will quickly reach the first target area. If it also overcomes resistance at that level, we could witness a significant upward move towards our final target within a strong resistance zone.
💎However, the bearish scenario comes into play if LEVER tests the demand zone but fails to bounce. If this occurs, the price is likely to break down further, heading towards the last support area at 0.00134.
💎The bullish outlook will be invalidated if we see a daily candle close below the key support area. If this happens, it would confirm a continuation of the downward trend, signaling a deeper dip.
Remember, in trading, staying disciplined is key.
MyCryptoParadise
iFeel the success🌴

LEVER, getting ready to revisit X2 price!LEVER recently went parabolic on the 1st week of October by peaking at 0.30 range. From thereon, as per the usual parabolic case which warrants a hefty correction, the coin dip dives into 0.12 territory.
At present, LEVER is slowly building a good solid base and slowly crawling up based on recent daily metrics. Seven days of straight net buying activity has been registered conveying the current price range as the new base for the next series of ascend.
The coin is bouncing off a very strong major order block support with precision.
Expect some weighty price movement from here on favoring the bulls.
We are now at a good discounted range. It's not always you get a good setup like this one. SEED.
Spotted at 0.001400
TAYOR.
Safeguard funds always.

LEVERUSDT(LeverFi) Daily tf Range Updated till 11-06-24LEVERUSDT(LeverFi) Daily timeframe range. while market is having hard time today compare to that its holding nicely till now. trying to get out of 0.003990 but its a strong resistance. and not very far away from price discovery, good trade opportunity their if that happens. recent retrace point at 0.003007.

Is the LEVER super bullish?First of all, you should know that this symbol is low volume and almost risky.
We expect a medium-term bullish trend to start from the green range.
We have a triangle of the type of completion of the bearish trend on the chart
If the green range is maintained, LEVER can have significant movements.
The targets are marked on the chart.
Closing a daily candle below the invalidation level will violate the analysis
For risk management, please don't forget stop loss and capital management
When we reach the first target, save some profit and then change the stop to entry
Comment if you have any questions
Thank You

Lever x10+ Is it possible to predict a big move in price?
I think it is. You just need to wait for a confirmation breakout candle with upper volume.
I think this chart is ready for a great rally in the next few months. Just wait until you see a breakout candle ...
