Mirror image repeated pattern ETHUSD SHORTING SIGNAL/TARGET Hello my Crypto friends! Look what i have discovered today... YES a repeated pattern
nearly identical to what we saw almost a month ago. I highlighted the uptrend in BLUE and
downtrend in RED. The current 61.8 fib support level is at 138 which is a very KEY support level.
If we break through $138 expect bounce of trend line as $138 support would turn into resistance.
Once trend broken look to see support found at $125 which will be a great place to close your SHORT as
i have provided you with a trade signal in the chart that i have already shared with my VIP members!
Best of luck to everyone following this chart!!!
Thanks, LiquidMEX
DISCLAIMER:!!!This is not to be considered financial advice is my personal opinion, always do your own research before entering or exiting trades as i will not be held liable for any of your trades!!!
Leverage

Ripple Is Already Moving, Will Bitcoin Cash (BCH19) Follow?You know we have been trading BitMEX for a while now and generating great profits, I've been sharing detailed signals that aren't shared by anybody else here on Trading View, and I am really happy that you are enjoying these.
Our Ripple (XRPH19) LONG trade is playing out as expected, moving into the positive and now hit our first target for a massive 35%-55% ROE (profits), depending if you used 10X or 15X leverage.
You can see it here:
Needless to say, anything above 3X is super high leverage and high risk, but with our experience and knowledge we can safely trade this and come out winners.
Here I am looking at Bitcoin Cash (BCHH19) and a strong set up is also in place.
I have drawn the details on the chart.
Would you like to see a full trade for Bitcoin Cash (BCHH19) with buy-in, targets, stop-loss, and additional information as we have for Ripple (XRPH19)? If yes, hit like... If enough people hit like I will know there is enough interest and share. (This is time sensitive... a full trade will be shared if we reach 150+ likes).
In the meantime... ENJOY THE PROFITS from all of the other active trades we have.
Thanks a lot for the amazing and continued support.
I LOVE YOU!
This is Alan Masters
Namaste.

Daytrading Leverage Strategy for Bigger Accounts on Forex[R:R 3]Hello everyone,
Many of you wonder how it feels to trade bigger accounts, and keeping it short: stop thinking punctual.
Whenever you think I'm buying HERE and getting out exactly THERE. Forget it, never again.
There's simply not enough volume for your positions - so what you do?
You break it up and you start thinking the final average price. You stop thinking on static numbers and you start considering regions for entry and exit.
Larger institutions take WEEKS to close their positions, so I think you get my groove here. It's hard to think tops and bottoms when you need to buy and enter all over the place - the art of market making(but that's a whole other story).
So when I started struggling with such a problem, all my strategies were basically at their maximum capital capacity. The main symptom was that my entry limit orders were being filled partially all the time.
Since I'm a very thrill guy when it comes down to the strategies I like to have every single step very well written before I start opening positions. Not only entry and exit points but also position sizing are crucial for me.
The solution was to break my position in smaller positions that I called ACU's.
Let's say we have a 10% ACU, that means that each ACU that I buy that is equivalent of 1/10 of the total position size I initially wanted.
The second step was changing my algorithms to things that triggered more often across a zone and not super price and solid signals that trigger only once.
So now I'm buying a little bit here and there, with the goal of having a better final average price.
Another secret factor for success here is being quick on or fingers or if you're tech savvy enough getting an execution bot for you.
Which means you can further break your ACU's across a buying zone.
Let's say your buy-zone goes from 1 to 2, you will spread your ACU close to what I'll explain next.
Imagine something around 10% of 10% of your total position size, yes only 1% of total
Because you will break your ACU in 10 smaller positions across the 1~2 range, similar to this
Buy 10% ACU at 1
Buy 10% ACU at 1.1
Buy 10% ACU at 1.2
...
Buy 10% ACU at 2
I know it sucks and it takes time, but the more you break your position is better and I'll tell you why. BECAUSE IT GUARANTEES YOU THE BEST POSSIBLE ENTRY PRICE.
The price hardly ever go all the way down to the bottom of the range and if does your avg price will be 1.5
But let's work with MOST of the times, that the lowest it goes on your buy-zone is around 1.3-1.7
It will always allow you to catch the best avg entry price, I know some of your limit orders won't be filled but this makes the risk a lot smaller for you, so be patient and master your greed.
This also allows the usage of leverage since operating like this makes you REALLY hard to get liquidated, the tools and the settings I used on Spectro M2 are Xconf on aggressive mode(arrows above/under candles), Spectro Warnings on Moderate(gray warnings), Adaptative Fibonacci Levels( pivot levels) & Scalper Exhaust Reversal Tool(blue background).
Also to make the stop-loss rules clear:
If the price just touched #1 Target - Do nothing
If the price just touched #2 Target - Move up one level
If the price just touched #3 Target - Move up SL to #1 target
If the price just touched #4 Target - Move up SL to #2 target if you think there will be a break-out otherwise close your position
Let me know if you have any doubts!

3X Leverage Locked Stocked & LoadedAMEX:SPXS looking prime...
Buy Box/Orders Layered 21.40 - 22.24
Stops below 20.80
Looking to take profit around $29

scalp eth long, stop already in profit lolI market longed eth at .03745 so once we got above my horizontal here i raised my stop to .03670, dont stop me out lets bounce here real quick on high leverage.

Resistance becomes Support? Or wait for retrace?
We have been in the process of forming this symmetrical triangle for almost 3 months now. Many call it a Bear Pennant but according to traditional pennant rules, it can't be longer than ~ 3 weeks. Though this is crypto, but it should be faster moving if you want to use that argument.
In either case, I have been tracking this downtrend line since Christmas when we got rejected the first time and it held up again, but this time we broke through it and it seems as though we have gone and tested it for support and it held. I closed my long you can see on the chart (little blue arrows) in a good profit at 3815 (It was a leveraged trade. I am taking all my profit in BTC from 2019 onwards). Normally one would wait for a retracement to the 0.382 or 0.5 Fib lines before entering but I am curious to see how this support holds up. We had a relatively long consolidation the month before, so it is possible for the momentum to continue here. But I am still waiting before entering any leveraged positions.
Longs vs. Shorts data has been interesting too. There is a decline in both overall, but the difference between Longs and Shorts have been shrinking in favour of the Short-side.
ibb.co
What that tells me is there are more people closing their longs than shorts. It also suggests that a decent portion of those not closed yet are underwater and could get stopped out or liquidated in another push up. All will be interesting to watch :D


hedge for long positionsWasn't in a btc long, but was in an ethbtc long since .033 and still riding it out, and TRX provides the most bearish set up on bitmex that I could see

UP, UP & AWAYFollow me on twitter twitter.com
Follow me on twitter twitter.com
Follow me on twitter twitter.com
Follow me on twitter twitter.com

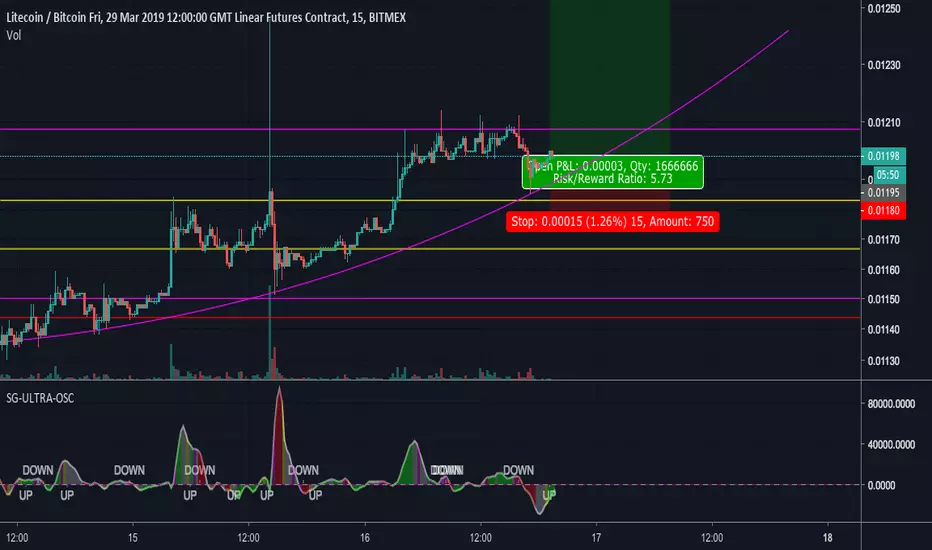
BIG ltc longfingers crossed this thing leads the market for a bullish sunday and makes new highs in this run its on
BTC Bear Trend ContinuationFollowing my previous chart on the apparent ascending triangle, BTC did indeed break to the downside as anticipated.
The triangle's support became resistance with a rejection from the trend line and subsequently seems to be forming a bear flag.
The price action also seems to be respecting the Fibonacci levels. Should this trend continue, then I predict that we will continue to see movement to the downside - further supported by copying the flagpole of the bear flag over, which places a target range meeting the 0.786 Fib.
With continued engulfing selling volume and resistance from the 50 EMA, I believe the downward trajectory towards the highlighted order block remains a likely scenario.


simmer down chikunLTC looks like a decent swing leverage short here petering itself out on lower time frames at resistance


BTC - REVERSAL DIAMOND IS IN - BREAKOUT SOON? - CryptoManiac101BTC / USD TA
Enjoy this one - stop loss is needed for risk minimization - we can't guarantee any movement, we can only 'predict it' in an intelligent way through TA
Exclusive members can refer to your groups for more guidance if needed

Bitcoin looks over leveraged This is likely the ramblings of a clueless idiot but I've watched enough YouTube video's to consider myself an expert on drawing lines in places that might possibly mean something is going to happen at some point in time in the somewhat near future. For the record I'm not a technical trader so I'm not sure why you are even reading this. Don't follow my advise as I rarely do either!
Now that we cleared that up I'm trying to look at longer indicators to get an idea of where the market is. Comparing the long/short ratio trend to where price has trended. I'm concerned to see longs piling up while we are sitting near yearly lows. In the past when longs were this high we had seen a large move up in Bitcoins price. However in this case we are seeing longs piling up just to hold the price in the $3400-$3800 range. While we can certainly move up it doesn't look like we have much gas left in the tank before another move down. A double bottom is possible as it would reduce the over leveraged longs to but this seem less likely to play out in my mind simply because altcoins have moved up nearly 50% since hitting there yearly lows while Bitcoin remains hanging on just above it.
Shorting here seems potentially disastrous and may lead to green wick of destiny melting ones face. Like much of the Cryptoverse I'm simply looking for the right time to add to my stack. I am a hodler of last resort and true believer in the one coin to rule them all. However lately more and more personalities are claiming the bottom is in. Which is reminding me of what happened when BTC got stuck at 6K for several months. The best move is to be patient and not look to deeply into every $100 gyration for answers.

[BCHH19][LONG][10X][138.7% ROE]Trade: LONG BCHH19
Time frame: 4H
Leverage: 10X
Buy: 0.0341 – 0.0351
Targets:
(1) 0.0362
(2) 0.0368
(3) 0.0374
(4) 0.0380
(5) 0.0394
Stop loss: Close 4H candle below 0.0336
Profits Potential: 138.7% ROE
Capital allocation: <10%.
---
Enjoy the trade... & HIT LIKE if you want to see more of these trades!
THE POWER TO WIN
Within, we all have the power to win.
To call on it you need inspiration.
To use it you need to persist.
Within us all, we all have the power to win.
Use it to face any challenge.
Enjoy it to accomplish your dreams.
Within myself…
I HAVE THE POWER TO WIN.
Namaste.

#ETHUSD Long positionI am long #ETHUSD at $114.40 and have more bids stacked at $113. RSI extremely oversold and entering previous demand zone. BTC dump was extremely weak as well. Tight stop loss makes for great R:R

XBTUSD: 4hr Mex Chart. What's next?Been watching this previous block for retests the past couple days, and successfully caught longs and flipped short, now without an open position, watching these light blue levels for new orders. Only the Crypto Gods know what's next, but I'm ready to capitalize either way.

watchChristopherTrade ZEC CFD1:100 LEVEAGE on this one... i see it headed to 72 or so....for every .60 of margin (account balance) used it will gain about 9.00 on each contract bought (.01) using metatrader 4

BTC - AND WHERE IS IT GOING? SHORT? OR LONG?Quick little easy look at the chart. Analysis don't have to be compicated all the times with 10000 indicators and so on.
Sometimes the best thing to do is delete everything on your chart and start with de basics!
We can see a clear ih&s pattern and history on btc teaches us that those patterns are likely to breakout the opposite way. In my opinion thats just because to many retail traders are keeping their eyes on those patterns.
What we often see is a trick from the whales, they break out to the upside to trap the "confirmation traders" and before they can even place their SL on profit they dump it. What do we do? We wait sit back and relax. The moment we see the breakout happening we keep a close eye on our indicator (). When we see exhaustion of the buyers we enter short, and we enter BIG. With a very tight SL incase they decide to follow the rules and reverse the trend. This way you always have the BEST possible R.R ration and in the long run you will find yourself much more profitable.
Let me know what your opinion is about this chart and if you have another view show it in the comments!

XBTUSD: 4hr Mex Chart Possible Short Scalp opportunityLooking at equalish highs at $3898/$3896 with some rather large upper wicks as possible short entry...holding out for $3944 or $4023 for now (though I may jump in sooner if things seem to be losing steam) .
