LTCUSD Resistance retest, The Week Ahead 24 Feb ‘25The LTCUSD price action sentiment appears neutral, supported by the longer-term sideways trading range.
The key trading level is at 1,209, 17th Feb swing low level. An overbought pullback from the current levels and a bearish rejection from the 1,209 level could target the downside support at 1,082 followed by the 1,000 level over the longer timeframe.
Alternatively, a confirmed breakout above 1,395 resistance and a daily close above that level would negate the bearish outlook, opening the way for further rallies higher and a retest of 1,523 resistance followed by 1,709 levels.
This communication is for informational purposes only and should not be viewed as any form of recommendation as to a particular course of action or as investment advice. It is not intended as an offer or solicitation for the purchase or sale of any financial instrument or as an official confirmation of any transaction. Opinions, estimates and assumptions expressed herein are made as of the date of this communication and are subject to change without notice. This communication has been prepared based upon information, including market prices, data and other information, believed to be reliable; however, Trade Nation does not warrant its completeness or accuracy. All market prices and market data contained in or attached to this communication are indicative and subject to change without notice.
Lightcoin

Long lightcoin-tetherus-we have a 4 hour timeframe uptrend since the (10th November)
-on the 15 min time frame a downtrend has been broken after testing the major timeframe trendline
-if it breaks above the 62.28 resistance of the previous high, which we had before the breakout of the trend line, and retests in on the 5min time frame and holds and breaks a 5 min pattern on the long side, i will open a long position.

PA$HMAT IILTC is holding its diagonal long-term Channel and is currently sitting on the midline of this channel.
In the past, we have seen how BTC dominance has shown weakness and brought a lot of momentum to LTC.
LTC is now at a point of another bullish swing to its BTC pair. This will be a swing to the following resistance labeled as R1.
LTC Historical swings since July 8th,2020 ...
Nov 2, 2021
Sep 2, 2021
Feb 15, 2021
Jan 24, 2021
Dec 7, 2020
Oct 7, 2020
Jul 8, 2020

LTC near long term support#LTCUSDT
$LTC is near a long term support zone and a weekly ascending support.
this area is the same with 0.786 fib level of last swing high.
so I think it is possible that #LTC drop a little more to touch this zone of strong support, then can start another swing high to 1.414 fob level around $270.
my long term view is still cup & handle for $LTC.

LTC cup and handle#LTCUSDT
weekly chart of $LTC shows to me a cup and handle pattern, that if it is going to complete, the target that gives me is around $500, which is the same as target of AB=CD pattern that I shared before.

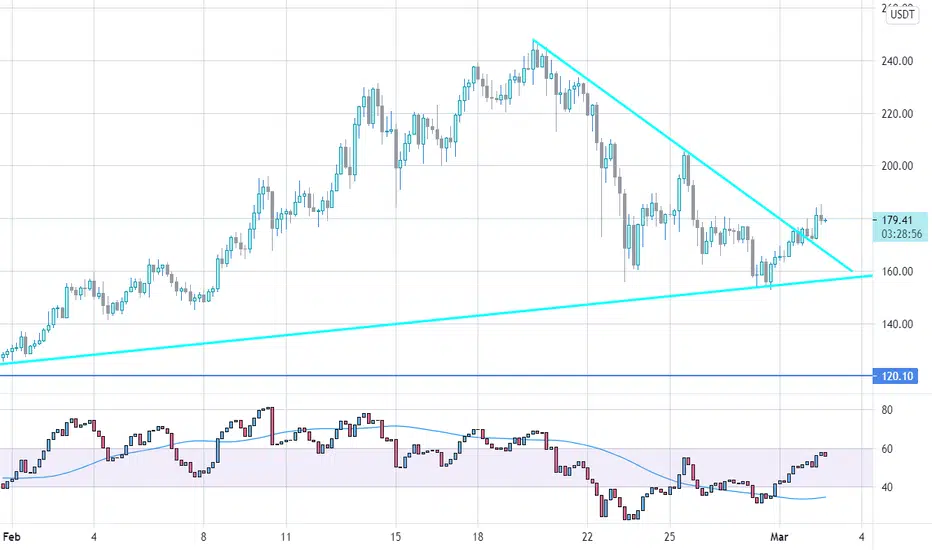
LTC triangle#LTCUSDT
we can draw a triangle for $LTC price , that now is near the upper line.
A rejection from the upper line of this triangle will drop the price to around $170, here around this price there is a strong support but it touched 4 times till now , which made it weak, and this drop may continue more.
but a break above the upper line of triangle will pump #LTC price to $190 and even $210

LTC double top#LTCUSDT
$LTC broke down the ascending support line, the nearest support is a zone between $166 and $161, that will go to touch in coming hours.
As I see a double top pattern that shows the correction or down trend will continue to the next support zone, which is the same price of 0.5 and 0.618 fib levels.


LTC head and shoulders#LTCUSDT
It seems to me that $LTC is going to shape a Head and Shoulders pattern in long term.
and now we can see a parallel channel that price is bellow middle line of this channel, a short term down trend with low momentum can happen between $114 and $121.
after that price can go up to touch upper line of parallel channel.

LTC inside wedge#LTCUSDT
$LTC is trading inside a wedge, that can reverse the trend. wait for break out from this pattern.
Support zone is between $104 and $115 that may liquid (or hit SL) long orders with a shadow.

LTC near strong resistance#LTCUSDT
as you can see $LTC is near 2 resistances, a 4h candle close above this zone can make it reach $155 that is near a long term ascending resistance


Lightcoin doing a dive LTCUSDAgain, I believe 5th wave is done and dusted and now we are drawing zigzags. That means we can goal it at where this thing might eventually land in a week or so. Fib time is less precise. Anyway, Fibgoals in green dashed, invalidation in red. This is not financial advice. Be safe out there.

potential reversal signal on LTClooks like a hummer bottom reversal and MASD is at an oversold level.
I am LONG and wrong, so I see bullish signals everywhere. Time will tell.


LTCBTC broke out long term resistance#LTCBTC price broke out long term resistance and after pullback we can expect a massive increase

ltc daily analysLightcoin will move towards higher goals after defeating its resistance and stabilizing it high.

LTCUSDT broke out resistance#LTCUSDT
$LTC broke out resistance and now try to confirm it as support. we will see $330 in coming days🚀

LTC/BTC Buy Opportunity 1 WHi Guys we are in possible buy range for LTC/BTC on Weekly chart, please do your own research and this is my opinion only not financial advice
LTC/BTC Buy Opportunity 1 W. Buy at the bottom wait and then sell at the top you can even 400% 500% your BTC thanks to LTC
All the best and happy trading !

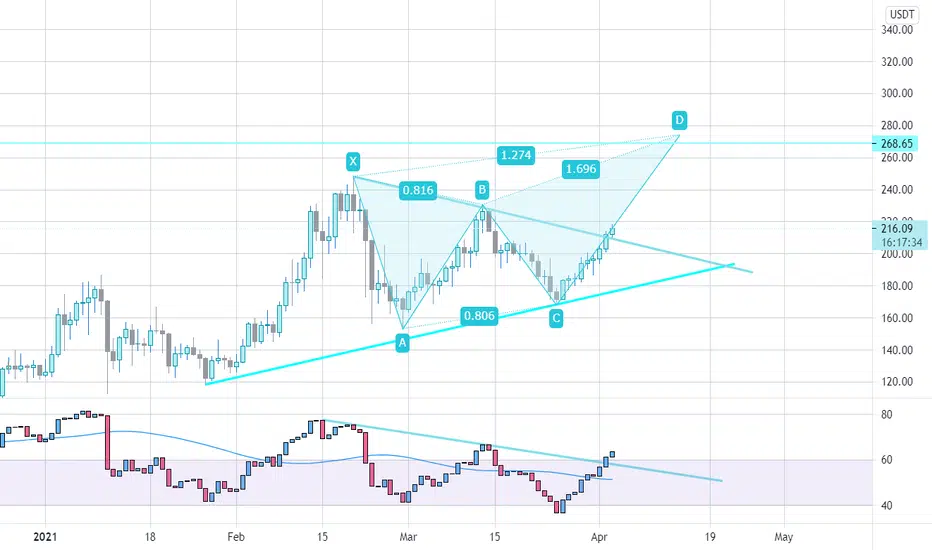
LTCUSDT butterfly pattern#LTCUSDT
$LTC can complete Butterfly Pattern. that price will reach at least $260 - $280.
LTC Getting Ready For a Breakout! Prepare Your EntriesIn this technical analysis I share my current views on LTC/USD. I tried to make the chart as self-explanatory as possible, but feel free to reach out or drop a comment if you have any questions.
