BTC's Logarithmic TL vs. Linear TL: Vote Now!Primary Chart: BTC's Logarithmic Trendline from the All-Time High to the Present Date
BTCUSD's current down trendline reflecting the primary trend can be drawn on either a logarithmic or linear chart. Both charts are used in technical analysis. Logarithmic charts tend to be better at conveying accurate proportions of price action on charts covering a lengthy period of time and a broad span of price action.
In the case of BTC, why does it matter? Look at the down trendline drawn on a linear chart (Supplementary Chart below) connecting the same all-time high in November 2021 and the March 28-April 5, 2022 peaks. Notice the breakout?
Supplementary Chart: BTC's Linear Trendline from the All-Time High to Present Date
Other evidence suggests that the downtrend is not over yet and new lows are likely. But the choppy and trap-filled price action since June 2022 has made it difficult for any directional traders long or short.
Care to vote in the comments? It's probably true that each vote reflects the conclusions each of us has reached, and our general market expectations. My vote is that the logarithmic chart is the better TL. But my posts have remained fairly bearish this year, so this may reflect my underlying expectation that no new uptrend is being established in crypto assets despite any sharp bear rallies in the near term.
Here are some of the technical reasons (in prior posts linked below) for remaining bearish. But for each of these reasons, there may be other keen technical or fundamental arguments being made for why the lows are very near.
Bearish arguments in prior posts:
Have a great trading week!
________________________________________
Author's Comment: Thank you for reviewing this post and considering its charts and analysis. The author welcomes comments, discussion and debate (respectfully presented) in the comment section. Shared charts are especially helpful to support any opposing or alternative view. This article is intended to present an unbiased, technical view of the security or tradable risk asset discussed.
Please note further that this technical-analysis viewpoint is short-term in nature. This is not a trade recommendation but a technical-analysis overview and commentary with levels to watch for the near term. This technical-analysis viewpoint could change at a moment's notice should price move beyond a level of invalidation. Further, proper risk-management techniques are vital to trading success. And countertrend or mean-reversion trading, e.g., trading a rally in a bear market, is lower probability and is tricky and challenging even for the most experienced traders.
DISCLAIMER: This post contains commentary published solely for educational and informational purposes. This post's content (and any content available through links in this post) and its views do not constitute financial advice or an investment or trading recommendation, and they do not account for readers' personal financial circumstances, or their investing or trading objectives, time frame, and risk tolerance. Readers should perform their own due diligence, and consult a qualified financial adviser or other investment / financial professional before entering any trade, investment or other transaction.
Linear

LINA a good situation for spotLinear is a decentralized delta-one asset protocol capable of instantly creating synthetic assets with unlimited liquidity. The project opens traditional assets like commodities , forex, market indices and other thematic sectors to cryptocurrency users by supporting the creation of “Liquids” — Linear’s synthetic asset tokens.
The protocol consists of various products like Linear.Buildr, a DApp used to manage Liquids using Linear (LINA) and other tokens as collateral. The exchange is specifically created to enable trading of a variety of Liquids with rapid confirmation times and robust security.
LINA is an ERC-20 token built on the Ethereum network whose main purpose is as collateral for Liquids (using Buildr) and for community governance of the protocol. All token holders have access to the Linear DAO, enabling them to vote on different initiatives and proposals, helping to shape the development of the Linear ecosystem.
The main goal of Linear is to provide a superior user experience with better scalability and greater speed thanks to the cross-chain capabilities of the protocol. Linear Finance intends to provide a simple solution for users that want exposure to traditional assets while still benefiting from the features enabled only by blockchain technology.
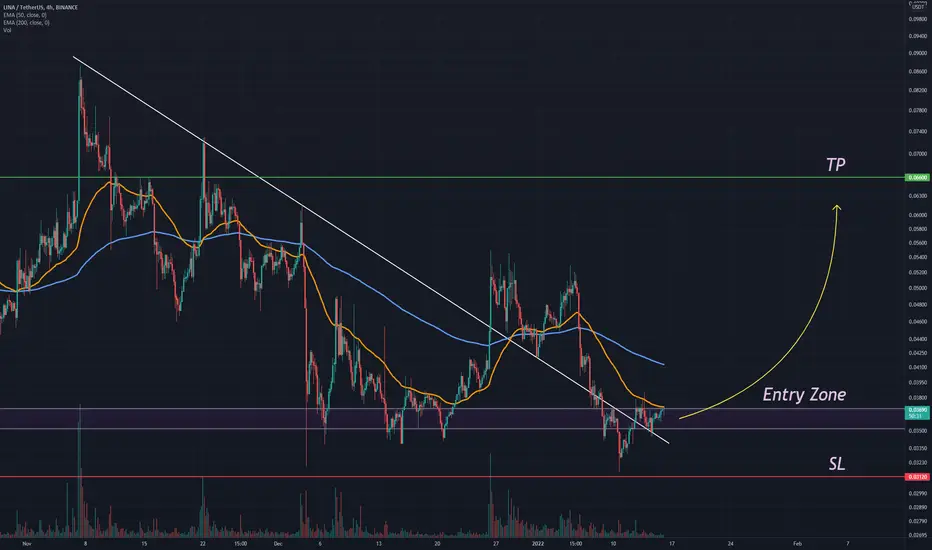
Buy setup
Entry : 0.0064 - 0.00775
SL : 0.0055
TP1: 0.008
TP2: 0.0083
TP3: 0.0086
TP4: 0.009
TP5: 0.0095
TP6: 0.0105
TP7: 0.0115
TP8: 0.013
TP9: 0.015
TP10: 0.0175
TP11: 0.02
TP12: 0.024
TP13: 0.028
TP14: 0.0342
Spot
Run and keep it enjoy
Follow me! Copy my trades :)


Heavy resistance at 0.012c - expect a short term reset to 0.0083I saw heavy sell orders in Binance around 0.012 mark. Though the sell orders aren't that massive - around 50 million LINA
BTC, SPX RSI shows overbought conditions, a correction is due, this will reset LINA too.
Though RSI shows bottoming process in LINA, the Huobi one is most accurate, because it was listed first over there. Actual price of LINA was 0.001 during listing but we went to
0.021 on listing day then 0.005, this isn't listed anywhere on TradingView.
The supply was three to four times less around 2021 Q1. at 40 M market cap we were around 0.04 price range, now at 40M cap we are around 0.01.
APY fluctuated between 80% at 0.10 and 160% at 0.005, now it is 95% at 0.001, which is still good fundamentally.

BTC my chart of the month and where i look for resistanceChart is self explanatory. just a possibility. this chart uses monthly camarilla pivots and CPR. linear regression. custom oscillation. maybe find resistance around here up to H3. and if we do... maybe new lows at L3. all of this invalidated above H4

EUR/USD on long positionseems eur/usd has made a double pattern and expected to start an upward trend

Linearized Bitcoin Chart (10th Root) + SupportsBTCUSD^0.1 provides a linearized view of it's price, which allows for a Fib Channel placement.
Confluence of support at 15k level (200W SMA + 2019 peak)

🆓Linear (LINA) May-30 #LINA $LINA
LINA has just conquered the $0.009 zone and it is moving towards the $0.011 zone, we can accumulate LINA as close to the $0.009 zone as possible because in the near future it can increase strongly to the $0.016 zone. However, if it loses the $0.009 zone again, we will consider buying it back at $0.0075 and $0.006.
📈RED PLAN
♻️Condition : If 1-Day closes ABOVE 0.009$ zone
🔴Buy : 0.009
🔴Sell : 0.011 - 0.013 - 0.016
📉BLUE PLAN
♻️Condition : If 1-Day closes BELOW 0.009$ zone
🔵Sell : 0.009
🔵Buy : 0.0075 - 0.006
❓Details
📈Red Arrow : Main Direction as RED PLAN
📉Blue Arrow : Back-Up Direction as BLUE PLAN
🟩Green zone : Support zone as BUY section
🟥Red zone : Resistance zone as SELL section

GBPUSD sell idea using Linear Regression Channel and Pivot PointThe GBPUSD is currently in a downward trend and looks like it may go bearish in the near future. In this analysis we are using the Linear Regression Channel and the Pivot Points, as well as the Stochastic RSI and the ADX indicator. Traders should keep an eye on this currency pair and be prepared to take action accordingly.
Our profit target is 1.183, more than 400 Pips down from the current price.

$LINA/BTC 12h (#BinanceSpot) Descending trendline break & retestLinear Finance is pulling back to 50MA & 200MA support which just made a golden cross, looks ready to bounce back!
Current Price= 0.00000058
Buy Entry= 0.00000059 - 0.00000055
Take Profit= 0.00000068 | 0.00000076 | 0.00000087
Stop Loss= 0.00000048
Risk/Reward= 1:1.22 | 1:2.11 | 1:3.33
Expected Profit= +19.30% | +33.33% | +52.63%
Possible Loss= -15.79%
Fib. Retracement= 0.5 | 0.786 | 1.117
Margin Leverage= 1x
Estimated Gain-time= 5 weeks
Tags: #LINA #LINABTC #Linear #Yield #Farming #DAO #DEx #DeFi #BSC #DotEco
Website: linear.finance
Contracts:
#ERC20 0x3e9bc21c9b189c09df3ef1b824798658d5011937
#BEP20 0x762539b45a1dcce3d36d080f74d1aed37844b878

EURUSD Sell Idea using Linear Regression and Fibonacci LevelsWe think EURUSD is headed down. This signal is based on the Linear Regression Channel and the Fibonacci Levels. Also the SRS Pro is showing a drop on the 4H timeframe, and can go down to 1.05119. Please Like us and subscribe for more ideas like this!

BTC Bouncing Off Major Swing Low Linear LogoBTC Bouncing Off Major Swing Low Linear Logorithmic swing-low trend line.

Solstad Offshores Linear + Support and Resistance LevelsSolstad Offshores Linear + Support and Resistance Levels shown. Maybe this is the way? Bulls have control of 65%, while bears only 35%.

Lina ; break out trend line bearishI like lina and i think it will be successfull project and it potential up to $1 in long_term
For now it success break line and it will move toward 0.03 and then 0.045

Linear vs Tether Will Also Grow (125%+ Possible)The USDT pair for Linear (LINAUSDT) is also bullish and can easily grow 125%+ short-term.
We have a falling wedge pattern;
High volume;
Bullish MACD & RSI;
With prices moving above EMA50...
All these signals point to additional growth.
This is not financial advice.
The target and stop-loss can be found on the chart.
Namaste.

Linear Can Do 80% EasyWe can see a high volume breakout taking place for LINABTC (Linear).
Additional grow can easily happen... This is only getting started.
Namaste.

LINA Linear Finance EXPECTED MOVES LINABTC LINAUSDT LINAUSDLINA Linear Finance EXPECTED MOVES LINABTC LINAUSDT LINAUSD

Linear (LINA) Buy ZoneLinear (LINA) Buy Zone
--------------------
BIAS
Short-Term : Bullish
Long-Term : Neutral
Risk : Medium
With the bigger picture remaining neutral, the shorter time frame picture has become for the bullish. On 4 hours time frame, Linear has broken above neckline of reverse head and shoulder, meaning that we could see a retest as lower entry before a solid short term bounce.
--------------------
$LINA/USDT LONG SETUP
Leverage : x3 - x5
Entry Price : 0.025 - 0.02325
TP 1 : 0.026
TP 2 : 0.0275
TP 3 : 0.02965
TP 4 : 0.03385
TP 5 : 0.03755
TP 6 : 0.0405
TP 7 : 0.0442
TP 8 : 0.05025
Stop Loss : 0.021
*Maximum 3% of Portfolio.
*Unload 12.5% at each TP. Whenever TP 2 hits, Move stop loss to entry.
--------------------

BTC heading to an inevitable ~30,000k markBitcoin is heading down towards an inevitable ~30,000k mark in correlation with July 2021 mark.
Triangle pattern, Linear Regression and Fibonacci.
Long term shorts will be profitable
Traders should prepare long trades to trigger at sub ~30k marks.

Lina, Whales Accumulation and Fakeout📈The chart is self explanatory
📈Lina is being traded inside this Triangle on the Daily chart.
📈Whales Accumulation and Fakeouts
📈The price will fly according to the chart and technical analysis
☑️ Long, Long, Long, Long 400% on the long Run.

Linear (LINA) Buy ZoneLinear (LINA) Buy Zone
--------------------
BIAS
Mid-Term : Bullish
Risk : Medium
Neutral outlook for the day after breaking trendline above our $0.0358 zone. There is no short predominant direction with Linear market conditions are just choppy at the moment.
--------------------
$LINA/USDT LONG SETUP
Leverage : x3 - x5
Entry Price : 0.03515 - 0.037
TP 1 : 0.0384
TP 2 : 0.0399
TP 3 : 0.0419
TP 4 : 0.0453
TP 5 : 0.04815
TP 6 : 0.0515
TP 7 : 0.05715
TP 8 : 0.066
Stop Loss : 0.0312
*Maximum 3% of Portfolio.
*Unload 12.5% at each TP. Whenever TP 2 hits, Move stop loss to entry.
--------------------
Lina, the sleeping Monster. the chart is self explanatory and the sky is clear . Linausdt is about to achieve 250 % gains . predicted to test the trendline at 0.1 -0.15 which is 250 % of the price floor level now .
Risk : Medium ( but up to 10k usdt )
#Dyor #NFA

USDCAD shortThe main level is broken and retested.
LR channel is broken too.
The yellow ascending line is broken.
So, enter short position by touching the entry point or around the S & R level.
Take profits at levels.
Have fun.
