Waiting For The Price Action📊 Chainlink is hovering near the $21 support area, which has historically been a strong level for price reaction.
🟢 If this zone holds, it could pave the way for a move toward $25 and potentially $27.
👉🏼 Monitoring price action around $21 can provide insights into the next direction.
⚠️ Trading involves risk; assess carefully before taking action.
LINK

#LINK/USDT Ready to go higher#LINK
The price is moving in a descending channel on the 1-hour frame and sticking to it well
We have a bounce from the lower limit of the descending channel, this support is at 21.45
We have a downtrend on the RSI indicator that is about to be broken, which supports the rise
We have a trend to stabilize above the 100 moving average
Entry price 23.25
First target 24.12
Second target 25.53
Third target 27.12

Chainlink (LINK) Cup & Handle BULLISH!Chainlink (LINK) has formed a Cup & Handle pattern with a bullish scenario. The breakout has formed a bullish trend for the bulls creating pressure to push the price to the upside. In addition, the bears have pulled the price back down towards the neckline which acts as a previous Upper Resistance line.
Bid Zone= $19.27 - $22.87
Expect price to continue to the upside with followed buying momentum from the bulls. After this pullback, Chainlink will now retest previous "All-Time High" dated back from 2021.
Target= $52.28

good purchaseThe link is a good project for investment. Of course, the right point of purchase is very important

LINK --- projecting out this year... $63 Next set of targets for LINK
not hard to predict Chainlink will keep trending up --- we're in a Bull after all
The hardwork by investors, was completed in the year and half sideway accumulation zone under $10
now what ...
not much
sit on your hands
and rotate shitcoin profits into it ... (if LINK is core component of your portfolio of course)
At some you will have to decide when you to start selling your LINK for USD ... it won't be easy

PYTHUSDT - Rounding bottom patternBINANCE:PYTHUSDT stands out as a strong investment opportunity, often considered an improved version of $LINK.
While sharing similarities with LINK, it surpasses it in certain key areas. Being a new project with low market saturation, it offers significant potential for growth ✅️
The med-term targets are outlined in the chart.
Accumulation is recommended now up to 0.236 fibo level .
Best regards Ceciliones🎯

These Top 30 AltCoins have GOOD setups against BTC The Analysis of Benjamin Cowen
Benjamin Cowen , a well-known cryptocurrency analyst, has pointed out that many cryptocurrencies that exhibit a double bottom against Bitcoin ( CRYPTOCAP:BTC ) have experienced HIGH price increases, we have examples like CRYPTOCAP:SOL ($225.05 - 211.31% return (1y)) in the middle of 2023 when it did a double bottom against CRYPTOCAP:BTC and recently with CRYPTOCAP:XRP ($2.62 - 323.88% return (1y)) in early November, both outperforming BTC ($106,726.68 - 155.86% return (1y)) this year.
Source vid: The EXACT Date You Should Go ALL IN on Altcoins! at 42:00
BTC Dominance
When BTC's dominance rises relative to other cryptocurrencies, ppl often shift into BTC in search of stability, aiming to capture the secure upside that altcoins may not provide. During this period of increasing BTC dominance, altcoins can bleed or just go sidewaves while BTC goes up, meaning their value decreases in relation to BTC. But, these altcoins I'm gonna show you seem to have double bottomed against their BTC pair and it might be the start of a huge upside in the USD pair too.
Double Bottom Pattern
The double bottom pattern indicates that selling pressure has bottomed out and can signal a bullish move. Recognizing this pattern in the context of BTC dominance offers a valuable setup and great expectations for price since it tends to follow an upside movement.
So🤔¿Are you wondering which AltCoins have a similar setup? 👀
I just wanted to point out coins in the Top 30, while all crypto market implies risk, the ones in this top 30 have high marketcap and are well known projects so you're kinda in safer.
Chainlink ( CRYPTOCAP:LINK )
Avalanche ( CRYPTOCAP:AVAX )
AAVE ( CRYPTOCAP:AAVE )
DOGE ( CRYPTOCAP:DOGE ) Doge is already on the move but it has the checkbox, could go higher in this pair
Which ones are on the way to get this setup?
CRYPTOCAP:NEAR AMEX:APT CRYPTOCAP:DOT CRYPTOCAP:ADA - All these 4 are on the way to get it, but remember it's just a good setup IT DOES NOT MEAN they're not gonna go up in the altseason cuz they're probably still gonna do it since they're really big L1's. One thing for sure that has been talked about it's the concern that we had like a mini altseason and ofc we can't say for sure it's coming the big one, but BTC 4 year cycles has repeated till this date so it might come anyway.
That's it for the post, these are the top 30 altcoins that could outperform BTC from now, thank you for your time and remember DYOR (Do your own research)

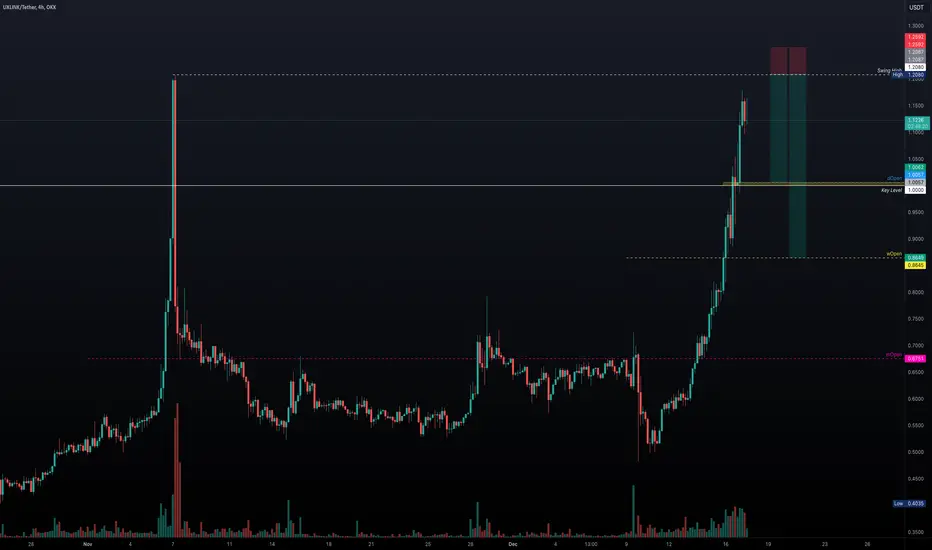
UXLINK - Is a Reversal Imminent? SHORT SETUPUXLINK has seen impressive gains over the past 7 days, rising +140% and approaching the swing high at $1.208. This price action suggests the possibility of a correction, providing an attractive short opportunity if it faces rejection at these levels.
Key Observations:
Recent Bullish Momentum: UXLINK has been on a 7-day bullish run, rising significantly, which increases the likelihood of a short-term pullback or correction.
Swing High at $1.208: As UXLINK nears the swing high at $1.208, this could act as a potential rejection point. A rejection here could provide an excellent shorting opportunity.
Riskier Trade: If you prefer a more aggressive position, a short could be taken now, targeting the swing high with a laddered approach towards that level.
Possible Correction Ahead: With 7 consecutive bullish days, a correction is likely in the near future. The dOpen at $1 serves as a strong support level to target for a short.
Break Below $1: If UXLINK breaks below the $1 level, the next target becomes the wOpen at $0.8645.
Reward-to-Risk Potential:
Target 1: $1 (dOpen) offers a 4:1 risk-to-reward, with a potential 16.45% gain.
Target 2: $0.8645 (wOpen) offers a 7:1 risk-to-reward, with a possible +28.5% gain.
Elliot Wave Count: According to Elliot wave theory, UXLINK is approaching the completion of its 5-wave structure, which may further indicate that the upward trend is nearing exhaustion.
Summary:
Bullish run over the past 7 days makes UXLINK susceptible to a correction.
Swing high at $1.208 could provide an ideal short opportunity, with strong targets at $1 and $0.8645.
Reward-to-risk ratios are favorable, offering 4:1 or even 7:1 if the trade is executed properly.
Elliot Wave suggests the end of the current upward movement, further supporting the case for a potential short.
Weakness Prevails Below Key LevelsChainlink continues to show bearish momentum after losing key support levels.
Key Observations:
dVAL and pdVAL Lost – LINK has dropped below the daily value area low (dVAL) and remains weak with no significant new volume coming in, indicating a lack of buying interest.
Swing Low Taken Out – LINK has taken out the swing low at $28, but the volume remains low, showing weak follow-through and limited buying activity.
pdVAL and pdPoC Resistance – The previous daily value area low (pdVAL) and the previous daily point of control (pdPoC) are both situated at $29, now acting as a strong resistance level. Bulls must reclaim this area to regain strength.
Lack of Bullish Defense – Bulls are failing to defend key levels, further signaling weakness.
Below Key Levels – LINK remains below the weekly open (wOpen) and the daily open (dOpen), confirming a bearish bias.
Target Levels:
Bearish Targets:
pwOpen (previous weekly open) coincides with the daily level at 26.09, making this a significant confluence area for potential support.
The 0.5 Fibonacci retracement at 25.61 strengthens this zone as a next key downside target.
Next Major Zone: The green support area below 26.09 remains a potential demand zone if selling pressure persists.
Summary:
With LINK taking out the swing low at $28 on low volume, remaining below dVAL, pdVAL, dOpen, and wOpen, the bearish momentum remains intact. The pdVAL and pdPoC at $29 now serve as strong resistance. The next major downside target lies at 26.09, where confluence with the pwOpen and daily level strengthens the support zone.

LINKing Up or Breaking Down: $26.70 to Watch.Unable to break through $30.93, Chainlink declined to below $28.70. We have to watch the price action around this level.
1. We need to see a strong recovery to above $28.70 support level that could signal a continuation of the bullish momentum, potentially driving LINK to retest $30.93 and move higher toward the next resistance at $34.58. Such a scenario would underscore the presence of strong buying interest (Green Projections).
2. On the downside, a failure to maintain $28.70 could expose LINK to further weakness, with a possible decline toward the critical support at $24.49 in 4-Hour Chart.

LINK - Losing Momentum: Key Breakdown Levels to WatchThe chart structure shows a rising wedge pattern, a bearish formation that signals exhaustion in the current uptrend. This pattern, combined with price action stalling at the highs, indicates that the bulls are losing momentum.
Key Observations:
1.) Rising Wedge Breakdown Potential:
The price action is forming lower highs and higher lows, aligning with the typical characteristics of a rising wedge.
A decisive break below pdVAL (Previous Day Value Area Low) at $28.99 would confirm the bearish momentum.
2.) Bearish Targets:
If pdVAL fails as support, we could see a correction towards key confluence zones:
First Target: $26.75 — This level aligns with the 0.5 Fibonacci retracement of the entire upward wave and coincides with previous price structure support.
Second Target: $26.09 — This level is marked by the pwOpen (Previous Week Open), providing additional support.
3.) Volume Profile:
The recent upward move lacked increasing volume, which reinforces the exhaustion narrative. A volume spike on the breakdown would further validate the bearish case.
4.) Support Zones:
The key green zone (highlighted) between $26.75 and $26.09 is a strong area of demand, supported by:
0.5 Fibonacci retracement.
Previous Weekly Open (pwOpen) and Previous Weekly Value Area Low (pwVAL).
Conclusion:
Bearish Scenario: A confirmed breakdown of pdVAL ($28.99) could trigger a move towards $26.75, with potential continuation to $26.09.
Invalidation: A strong reclaim of pdVAL and a push above the rising wedge's resistance would invalidate the bearish outlook.

LINK | ALTCOINS | Chainlink pushes towards 40$Link has seen some great increases after another bump on BTC.
It's likely that this will lead to another mini-cycle, and push the price of Chainlink even higher towards 40$ which is the next major resistance mark.
I'm especially optimistic for Link and other alts once Ethereum has made a new ATH. More on that thought here:
_____________________
BINANCE:LINKUSDT

Chainlink's Bullish Surge: A Potential Rally on the HorizonChainlink (LINK), the leading decentralized oracle network, has been making significant strides in the cryptocurrency market, captivating the attention of investors and analysts alike. The token's price has surged to a multi-year high, surpassing the $30 mark, as hopes for a substantial 80+% rally continue to gain momentum.
The Driving Forces Behind Chainlink's Rally
Several key factors have contributed to Chainlink's bullish momentum:
1. Increased Institutional Adoption:
o A growing number of institutional investors and financial institutions are recognizing the value of Chainlink's decentralized oracle network.
o This increased adoption has led to a surge in demand for LINK tokens, driving up the price.
2. Expanding Ecosystem:
o Chainlink's ecosystem continues to expand rapidly, with new projects and dApps integrating the oracle network.
o This growing ecosystem strengthens Chainlink's position as a critical infrastructure for the blockchain industry.
3. Positive Market Sentiment:
o The broader cryptocurrency market has been experiencing a period of positive sentiment, with many tokens seeing significant price gains.
o Chainlink has benefited from this overall market optimism, as investors seek out high-potential projects.
4. Technical Analysis:
o Technical analysts have identified bullish patterns on Chainlink's price charts, suggesting that the token could continue its upward trend.
o Key technical indicators, such as the Relative Strength Index (RSI) and Moving Averages, are signaling strong buying pressure.
The Potential for an 80+% Rally
While the cryptocurrency market is inherently volatile, many analysts believe that Chainlink has the potential to experience a significant price surge of up to 80+% from its current levels. This bullish outlook is based on several factors:
• Strong Fundamentals: Chainlink's robust technology, growing ecosystem, and increasing institutional adoption provide a solid foundation for future growth.
• Market Sentiment: The overall positive sentiment in the cryptocurrency market can further fuel Chainlink's rally.
• Technical Analysis: Bullish technical indicators suggest that Chainlink's price could continue to climb.
Cautious Optimism and Risk Management
While the potential for a substantial price increase is exciting, it's important to approach the cryptocurrency market with caution and practice sound risk management. Here are some key considerations for investors:
• Diversification: Diversifying your investment portfolio across various cryptocurrencies and other asset classes can help mitigate risk.
• Dollar-Cost Averaging (DCA): Investing a fixed amount of money in Chainlink at regular intervals can reduce the impact of market volatility.
• Risk Tolerance: Assess your risk tolerance and only invest an amount that you can afford to lose.
• Stay Informed: Keep up-to-date with the latest news and developments in the cryptocurrency market, especially regarding Chainlink.
In conclusion, Chainlink's recent price surge and the potential for an 80+% rally have generated significant excitement among investors. While the future of the cryptocurrency market is uncertain, Chainlink's strong fundamentals and growing adoption position it as a promising investment opportunity. However, it's crucial to conduct thorough research, exercise caution, and implement sound risk management strategies.

#LINK/USDT Ready to go higher#LINK
The price is moving in a descending channel on the 1-hour frame and sticking to it well
We have a bounce from the lower limit of the descending channel, this support is at 28.14
We have a downtrend on the RSI indicator that is about to be broken, which supports the rise
We have a trend to stabilize above the moving average 100
Entry price 29.00
First target 30.30
Second target 31.80
Third target 33.50

Chainlink LINK/USDT: SHORT, Bearish Divergence Detected.Leveraging our Adapted RSI w/ Regime Detection we can easily identify this bearish divergence alongside the weekly rsi signal suggesting Sell.
Whilst higher timeframe orderflow is still bullish upon retest of $22-$23 - I would keep a close eye on intraday order flow heading into early this week as we have important economic data, notably BOJ policy rates decision later in the week, which implies increased volatility and likely, manipulation.

Chainlink Poised for a 20% Upswing This Weekend?
Chainlink (LINK), the leading decentralized oracle network, has been on a remarkable run in recent weeks. The cryptocurrency has outperformed the broader market, surging by over 22% in the past month. This impressive performance has sparked renewed interest in LINK, with many investors wondering if the token can reach new heights in the coming months.
What’s Behind Chainlink’s Strong Performance?
Several factors have contributed to Chainlink’s recent surge. Firstly, the increasing adoption of decentralized finance (DeFi) protocols has created a growing demand for reliable and secure oracle networks. Chainlink, with its robust infrastructure and proven track record, has emerged as the go-to solution for many DeFi projects.
Secondly, the rise of Web3 and the metaverse has also fueled demand for Chainlink’s services. As more and more applications are built on blockchain technology, the need for real-world data feeds becomes increasingly critical. Chainlink’s ability to provide accurate and timely data from off-chain sources has made it an indispensable tool for Web3 developers.
Finally, the overall bullish sentiment in the cryptocurrency market has also positively impacted Chainlink’s price. As Bitcoin and other major cryptocurrencies continue to rally, investors are looking for alternative investment opportunities, and Chainlink has emerged as a promising contender.
Will LINK Price Reach $50 in 2024?
While it’s difficult to predict the exact price of any cryptocurrency, many analysts believe that Chainlink has the potential to reach $50 in 2024. However, several factors will determine whether this target can be achieved.
First, the continued growth of the DeFi and Web3 ecosystems will be crucial. As more and more projects adopt Chainlink, the demand for the token will increase, driving its price higher.
Second, the overall market sentiment will play a significant role. If the broader cryptocurrency market remains bullish, Chainlink is likely to benefit from the positive sentiment. However, a market downturn could negatively impact the token’s price.
Third, Chainlink’s technical performance will be important. The network needs to maintain high uptime and low latency to ensure the reliability of its services. Any technical issues or security breaches could damage the token’s reputation and negatively impact its price.
Chainlink’s Technical Outlook
From a technical perspective, Chainlink appears to be in a strong uptrend. The token has broken above several key resistance levels, and the momentum indicators suggest that the bullish trend is likely to continue. However, it’s important to note that the cryptocurrency market is highly volatile, and prices can fluctuate rapidly.
Conclusion
Chainlink’s recent performance has been impressive, and the token has the potential to reach new heights in the coming months. However, investors should approach the cryptocurrency market with caution and be prepared for potential volatility. It’s important to conduct thorough research and only invest what you can afford to lose.
As always, it’s crucial to stay updated on the latest news and developments in the cryptocurrency market. By understanding the factors that drive Chainlink’s price, investors can make informed decisions and maximize their returns.

LINK Leap to 2021 Heights: Trump's World Liberty Fuels the Rally
Chainlink (LINK), the decentralized oracle network, has experienced a significant price surge, reaching levels not seen since 2021. This bullish momentum has been fueled by a combination of factors, including increased institutional adoption and a recent purchase by a notable entity.
A Bullish Surge
LINK's price has rallied to the $30 mark, a level that has not been breached in several years. This substantial price increase can be attributed to several key factors:
1. Institutional Adoption: Chainlink has gained significant traction among institutional investors and financial institutions. Its role in providing real-world data to smart contracts has made it a crucial component of various blockchain-based applications.
2. Growing DeFi Ecosystem: The decentralized finance (DeFi) sector continues to expand rapidly, and Chainlink plays a vital role in powering many DeFi applications. As more DeFi projects emerge, the demand for Chainlink's oracle services is expected to increase.
3. Strategic Partnerships: Chainlink has forged strategic partnerships with major players in the blockchain industry, further solidifying its position as a leading decentralized oracle network.
4. Positive Market Sentiment: The broader cryptocurrency market has been experiencing a period of bullish sentiment, with many digital assets witnessing significant price gains. This positive market mood has also benefited Chainlink.
Trump's World Liberty Adds to the Momentum
A recent development that has further fueled LINK's rally is the acquisition of Chainlink tokens by a prominent entity associated with a former US president. This move has sparked significant interest and speculation within the crypto community.
While the specific details of this purchase remain undisclosed, it highlights the growing appeal of Chainlink to high-profile investors. Such institutional investments can have a substantial impact on a cryptocurrency's price and market capitalization.
The Future of Chainlink
As Chainlink continues to innovate and expand its ecosystem, its potential for future growth remains promising. However, it is important to note that the cryptocurrency market is inherently volatile, and prices can fluctuate significantly.
Investors should conduct thorough research and consider their risk tolerance before investing in LINK or any other cryptocurrency. Diversification is also crucial to manage risk effectively.
While the recent price surge is undoubtedly exciting, it's essential to maintain a realistic perspective. Chainlink's long-term success will depend on its ability to deliver reliable and secure oracle services, adapt to evolving technological trends, and attract a wider range of users and developers.
As the blockchain industry continues to mature, Chainlink has the potential to play a pivotal role in shaping the future of decentralized applications.

LINKUSD rally similar to 2020/21 has started.Chainlink (LINKUSD) gave us a fantastic bullish break-out on our last call (October 01, see chart below) as it was pretty much expected based on the 2020 Cycle fractal:
Based on the chart above, our $53.00 Target remains for this Bull Cycle (4.382 Fibonacci extension) but if you want to trade shorter term, the dominant pattern right now (until broken) is the Channel Up that started after the June 10 2023 bottom.
Having formed a 1D Golden Cross just 2 weeks ago, we can see the resemblance of the current Bullish Leg of the Channel Up with the previous one, which was also confirmed after the last 1D Golden Cross was formed on October 12 2023.
The similarities are evident even on their 1W MACD sequences and as that Bullish Leg rose by +361.50%, we expect a similar pattern. This gives us a short-term Target of $40.00.
-------------------------------------------------------------------------------
** Please LIKE 👍, FOLLOW ✅, SHARE 🙌 and COMMENT ✍ if you enjoy this idea! Also share your ideas and charts in the comments section below! This is best way to keep it relevant, support us, keep the content here free and allow the idea to reach as many people as possible. **
-------------------------------------------------------------------------------
💸💸💸💸💸💸
👇 👇 👇 👇 👇 👇

LINK is Breaking out massive patternLINK / USDT
Chainlink is trying to breakout massive triangle on HTF
If it able to Break out here this will be extremely bullish for the next couple weeks / months
Best of wishes

SCRAPING THE PROFITS | %250 DAILY VOLUME SPIKEMy last Link trades,
All 3 worked like a charm and now let me cook again for you.
Blue boxes will be valuable if we come back.
If we go up hard without coming back, range high area (26.89$) will be valuable.
I keep my charts clean and simple because I believe clarity leads to better decisions.
My approach is built on years of experience and a solid track record. I don’t claim to know it all, but I’m confident in my ability to spot high-probability setups.
My Previous Analysis
🐶 DOGEUSDT.P: Next Move
🎨 RENDERUSDT.P: Opportunity of the Month
💎 ETHUSDT.P: Where to Retrace
🟢 BNBUSDT.P: Potential Surge
📊 BTC Dominance: Reaction Zone
🌊 WAVESUSDT.P: Demand Zone Potential
🟣 UNIUSDT.P: Long-Term Trade
🔵 XRPUSDT.P: Entry Zones
🔗 LINKUSDT.P: Follow The River
📈 BTCUSDT.P: Two Key Demand Zones
🟩 POLUSDT: Bullish Momentum
🌟 PENDLEUSDT: Where Opportunity Meets Precision
🔥 BTCUSDT.P: Liquidation of Highly Leveraged Longs
🌊 SOLUSDT.P: SOL's Dip - Your Opportunity
🐸 1000PEPEUSDT.P: Prime Bounce Zone Unlocked
🚀 ETHUSDT.P: Set to Explode - Don't Miss This Game Changer
🤖 IQUSDT: Smart Plan
⚡️ PONDUSDT: A Trade Not Taken Is Better Than a Losing One
💼 STMXUSDT: 2 Buying Areas
🐢 TURBOUSDT: Buy Zones and Buyer Presence

CHAINLINK — 2024-5CRYPTOCAP:LINK The standard for onchain finance
The Chainlink standard continues to see adoption across the tokenization landscape, with recent developments in Q3 underscoring how Chainlink’s decentralized infrastructure plays a pivotal role in enabling smart, scalable, and secure tokenized real-world assets (RWAs). Companies such as 21Shares, Lympid, Superstate, and Sygnum are leveraging Chainlink services like Data Feeds, Proof of Reserve (PoR), and the Cross-Chain Interoperability Protocol (CCIP) to bring critical onchain transparency, connectivity, and real-time data to tokenized assets, including U.S. Treasury bonds and Ethereum ETFs. These integrations provide verifiable, onchain asset backing, which enhances user trust and facilitates the growth of decentralized finance (DeFi) applications such as collateralized lending and automated asset management. Chainlink’s infrastructure continues to enable firms to set new standards for transparency and reliability in both traditional and decentralized finance.

Is Chainlink (LINK) the Next Big Investment Opportunity?Major Crypto Project's Strategic Move Fuels Chainlink's Rally
Chainlink (LINK), a leading decentralized oracle network, has experienced a significant surge in value following a strategic investment from Trump’s World Liberty cryptocurrency project. The investment announcement has ignited a wave of optimism within the crypto community, propelling LINK's price to a 15.9% increase since Wednesday.
The Power of Oracles
At the heart of Chainlink's success lies its role as a reliable bridge between the traditional financial world and the decentralized blockchain ecosystem. Oracles, such as Chainlink, provide real-world data to smart contracts, enabling them to execute complex financial transactions and trigger events based on external conditions.
By leveraging a decentralized network of nodes, Chainlink ensures data accuracy, security, and tamper-resistance. This has made it a crucial component for various decentralized applications (dApps), including DeFi protocols, insurance platforms, and gaming platforms.
The Impact of the Investment
This strategic move has had a ripple effect on the broader crypto market. As more and more high-profile projects adopt Chainlink, the demand for LINK tokens is likely to increase. This, in turn, could lead to further price appreciation and strengthen Chainlink's market dominance.
Technical Analysis: A Bullish Outlook
From a technical perspective, LINK's recent price action is encouraging. The 15.9% surge has broken through key resistance levels, indicating a strong bullish momentum. The Relative Strength Index (RSI) is currently in the overbought territory, suggesting that a short-term correction may be on the horizon. However, the overall trend remains bullish, with the potential for further upside in the coming weeks and months.
Key Takeaways:
• Chainlink's role as a reliable oracle network is crucial for the growth of the DeFi and dApp ecosystem.
• The recent investment from is a significant endorsement of Chainlink's technology and potential.
• LINK's price has surged 15.9% in the past few days, driven by bullish sentiment and technical factors.
• While a short-term correction may be possible, the overall trend for LINK remains bullish.
Conclusion
Chainlink's recent surge, fueled by a strategic investment from a prominent crypto project, highlights the growing importance of decentralized oracles in the blockchain industry. As the demand for reliable data feeds continues to rise, Chainlink is well-positioned to capitalize on this opportunity and further solidify its market leadership. Investors should closely monitor LINK's price action and consider its potential for long-term growth.
Disclaimer: This article is for informational purposes only and should not be construed as financial advice. Always do your own research and consult with a financial advisor before making investment decisions.

Chainlink Surge Over 20%: A Testament to Growing DeFi ConfidenceChainlink ( CRYPTOCAP:LINK ) has stolen the spotlight in the cryptocurrency market, achieving a remarkable 20.43% surge in the past 24 hours, closing at $28.44. As a leader in decentralized oracles, Chainlink continues to demonstrate its pivotal role in the decentralized finance (DeFi) ecosystem.
Technical Overview
Chainlink’s surge began early in the day, breaking critical resistance levels and achieving an intraday high. Despite pulling back slightly, LINK still boasts a robust 16.8% gain, signaling strong market interest.
Key Levels:
- Resistance: $30 remains the next major hurdle. Breaking this could propel LINK further into uncharted territory.
- Support: Strong support is evident around $25, ensuring stability amid potential profit-taking.
RSI (Relative Strength Index): Holding at 62, the RSI suggests a healthy bullish trend without reaching overbought territory, leaving room for further growth.
Trading Volume: Substantial trading activity underscores increased demand, confirming a strong investor appetite for $LINK.
Strengths Driving the Rally
1. Role in DeFi Expansion:
Chainlink’s decentralized oracle technology has become indispensable for the DeFi space, powering data feeds for smart contracts across multiple blockchain networks. This critical role boosts investor confidence in the project’s long-term viability.
2. Growing Adoption:
Chainlink’s expanding partnerships and integrations have further cemented its reputation. Recent collaborations with prominent blockchain projects have likely fueled optimism, as they highlight real-world use cases for LINK’s technology.
3. Market Sentiment:
Chainlink’s surge comes at a time when the broader cryptocurrency market exhibits modest fluctuations. LINK’s outperformance reflects strong sentiment around its unique value proposition in the blockchain ecosystem.
What’s Next for Chainlink?
Market participants are closely watching LINK’s next moves. A decisive breakout above $30 could catalyze another wave of upward momentum, potentially targeting $35. However, a failure to hold current levels might see LINK retest support at $25, offering another entry point for long-term investors.
As the DeFi sector continues to grow, Chainlink remains at its core, providing crucial infrastructure for data integrity and security. This, coupled with its technical strength, makes it a token to watch in the coming weeks.
Final Thoughts
Chainlink’s recent rally underscores its importance in the cryptocurrency space, both as a technological innovator and a valuable asset for investors. With a strong technical setup and growing adoption, LINK appears poised to sustain its upward trajectory.
Investors, however, should remain mindful of market volatility and key levels as the token seeks to navigate its next phase of growth.
