SasanSeifi 💁♂Daily Price Analysis and Possible ScenariosHey there! In the daily time frame, as you can see, the price isn't showing any significant movement at the moment and is trading within the $11 price range, forming a range-bound pattern. The scenario we can consider in the daily time frame is as follows: after confirmation if the price falls into a range, it might experience a minor correction down to the $9.50 and $9 price range. Following a rebound from the liquidity zones, while keeping the support levels intact, we might witness renewed price growth. In case of a correction, for a better understanding of the continuation of the price trend, it's important to observe how the price reacts to the support levels.
Moreover, another scenario to consider is that if, after the consolidation, it manages to break above the $12 resistance range and consolidates, there might be potential for further growth towards the $14 price range.
🟢 Keep in mind that these are just scenarios, and it's important to conduct your own analysis and consider other factors before making any trading decisions 😊📈📉
❌ (DYOR)
⭕Of course, if you have any more inquiries or require further clarification, don't hesitate to reach out. I'm here to assist you!
🔹If you found this analysis helpful, please show your support by liking and commenting. Thank you! 🚀😊 🙌
LINK

🔥CARDANO Breaks Trendline and Now The Way is Open❗️Cardano is breaking above the trendline, so I don't recommend to use all 100% of money to invest now. I prefer to wait for the pullback to the trendline and test it as the support to buy as it shown on chart.
The closest target is a local high at $0.46.
💥$1 is possible if BTC reach $42-46k. The targets is on chart.
like❤️ and follow
Check the links and get a BONUS🎁 from me👇

🔥GLOBAL OVERVIEW On MATIC For The Bull Market❗️MATIC is of the strongest altcoins among thousands of crypto. The previos bull market confirms it. The growth by 110 times after the triangle breakout!
💥 It capitalization have already reached $300M and it has potential but it's around 30-50x ($27-40 per coin).
Locally, Matic can grow to the top of the channel by +110% and make a pullback. I expect the growth after this pullback, but the growth continue if it break the triangle streight now.
like❤️ and follow
Check the links and get a BONUS🎁 from me👇

🚨 Link/USDT: Brace for Impact 📉Hey traders, it's time to watch out for Link's next move. The lower support area is calling, and it seems like the buyers are losing their grip. After lingering around, my expectation is that Link's price may dip by at least 20-50% soon. Remember, this isn't financial advice, just an idea – make sure to do your own research! 💼📉

Chainlink Bull Run May Lose Momentum
The current state of Chainlink's bull run seems to be showing signs of losing momentum. As an informed trader, it is essential to remain cautious and consider the potential risks associated with any investment decision.
Over the past few months, Chainlink has witnessed an incredible surge, capturing the attention of many traders and investors. The project's innovative approach and promising technology have undoubtedly contributed to its success. However, it is crucial to recognize that every bull run eventually encounters a point of exhaustion, and Chainlink may be nearing that stage.
Several indicators suggest that the momentum behind Chainlink's upward trajectory is beginning to wane. The recent price fluctuations, coupled with a lack of significant positive news, have raised concerns among market analysts. While no one can predict the future with certainty, it is prudent to approach Chainlink trading with caution at this juncture.
In light of these observations, I would like to encourage you to pause and reevaluate your trading strategy regarding Chainlink. Taking a step back to assess your positions and reassess the market sentiment can help ensure that you make informed decisions that align with your risk appetite.
Moreover, it is crucial to diversify your portfolio and not solely rely on a single asset, especially during times of uncertainty. Allocating your investments across different cryptocurrencies or asset classes can help mitigate potential risks and provide a more balanced approach to trading.
Remember, successful trading requires a comprehensive understanding of the market dynamics and a disciplined approach. While Chainlink's bull run has been impressive, it is essential to remain cautious and avoid being swayed solely by the excitement surrounding its recent performance.
As always, I encourage you to conduct thorough research, stay updated with the latest news and developments, and consult with trusted financial advisors before making any investment decisions.
Should you have any questions or require further insights, please do not hesitate to comment below. I am here to assist you in navigating the ever-evolving cryptocurrency market.

SHORT LINK, HIGH REASONING, SHORT-MID TERMTP: Last≤10.560
SL: Last≥11.820
Maybe you could let half of your TP run farther, as the price goes down.

BRIEFING Week #44 : Dominance in SPX & CryptoHere's your weekly update ! Brought to you each weekend with years of track-record history..
Don't forget to hit the like/follow button if you feel like this post deserves it ;)
That's the best way to support me and help pushing this content to other users.
Kindly,
Phil

Chainlink Pushes Towards $12 with Positive EMA and MACD IndicatoWith the EMA period and MACD indicators both staying positive, Chainlink is making significant strides towards the $12 mark. It's time to seize this opportunity and consider a long position on Chainlink!
The current market conditions have provided us with a strong bullish trend for Chainlink, and the EMA period and MACD indicators are reinforcing this positive sentiment. As the EMA continues to climb steadily, it reflects the sustained upward momentum of Chainlink's price. Additionally, the MACD staying positive indicates that the buying pressure is outweighing the selling pressure, further supporting the bullish outlook.
Now, you might be wondering, what does this mean for you as a trader? Well, it's an exciting chance to capitalize on Chainlink's upward trajectory! By taking a long position on Chainlink, you have the potential to ride the wave of its growth and potentially reap substantial profits. The positive EMA period and MACD indicators serve as strong signals that the upward momentum is likely to continue, making it an opportune time to consider entering a long position.
So, what's the next step? Don't miss out on this fantastic opportunity! I encourage you to carefully analyze the market conditions, conduct thorough research, and consider taking a long position on Chainlink. As always, it's essential to have a solid risk management strategy in place and stay updated on the latest market developments.
Remember, trading is all about seizing opportunities, and Chainlink's current positive trend is one you definitely don't want to overlook. Stay positive, keep your spirits high, and let's make the most of this exciting market movement together!
If you have any questions or need further assistance, feel free to comment below. I'm here to support you on your trading journey.

We have worked out the turn of the quarter, we need to hold on.The first month of the quarter is coming to an end and there is a high probability of a wave of breakouts on the alt in order to fix the current monthly candle above the nearest resistances and continue the trend in the new month. The tops gave a new wave of growth to the target levels this year of 32.5-35k by the cue ball and 2250-2500, which I have repeatedly indicated. Also from 7.5 a good trend to 12.5-15 was shown by link, which I advised future lovers. Altos also have the opportunity to grow up against the background of the overall growth of the market. With the opening of a new monthly candle on the tops from the middle of the new week, there is a possibility of a pullback after the current growth. Altos that are low have more chances to compensate for this due to high growth goals and already worked out supports at the bottom. Coins that have climbed high under market pressure can start a new month with a rollback and draw shadows down the monthly chart.
According to eth, we worked out the scenario of a quarter reversal with a return to the previously formed bullish channel. In an optimistic scenario, at the beginning of the week, the bulls will hold the channel with working out the double top and taking the level of 1850, which is key for an exit above 2000 and a stable trend. With a more negative scenario, we will leave the channel retest below 1750 again, which will leave us flat for the next month. An unprocessed move in this case and a positive opening of the quarter will support purchases from 1600. The most negative scenario is a departure below 1675, which may lead to the resumption of sales with the aim of testing 1500. But the probability of this scenario is still about 20% in my opinion, on average the market looks positive.
In my work, I work in priority with coins that can show growth at the close of the month with a continuation in the new one, such as ooki vib perl uft cvp pros. A similar potential is also possessed by the lower-liquid asr atm pnt torn, which take longer to accumulate the potential for breakdown for the same purposes up to 3-5X.
Second of all, I consider the coins fixed a little higher, but maintaining high goals for growth. They can also open a new month by continuing to grow in a row, in the first half of the month at least, or with a small shadow on a new monthly candle. These include dock wtc vite epx fio for drep oax df amb.
Interesting for scalping with goals up to 50-70% are loka om hard fis burger chess voxel farm. Cos wing nuls dego farm front among the coins that I recommended earlier took quite high levels, according to them, a new month with a higher probability can begin with a fairly deep rollback.
As before, I use safe havens in which I hide funds after the next mining of coins with high potential, I consider vidt and gft. However, according to gft, after a fairly strong growth, the probability of a retest of lower supports at 0.0090-0.0125 remains. According to Vidt, part of the prize was fixed and topped up in coins with a higher growth potential, there is also a chance of re-topping up in the area of 0.015.
Developing coins are gradually gaining liquidity, passing listings on new exchanges, among them listings:
CoinDCX perl(25.10) dock(23.10) vib(22.10) cvp(22.09) om(18.09) wing(2.08) pnt(23.06) amb(15.06) oax(3.05) vidt(27.04) df(20.03) amb(3.03)
BingX perl (25.04)
Bitget vib(20.10) oax(21.02)
BitForex torn vib(1.03) amb(4.9)
Tapbit for pros vib (22.9.22) cvp (19.10.22)
Gate cvp (19.02) amb(22.09)
CoinW vidt(22.11.22)
On vib dock vidt charts, you can observe that even listings on small exchanges give good growth waves in this or next month. A pleasant reaction to the recent listings on perl cvp on CoinDCX is likely.

Chainlink: The Unstoppable Force Dominating the Crypto Market! Chainlink has been on an unstoppable rampage in the crypto market, boasting an astonishing 59% return over the past three months! 📈🔥
Yes, you read that right! Chainlink has been flexing its muscles and leaving other cryptocurrencies in the dust. It's been a wild ride, and if you haven't jumped on the Chainlink train yet, now is the perfect time to hop aboard and experience the exhilarating gains for yourself!
Why Chainlink, you ask? Well, let me tell you. Chainlink has been revolutionizing the blockchain industry with its cutting-edge technology and real-world applications. Its decentralized oracle network has garnered immense attention from major players in the market, propelling it to new heights.
But enough about the past, let's focus on the future. Chainlink's potential is still untapped, and as traders, we have the opportunity to ride this wave of success to even greater heights. So, here's my call-to-action for you: it's time to long Chainlink and seize the moment!
Don't let this opportunity slip through your fingers. Join the ranks of savvy traders who have already recognized Chainlink's potential and are reaping the rewards. With its strong fundamentals and a dedicated community backing it, Chainlink is poised to make even more waves in the coming months.
So, grab your trading gear, fuel your excitement, and let's embark on this thrilling journey together! Long Chainlink and be a part of the unstoppable force that's dominating the crypto market.

Chainlink LINK long medium-term trade #19And we continue our series of potential medium-term trades.
For the past year and a half, the LINKUSDT price has been trading in a wide range of $5-9. During this time, buyers have made 6 attempts to break through and gain a foothold above $9 , but all in vain. Perhaps they will succeed the 7th time?)
Given the fact that in the previous few weeks, LINK buyers have been showing considerable strength and pushing the price up, we are ready to buy LINKUSDT long on the following conditions:
Entry: in the range of $6.60-6.90 (an average price of $6.75 is desirable)
Stop: $6.049 (-10.4%)
Take profit: $11.84 (+75.4%)
P/L ratio: 7.26
We allocate $10,000 for LINKUSDT trade, in the event of a mistake, we will lose $1040. If the trade will be a success, we will receive a profit of $7540

LINKUSDT.1DBased on the given market data, the current price of LINK is 10.819 USDT. The Relative Strength Index (RSI) for 4 hours, 1 day, and 7 days are 61.23, 83.32, and 74.02, respectively. Typically, an RSI above 70 indicates an overbought condition, suggesting that a price drop may be imminent. Thus, the 1-day and 7-day RSI levels indicate that LINK could be overbought.
The Moving Average Convergence Divergence (MACD) for 4 hours, 1 day, and 7 days are 0.378, 0.939, and 0.505, respectively. This indicates a bullish trend in the short, medium and long term.
The Bollinger Bands (Bb) for 4 hours, 1 day, and 7 days are 11.788, 11.446, and 11.560, respectively. The current price is slightly below the middle band, suggesting a neutral trend.
The support levels for 4 hours, 1 day, and 7 days are 10.056, 8.359, and 7.086, respectively. The resistance levels for the same periods are 11.932, 14.321, and 11.828, respectively. This indicates that the price has a potential to go up or down but given the RSI, a downward movement could be anticipated.
In conclusion, while the MACD indicates a bullish trend, the overbought RSI levels suggest there may be a pullback in the short term. However, the market is unpredictable and it's essential to consider other market factors and conduct a comprehensive analysis before making investment decisions. Always ensure to invest wisely.

LINK bottom 51h / 1D time frame
-
On the left chart, LINK get rejection from the resistance zone(10.7~12.3), and I think there is a possibility to create a Head and Shoulders structure.
On the right chart, top 9.45 and bottom 5.45 are a box range. LINK has already broke above the top resistance at 9.45 and start consolidating. This is might be a liquidation hunting, once LINK go below 9.45 again, a fake breakout will be confirmed.
TP: 5.5
SL: 11.9

LINK - Once A Castle; Always A Castle!Hello TradingView Family / Fellow Traders. This is Richard, also known as theSignalyst.
on Weekly: Left Chart
After being stuck inside a range for more than a year between 5.0 and 10.0 round numbers, LINK finally broke above the range / accumulation phase.
Now we are expecting the MarkUp to push higher till the 18.0 resistance.
on H4: Right Chart
The bulls would remain in control from a medium-term perspective, unless the last low in red at 10.5 is broken downward.
In this case, a movement till the 9.0 - 10.0 support zone would be expected where we will be looking for trend-following buy setups.
📚 Always follow your trading plan regarding entry, risk management, and trade management.
Good luck!
All Strategies Are Good; If Managed Properly!
~Rich

LINK/USDT 1DAY UPDATE BY CRYPTOSANDERS !!Hello friends, welcome to this LINK update from Crypto Sanders.
Chart Analysis:- Chainlink (LINK) was a notable gainer on Wednesday, as the token rose by as much as 9% in today’s session.
Following a low of 9.84 on Tuesday, LINK/USD rallied to an intraday peak at 11.55 earlier in the day. the cryptocurrency climbed to its strongest point since last year when its price peaked at over 12.00.
the latest surge in price has kept the relative strength index (RSI) above the 80.00 level.
the index is tracking at 81.87, which is its highest point since August 2020, which is deep in overbought territory.
LINK is trading at 11.11,
I have tried to bring the best possible results in this chart.
If you like it, hit the like button and share your charts in the comments section.
Thank you.

LINKUSDT - Breakout after an extended Period of Consolidation!!LINKUSDT (1D Chart) Technical analysis
LINKUSDT (1D Chart) Currently trading at $8.2
Buy level: Above $8.1
Stop loss: Below $7
TP1: $9.5
TP2: $12
TP3: $14
TP4: $18
Max Leverage 3x
Always keep Stop loss
Follow Our Tradingview Account for More Technical Analysis Updates, | Like, Share and Comment Your thoughts

Perl the next trend startsToday I want to consider the position of perl, which, along with uft ooki pros cvp, has so far the highest goals for growth in the mid-range up to 3-5X and has repeatedly pleased with profits last year. The project is only developing and will still show itself. Today, perl was listed on CoinDCX, which will provide an increase in the volatility of the coin. Under the overall negative dynamics of the market, we rebounded from the profit-taking zone, which has already brought up to 90% profit, but there was a breakdown, which will ensure a return to the zone in the future. Since September, there has been a trend reversal, sales have been fully repaid and a new wave of growth begins to swing. The key level for the coin is 0.025, the breakdown of which opens the possibility of a hike to 0.050-75 and an increase in volatility. By the end of the month, we can expect an attempt to break a new bullish trend line and a stable consolidation above 0.025 with a further trend. Opening a month above the level will give stable support to purchases. I would like to note that the December impulse broke through the level of 0.050, which technically makes it possible to test 0.075 this year.

LINKUSD reminding us of its glorious days.Chainlink (LINKUSD) smashed through our 8.000 target (and the Lower Highs) that we set on the September analysis (see chart below):
The price made a 17-month High, broke above the 1W MA100 (green trend-line) for the first time since the week of February 07 2022 and has essentially welcomed the new Bull Cycle as it's now above even the Bear Cycle's Lower Highs. The last Resistance standing is the 1W MA200 (orange trend-line), currently at 13.1636.
We have shifted our focus on the more long-term 1W time-frame as it allows us to compare LINK with the previous Cycle, at the time when the 1W RSI first turned overbought above 70.00 (as it has now). That was on the week of May 13 2019, on a strong 3-week rally (as currently), with the 1W MA50 (blue trend-line) turned into Support.
The rally didn't stop there but instead extended up to the 2.618 Fibonacci extension. There is no reason to expect a stop before at least $18.00, which is the March 2022 High. The 2.168 Fibonacci is a little over $20.00.
-------------------------------------------------------------------------------
** Please LIKE 👍, FOLLOW ✅, SHARE 🙌 and COMMENT ✍ if you enjoy this idea! Also share your ideas and charts in the comments section below! This is best way to keep it relevant, support us, keep the content here free and allow the idea to reach as many people as possible. **
-------------------------------------------------------------------------------
💸💸💸💸💸💸
👇 👇 👇 👇 👇 👇

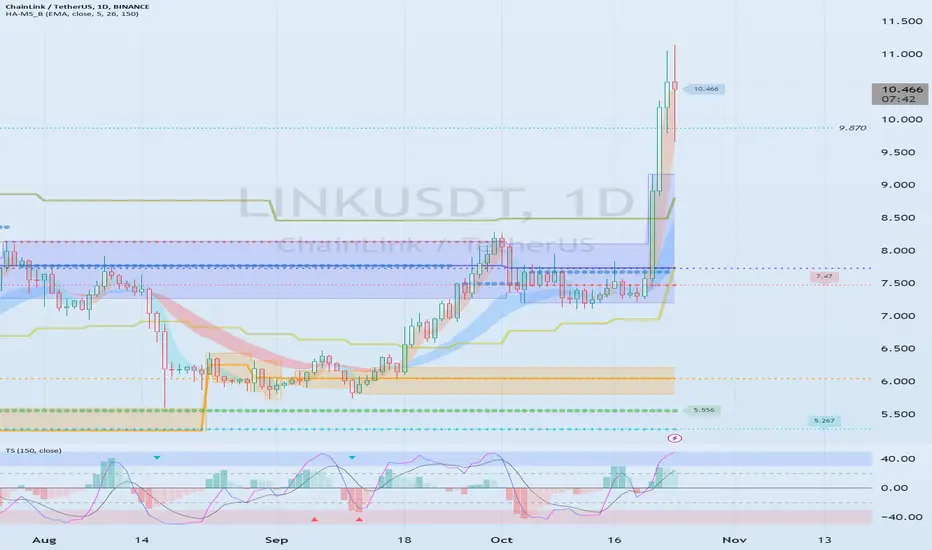
The key is whether the price can be maintained above 9.870Hello?
Hello traders!
If you "Follow" us, you can always get new information quickly.
Please also click “Boost”.
Have a good day.
-------------------------------------
(LINKUSDT chart)
(1M charts)
The key is whether it can rise above 15.13.
To do this, it is important to receive support around 11.236.
(1W chart)
The key is whether it can receive support in the 10.852-12.754 range and rise above 15.0.
If possible, I would like to see a movement that causes the HA-High indicator to fall and be created by shaking it up and down.
(1D chart)
The key is whether the price can be maintained above 9.870 and rise above 13.660-20.410.
--------------------------------------------------
- The big picture
The full-fledged upward trend is expected to begin when the price rises above 29K.
This is the section expected to be touched in the next bull market, 81K-95K.
-------------------------------------------------- -------------------------------------------
** All explanations are for reference only and do not guarantee profit or loss in investment.
** Trading volume is displayed as a candle body based on 10EMA.
How to display (in order from darkest to darkest)
More than 3 times the trading volume of 10EMA > 2.5 times > 2.0 times > 1.25 times > Trading volume below 10EMA
** Even if you know other people’s know-how, it takes a considerable amount of time to make it your own.
** This chart was created using my know-how.
---------------------------------
LINKUSDT The curse was broken
For over 500 days, the price of the BINANCE:LINKUSDT below $9.7 was traded, but finally, today, this resistance line has been broken, and the price has been trading above this line for a moment, indicating the end of endless ranges in this area.
In my opinion, this could be the beginning of further price growth.
⛔"Daily crypto market analyses I provide are personal opinions & not financial advice. Trading carries risks, so do your own research & seek advisor's help.#DYOR"
Don't forget to like and comment

WHY IS LINK PUMPING TODAY?Why is Chainlink BINANCE:LINKUSDT pumping today?
Last month, I forecasted this coin on reach to a year-long resistance and to watch out for a potential breakout or pump in the upcoming weeks.
Now, BINANCE:LINKUSDT pumped because of a year-long breakout , that's 16 months to be exact.
What should we do next?
Scalping either long or short would be best in my opinion but be sure to have a setup for that strategy. For intraday traders, be patient for finding some possible bullish patterns (mini resistance breakouts, head and shoulders, cup and handle) as the coin is still in an uptrend. Take note, we can see retracements for the coin price, as the price would wait to be stable from the yearly breakout.
From a technical standpoint, I would rely on identifying a common resistance for a potential take profit area.
I find the $11,446 resistance line convincing since it presents strong support and could be a new resistance line for the coin (click the chart above for better quality) . Another would be at near $12 range, based on the fib retracement of .382 from its all-time high.
This would take possibly a week or more in order to reach that price that I've mentioned.
If you entered the breakout, congratulations! Now, you need to do set a protective stop profit in tranches.
Plot your support line because that will be a guide in taking partial stop profits. In this case, I would plot a diagonal support line. If a breakdown happens with confirmation of candles and your indicators, you could take a bit of your profit OR for those who did not enter, execute a scalp short play and plot your Fibonaccis.
I'll add more forecast to this idea but will update you in the comments section.
Thanks to those who are supporting my past ideas, means a lot. Feel free to comment your questions or suggestions and please follow my profile on this platform for more of this and possibly add more trading content.
PLAN your trades, happy trading!

Link $18 Hello, friends!
In March, I conducted an analysis of the Link coin. At that time, key zones for potential purchase were identified. Today, we can see that the coin has reached the buying level and has begun to show activity, moving upwards.
Based on the previous analysis, we make the assumption that the Link coin may soon reach the $18 level. Considering the previous analysis data and trends, this level could become a reality in the near future.

New Week, New Challenges! 💪Hey Traders! 🙌
New week, new challenges, and the markets are buzzing! 🐝
🔥 Bitcoin: It's at a pivotal 31K level. Keep an eye on the resistance cluster. If it breaks, we could see 45K. 🚀
📉 NASDAQ: Currently at a major resistance level of 14,646. Today's opening is crucial. Will it rebound or sink? 🤔
📊 S&P 500: We've been short and it's paying off. Watch the U.S. market opening closely. It's a 50-50 game right now. 🎲
🛢️ Oil: Closed long positions at 93. The Middle East situation is making it volatile. Don't fall for the long trap. 🚫
🔗 Link: Our next target is 14.44. The chart is straightforward and bullish. 🐂
🌍 And hey, it's 2023. Let's hope for peace and positive vibes all around. 🕊️
🔒 Gold: Not my preferred asset, but if it breaks over 2001, I might go long. 🏆
That's it for now! Stay tuned for more updates. 📲
One Love,
The FXPROFESSOR 💙
Video transcript:
0:05 New week, new challenges, let's go. Hi everyone wishes for a nice week. First of all Monday and a Monday with Bitcoin storming to 31k and getting rejected for the time being before it tests a very crucial resistance cluster which I have covered very, very recently in many occasions.
0:32 So we're going to go through my ideas, but just so that you know the levels. We have support at 29,000.
0:41 We probably have a lot of support over here. Moving exponential. Moving average around just below 30,000 also. And you cannot detect the 30,000 as a round number the same way.
1:00 You cannot leave this level here, which is also support. So. I'm expecting to test this major resistant cluster and then we'll see if we will have a breakout from here.
1:13 So let's put it there. Time has progressed a little bit. Okay. And that would be the big one because the next level.
1:21 Would be around 45,000 according to my analysis according to the same charts that I've been sharing in the last few months at the same time.
1:32 We have situation in the Middle East, which is no We'll have. We have been short on indices and I can tell you that Nasdaq has lost this major level.
1:46 Okay, so this is now Nasdaq at major resistance. At 14,646, so today's opening will be crucial to see if the indices will be able to do better.
2:08 Okay, and if they will be able to rebound from there, you can see how huge this level is. So according to my analysis, this level is going to cause concerns and we can see NASA dropping even more.
2:24 Similar chart. With SMP 500, which is has some support there, but we have been short from there. So let's go to this chart and then I will show you the easiest chart.
2:38 We have these last a few months and the best entry we had on link and why we did so well and why we have a new breakout.
2:46 And I can see 14.4 as the next target. But before we do that, let's go to the previous charts. So I have the video explaining why the 31 K is a pivotal level and why it's crucial.
3:02 And we are there chart that you looked just a few minutes ago. Of course, before that we had October. And most importantly, this entry here, which was up to 29, more than 75% possibility.
3:21 And the next level are 31 K and I called it. I had the the balls to. Say that maybe it's time to say ideas to 25 K or lower.
3:36 And of course from there, the chart worked exactly. We did have a retracement there at 26, 600 and we had a.
3:45 Hopefully entry and from there we've been going higher and higher. Okay. So 26 600 600 the last entry 29,000 checked.
3:56 You see how it acted as a level of resistance. The price thought and now almost. 31,000. We haven't checked my level clearly, but I believe that's what happening next.
4:07 At the same time, we need to, I mean, we can go through the altcoins. Okay. But before we do that, we had crude oil.
4:21 Okay. We closed along positions at 93 and we were very right to do so. You see this chart also working really, really well.
4:30 And the situation in Middle East is affecting the price of oil. Oil and a lot of trades are going long, big time on oil, but we didn't fall for that trap because that's what it ended up being.
4:41 And of course, S&P 500, given that we have altcoins we have Bitcoin and some altcoins. Long we had to be hedged.
4:51 So we gave a fantastic entry guys on S&P 500 short. And you can see again how this level played out very, very nicely.
5:00 And I believe that today's US opening will be very important. We already have NASDAQ and you saw it's under support.
5:10 S&P is going to check its own support. And then we'll see what happens at the US market opening if we will have a rebound or if it will go lower.
5:20 If you ask me right now, I will consider it's 50-50. I'm going to close with LingQ. So LingQ, the most straightforward chart you have, we have seen.
5:32 So the last entry we had was at 6.03. As you can see, you say, hey professor, Yes, sir. 5,000, blah, blah, blah, but is it really 5,000?
5:40 No, it's a lot more guys because it was open at 6.03 and it was compounded and doubled along the way.
5:47 But we took profit here and here. You can see how straightforward this chart is. Just like it's the simplest chart in the world is a channel, okay?
6:00 And resistance, resistance, resistance, support, support, support. Last time we have the fakeout here and the it's back on, back being bullish and the last entry was here at some different levels and a different exercise as I had shared with my audience over here and of course 14.4 is the next target
6:23 because what do we have today? We have the breakout, so if I go to the 15 minute chart, we had a breakout here and that means that this level is now the new support, okay?
6:37 And take a wild guess if the price dips under there. We'll go short. But for the time being, we remain long and the next target is 14.44.
6:49 Okay, let's not look higher. 14.44 would be an awesome level to conclude this trade, which again, we had already taken profit once, twice, but we actually did increase it here.
7:04 We've been quite active in my community with trading link and the chart has been working really, really nice. Now, link is a very important altcoin, but we could look at bitcoin first, so this is a bitcoin chart which I will share with you on a different post, just a chart.
7:27 So let's see how you are. Let's wish for peace in the Middle East and everywhere. It's the year 2023. Do we really need to kill each other and divide ourselves and think about all the negative things?
7:41 Or can we find some f****** solutions and work around? Something positive on this planet? Well, I don't know, but Bitcoin remains my top asset because if the shit hits a fan, Bitcoin is what I'd like to hold.
7:54 If the banks go bust, Bitcoin is what I'd like to hold. If the economy goes well, and that's what we hope, and if the trouble is saved, then we would like to see the ETFs joining, and Bitcoin has already, I believe, proved itself as the best safe haven.
8:10 I mean, maybe we should like take a look at gold before I go, and a lot of people rush it.
8:16 We are getting into buy gold, especially older fellas that they don't understand what Bitcoin is, but what we had here, October 20th, gold resistance 2001.
8:27 So I guess I was right again, at least for the time being, but that gives us a nice heads up.
8:33 To go short on gold and my target for gold is 1938 and 1881. Yes. If it does break over 2001, I'm going to go long to 2052 and eventually 2134, but that's not a lot.
8:48 I'd rather stick to Bitcoin, which again is my preferred assets. That's it from me. Take care. Catch up with you later.
8:56 I love you.
