LINK in coming Weeks ...frankly, Bitcoin will reach $30 in the coming weeks.
Give me some energy !!
✨We spend hours finding potential opportunities and writing useful ideas, we would be happy if you support us.
Best regards CobraVanguard.💚
_ _ _ _ __ _ _ _ _ _ _ _ _ _ _ _ _ _ _ _ _ _ _ _ _ _ _ _ _ _ _ _
✅Thank you, and for more ideas, hit ❤️Like❤️ and 🌟Follow🌟!
⚠️Things can change...
The markets are always changing and even with all these signals, the market changes tend to be strong and fast!!
LINK

LINK Trade Setup – Pullback to Support OpportunityChainlink (LINK) is currently testing resistance, and a retracement into the next support zone offers a clean long entry with solid upside potential.
🔹 Entry Zone:
$13.00 – $13.40
🎯 Take Profit Targets:
🥇 $15.00 – $16.00
🥈 $17.00 – $18.00
🛑 Stop Loss:
Just below $12.00

LINK/USDT 4H Chart ReviewHello everyone, let's look at the 4H chart LINK to USDT, in this situation we can see how the price was moving in a downward channel, from which we saw an exit to the top and the formation of a new local uptrend line.
Let's start by defining the targets for the near future that the price has to face:
T1 = 15.08 USD
T2 = 16.87 USD
Т3 = 17.93 USD
Т4 = 19.07 USD
Now let's move on to the stop-loss in case the market continues to fall:
SL1 = 13.98 USD
SL2 = 13.12 USD
SL3 = 11.74 USD
SL4 = 10.76 USD
SL5 = 9.48 USD
If we look at the RSI indicator we can see how the price correction gave a strong rebound on the indicator, which could potentially give strength for new growth.

LINK/USDT 1H Chart Update Chainlink is riding a strong Rising Channel!
Price action shows clear patternson LINKUSDT
▸ Bullish Doritos at $12.00 & $13.00, pushing the price higher.
▸ Reverse Doritos at $13.00 & $15.00, leading to pullbacks inside Rising Channel.
▸ Key levels to watch: $14.00 (support) and $17.00 (upper resistance).
✉️ As long as LINK stays in the channel, the bulls are in control! Will we see a breakout to $17.00 soon? Let’s discuss!

#LINK/USDT#LINK
The price is moving within a descending channel on the 1-hour frame, adhering well to it, and is heading towards a strong breakout and retest.
We are seeing a bounce from the lower boundary of the descending channel, which is support at 14.30.
We have a downtrend on the RSI indicator that is about to be broken and retested, supporting the upward trend.
We are looking for stability above the 100 moving average.
Entry price: 15.00
First target: 15.30
Second target: 15.61
Third target: 15.94

LINK: Multiple Scenarios#LINK had a great bullish rise from June 2023 to March 2024.
Since then, its price action has been unclear, with two possible corrective scenarios and one bullish shown below.
Regardless of the future path it takes, the broader outlook targets a new ATH.
#Chainlink

LINK / USDT: Macro Support Zone ReachedThe price has now reached the upper boundary of the ideal macro support zone for a complex and rare corrective structure (running flat), between 11–8.5.
As long as the price holds above April’s low, my operative scenario assumes that a new multi-year uptrend (wave (3)) has already started.
Key resistance zones to watch ahead: 85–121 (first major resistance) and 150–205/220 as final macro resistance targets.
Full view of the macro structure:
Thank you for your attention and I wish you successful trading decisions!
⸻
Previous trend analysis on LINK:
Nov'24:
Jun'24:
Dec'23:

Taking a look at LINK.This chart looks very interesting and contains many little tidbits of information about potential future outcomes. I see good things coming for LINK in the future.
Good luck, and always use a stop-loss!

LINKUSDT - Time to consider Alts more seriously?Is it time to reconsider Alt coins with some more sincerity? Notoriously up and down in the past, are top Alt coins set to experience some sustained gains over the coming years? Time will tell.
For now, our team has identified an opportunity within LINKUSDT, where momentum may very well be turning to a 'bullish' rating should price be able to hold current levels - Caution as always is warranted.
We do however see elevated risk of 'bearish' momentum coming into play below the $14.00 mark.
We're inspired to bring you the latest developments across worldwide markets, helping you look in the right place, at the right time.
Thank you for reading! Stay tuned for further updates, and we look forward to being of service along your trading & investing journey...
Disclaimer: Please note all information contained within this post and all other Bullfinder-official Tradingview content is strictly for informational purposes only and is not intended to be investment advice. Please DYOR & Consult your licensed financial advisors before acting on any information contained within this post, or any other Bullfinder-official TV content.

Support and Resistance Zone: 14.81-15.82
Hello, traders.
If you "Follow", you can always get new information quickly.
Please click "Boost" as well.
Have a nice day today.
-------------------------------------
(LINKUSDT 1D chart)
In order to continue the uptrend, the price must be maintained above the M-Signal indicator on the 1M chart.
Accordingly, we need to see if it can rise above the Fibonacci ratio of 0.382 (15.82).
Therefore, the key is whether it can rise after receiving support near 14.81.
-
If not, it should fall, and we need to check whether it supports near 12.49.
-
Trading strategies can be created based on whether there is support near the HA-Low and HA-High indicators.
It is not suitable to start trading because it has already risen from the current HA-Low indicator (12.49).
Accordingly, when it receives support near 12.49 and rises to the Fibonacci ratio 0.382 (15.82), you can check whether there is support and start trading.
This trade requires a short and quick response.
Therefore, it is recommended to try to keep the stop loss point.
If it rises above the Fibonacci ratio 0.382 (15.82) and maintains the price,
1st: 19.52
2nd: 23.98
It is expected to rise to the 1st and 2nd above.
-
Thank you for reading to the end.
I hope you have a successful trade.
--------------------------------------------------
- This is an explanation of the big picture.
To check the entire range of BTC, I used TradingView's INDEX chart.
I rewrote the previous chart to update it by touching the Fibonacci ratio range of 1.902 (101875.70) ~ 2 (106275.10).
(Previous BTCUSD 12M chart)
Looking at the big picture, it seems to have been maintaining an upward trend following a pattern since 2015.
In other words, it is a pattern that maintains a 3-year upward trend and faces a 1-year downward trend.
Accordingly, the upward trend is expected to continue until 2025.
-
(Current BTCUSD 12M chart)
Based on the currently written Fibonacci ratio, it is displayed up to 3.618 (178910.15).
It is expected that it will not fall again below the Fibonacci ratio of 0.618 (44234.54).
(BTCUSDT 12M chart)
Based on the BTCUSDT chart, I think it is around 42283.58.
-
I will explain it again with the BTCUSD chart.
The Fibonacci ratio ranges marked in the green boxes, 1.902 (101875.70) ~ 2 (106275.10) and 3 (151166.97) ~ 3.14 (157451.83), are expected to be important support and resistance ranges.
In other words, it seems likely that they will act as volume profile ranges.
Therefore, in order to break through these ranges upward, I think the point to watch is whether they can receive support and rise near the Fibonacci ratios of 1.618 (89126.41) and 2.618 (134018.28).
Therefore, the maximum rising range in 2025 is expected to be the 3 (151166.97) ~ 3.14 (157451.83) range.
In order to do that, we need to see if it is supported and rises near 2.618 (134018.28).
If it falls after the bull market in 2025, we don't know how far it will fall, but based on the previous decline, we expect it to fall by about -60% to -70%.
Therefore, if it starts to fall near the Fibonacci ratio 3.14 (157451.83), it seems likely that it will fall to around Fibonacci 0.618 (44234.54).
I will explain more details when the bear market starts.
------------------------------------------------------

#LINKUSDT Analysis — Testing Channel Breakout📈 #LINKUSDT Analysis — Testing Channel Breakout
🗓 Published: April 23, 2025
🕰 Timeframe: 1D | 📊 Exchange: Binance
🔍 Technical Overview
Chainlink has been trading inside a falling channel since December 2024, with lower highs and lower lows. Price is now attempting a breakout from the upper trendline, signaling a potential trend shift.
📌 Pattern: Falling Channel
📌 Attempting Breakout at $14.79
📌 Support base held well at ~$12 zone
📈 Break + Retest = Key Confirmation Setup
🟩 Potential Entry Zone
📍 $12.55 – A strong support and re-entry zone if price rejects the first breakout attempt and retests.
🔻 Panic Level (Invalidation Zone)
📉 $9.5 – Breakdown below this level would invalidate the bullish setup and may trigger a sharp sell-off.
🎯 Upside Targets (If Breakout Confirmed):
TP1: $15.67 – Local structure resistance
TP2: $18.85 – Range mid-point
TP3: $22.37 – Channel high
TP4: $27.07 – Full recovery zone
TP5: $30.76 – Last breakout top
Ultimate Target: $35.19 (Cycle top)
⚠️ Targets should be scaled into — not all at once
🧠 Strategy Insight
This is a classic breakout-retest setup from a falling channel.
🟢 Ideal strategy: enter small now, add on retest of breakout line (~$13–14 zone).
Use tight stops under $12.14, or wider structure-based stop under $9.42 for position trades.
📊 High reward if trend shift confirms. Patience is key.
🗣 What’s Next?
Watch for volume on breakout, and monitor if BTC remains strong — altcoins like LINK can quickly outperform if the setup holds.
📢 A key decision point. Don’t chase — plan your risk and let price prove the breakout.
Please keep in mind that this is not financial advice and the purpose of these charts is to provide an idea of coin movement, not buy or sell signals. The cryptocurrency market is highly volatile and not suitable for everyone, so be aware of the potential risks before making any investment decisions. The information presented here is a personal effort and is subject to success or failure, and we welcome constructive criticism.
Good luck to all.
🙏we ask Allah reconcile and repay🙏

LINK Trade Setup – Pullback to SupportLINK has made a solid move from ~$10 to $15 over the past couple of weeks. With that rally showing signs of slowing, a pullback into support presents a potential opportunity to catch the next leg up.
📍 Entry Zone:
$13.00 – $14.00
🎯 Take Profit Targets:
🥇 $15.00 – $16.00
🥈 $17.00 – $18.00
🥉 $19.50 – $20.50
🛑 Stop Loss:
Just below $12.00

LINK/USDT Potential UpsidesHey Traders, in today's trading session we are monitoring LINK for a buying opportunity around 14.6 zone, LINK/USDT is trading in an uptrend and currently is in a correction phase in which it is approaching the trend at 14.6 support and resistance area.
Trade safe, Joe.

Panic Selling LINK? Here’s Your Master PlanBuckle up! LINK has been riding a relentless bearish trend for 113 days, ever since it kissed its peak of $30.94 back in December 2024. With economic uncertainty casting a shadow over the markets and fear gripping investors, the big questions loom: Is this the dip to buy while others panic-sell? Or is it wiser to sit on the sidelines? Let’s slice through the noise, dissect LINK’s chart like a seasoned pro, and uncover the setups that could turn this chaos into opportunity. Let’s dive in!
The Big Picture: LINK’s Bearish Blueprint
LINK is currently trading at $13, a far cry from its yearly open of $20. April has kicked off, and LINK has already surrendered the monthly open at $13.5, a critical level now acting as a brick wall overhead. Zooming out, the trend is unmistakably bearish: lower highs and lower lows dominate the chart. Adding fuel to the fire, LINK is languishing below the Point of Control (POC) at $14.32, derived from a 1.5-year trading range. This is a market screaming caution for bulls and whispering opportunity for bears, at least for now.
But charts don’t lie, and they’re packed with clues. Let’s map out the key levels, pinpoint trade setups, and arm ourselves with a plan that’d make even the most seasoned traders nod in approval.
Resistance Zones: Where Bears Sharpen Their Claws
1.) Resistance - The Golden Pocket ($13.6 - $13.7)
Using the Fibonacci retracement tool on the latest downward wave, the golden pocket (0.618 - 0.65 Fib) aligns beautifully with the monthly open at $13.5. Oh wait there’s more, this zone overlaps with a Fair Value Gap (FVG), making it a magnet for price action.
Trade Setup (Short):
Entry: ~$13.5 (if price tests and rejects this zone).
Stop Loss (SL): Above the recent swing high at $14.4.
Take Profit (TP): First target at $11.85 (swing low), with a stretch goal at $11.
Risk-to-Reward (R:R): A solid 2:1.
The Play: If LINK crawls up to this resistance and gets smacked down, bears can pounce. Watch for rejection candles (e.g., shooting star, bearish engulfing) to confirm the move.
2. Key Resistance - Cloud Edge & VWAP ($15.74 - $16.5)
The Cloud edge of my indicator sits at $15.74, while the anchored VWAP (from the $26.4 high) hovers at $16.5. A break above $16.5 would flip the script, snapping the bearish structure and signaling a potential trend reversal.
Bullish Scenario: If bulls reclaim $16.5 as support, it’s a green light for a long trade. Until then, this is a fortress for bears to defend.
The Play: No bullish setups here yet.
Support Zones: Where Bulls Build Their Base
1.) Support - Swing Low ($11.85)
This is the first line in the sand for bulls. A potential Swing Failure Pattern (SFP), where price dips below $11.85, sweeps liquidity, and reverses—could spark a long trade.
The Play: Watch for a bullish reversal candle or volume spike here.
2.) Major Support Cluster - The Golden Zone ($10 - $11.85)
This is where the chart sings a symphony of confluence:
Swing Low: $11.85.
POC: $11.33 (1.5-year trading range).
Monthly Level: $11.02.
Fib Retracement: 0.886 at $10.69 and 0.786 (log scale) at $10.77.
Psychological Level: $10.
Trade Setup (Long):
Entry: Dollar-Cost Average (DCA) between $11.85 and $10.
Stop Loss (SL): Below $10
Take Profit (TP): First target: $13.5 (monthly open), stretch goal: $20 (yearly open).
Risk-to-Reward (R:R): A monstrous 6:1 or better, depending on your average entry. This is the kind of trade we are looking for!
The Play: Patience is key. Wait for confirmation—think bullish engulfing candles, a surge in volume, or positive order-flow momentum. This isn’t a “hope and pray” trade; it’s a calculated ambush on the bears.
Market Structure: Bears Rule, But Bulls Lurk
Right now, LINK’s chart is a bear’s playground—lower highs, lower lows, and no bullish momentum to speak of. The $16.5 VWAP is the line in the sand for a trend shift, but until then, short trades take priority. That said, the $10 - $11.85 support zone is a coiled spring for bulls. If fear drives LINK into this range, it’s time to load the boat with longs—provided confirmation aligns.
Your Trading Edge
LINK’s 113-day bearish descent is a wild ride, but it’s not random chaos—it’s a roadmap. Bears can feast on rejections at $13.5 - $13.7 with a tidy 2:1 R:R short. Bulls, meanwhile, should stalk the $10 - $11.85 zone for a high-probability long with a 6:1+ R:R payoff. Whether you’re scalping the dips or swinging for the fences, these levels give you the edge to trade with confidence.
So, what’s it gonna be? Short the resistance and ride the wave down? Or stack bids at support and catch the reversal of a lifetime? The chart’s laid bare—now it’s your move. Drop your thoughts below, and let’s conquer this market together!
If you found this helpful, leave a like and comment below! Got requests for the next technical analysis? Let me know, I’m here to break down the charts you want to see.
Happy trading =)

LINK’s Swing Setup Could Push Past $15LINK bounced right off the $10 mark, charging upward toward the monthly open before slamming into resistance around $13.25. But now what?
Let’s break it down — because the next high-probability setup is taking shape, and it’s one you don’t want to miss.
The Current Situation:
LINK is:
Below the Point of Control (POC) of this trading range (~$11.35).
Below the monthly open at $13.5.
Still in a bearish trend on the 4H, showing lower highs.
Facing decent rejection from the monthly level.
We’re currently trading below the weekly open at $12.62, now sitting right on the Value Area Low (VAL) at $12.36. That puts us in a precarious spot and sets the stage for the next move.
Bearish, bearish, bearish. When bullish sir? Staying patient and waiting for a real shift in market structure is key.
The Bearish Play: Liquidity Grab Incoming?
There’s a liquidity pocket waiting below at $11.68, the most recent swing low. If LINK loses VAL and bearish pressure kicks in, this becomes the next logical target.
But here's where things get interesting...
The Bullish Setup: Confluence-Backed Long Opportunity
This isn’t just any random support zone — there’s a perfect confluence stack forming:
Swing low: $11.68
Daily support level: $11.45
Weekly support level: $11.28
POC of trading range: ~$11.35
0.618 Fibonacci retracement lands in this zone as well
That’s four layers of support in one tight cluster. This is where we want to scale into longs.
The Play: Scaling In
Entry: Ladder long positions from $11.68 down to the 0.786 fib (near $11.2)
Stop Loss: Below $10.35 for invalidation
Target: 0.786 fib retracement of the previous downward wave at ~$14.5
R:R: Approx. 3:1, with a potential +30% gain
The trend remains bearish but the chart is setting up a prime reversal zone. Patience is key here.
🔔 Set alerts. Watch for volume spikes. Look for SFPs or bullish engulfing candles etc.
The next move on LINK could offer one of the best swing setups especially since this trade could extend past the $15 mark, putting you ahead of the curve.
💬 Found this helpful? Drop a like and comment below. Want TA on another coin? Let me know and I’ll break it down for you.
Happy trading everyone! 💪

#LINK/USDT
#LINK
The price is moving within a descending channel on the 1-hour frame, adhering well to it, and is heading for a strong breakout and retest.
We are seeing a bounce from the lower boundary of the descending channel, which is support at 12.84.
We have a downtrend on the RSI indicator that is about to break and retest, supporting the upward trend.
We are looking for stability above the 100 Moving Average.
Entry price: 13.33
First target: 13.58
Second target: 13.83
Third target: 14.20

$LINK Chainlink-An Indispensable Part of the Digital EconomyChainlink: A Cornerstone in Blockchain and DeFi
Chainlink ( BIST:LINK ) stands as a cornerstone in the blockchain and decentralized finance (DeFi) sectors, thanks to its decentralized oracle network that bridges smart contracts with real-world data. This article delves into Chainlink's current integration strategies and technological advancements, assesses its position in the competitive oracle market, and anticipates the challenges and opportunities awaiting in the near future. By understanding these facets, stakeholders can better appreciate Chainlink's pivotal role in the rapidly evolving blockchain landscape.
Understanding Chainlink's Integration and Interoperability
Chainlink's integration strategies, particularly through the Cross-Chain Interoperability Protocol (CCIP), have positioned it as a pivotal player in enabling seamless interactions across diverse blockchain environments. This protocol allows for secure and efficient multi-chain communication, facilitating the development of decentralized applications that require interaction with multiple blockchain networks. Among its various applications, CCIP has been instrumental in extending Chainlink’s influence across major blockchain platforms such as Hedera and Ronin .
Hedera's adoption of CCIP highlights its significance, with the protocol being deployed on its mainnet, enabling cross-chain applications over 46+ blockchain networks. This supports the tokenization of real-world assets (RWA) and advances decentralized finance (DeFi) operations, leveraging CCIP's robust security framework and the Cross-Chain Token (CCT) standard for efficient token management . Similarly, Ronin's migration to CCIP underscores the protocol's importance in gaming ecosystems, providing seamless and secure token transfers between Ronin and Ethereum
Beyond technical infrastructure, CCIP’s integration efforts are crucial in the realm of DeFi and RWA adoption. Notably, collaborations with entities like Coinbase and Paxos for the USDO stablecoin incorporate Chainlink's Proof of Reserve mechanism alongside CCIP for enhanced transparency and cross-chain capabilities. This level of interoperability and security is further extended into traditional financial markets through partnerships with Swift and Euroclear, facilitating seamless blockchain connectivity using existing standards.
One of the standout examples of Chainlink’s strategic partnerships is its collaboration with Shiba Inu’s Shibarium. Announced in March 2025, this integration incorporates CCIP, facilitating cross-chain transactions for tokens like SHIB, BONE, and LEASH across 12 blockchains. This not only strengthens Shibarium's ecosystem but also introduces advanced data solutions through Chainlink’s market data feeds, promising a significant expansion in functional capabilities for decentralized finance applications .
Technological Foundations of Chainlink
Chainlink's success in the DeFi ecosystem is anchored in its robust technological infrastructure. Three core components—data feeds, Proof of Reserve (PoR) mechanism, and smart contract automation functions—underscore its technical prowess and reliability.
Chainlink's data feeds are crucial for bringing off-chain information to on-chain environments, providing real-time and decentralized data essential for blockchain operations. These feeds pull from multiple sources to ensure data integrity and reliability, catering to fields like market data, weather information, and more. For instance, Chainlink's BTC/USD feed on the Ethereum Mainnet exemplifies the system's capability in handling critical financial data with accuracy . Through a network of independent nodes that are motivated to deliver precise information, Chainlink guarantees the high security and tamper-resistance of these feeds, supporting substantial transaction values across diverse blockchains .
The Proof of Reserve mechanism stands out as a transformative feature, allowing real-time verification of reserve assets. Chainlink's PoR significantly improves transparency in fiscal environments by enabling institutions like 21Shares and Ark Invest to verify their reserve holdings continuously . This real-time verification negates the need for traditional audits, providing a more fluid and ongoing assurance of reserve backing, essential for applications in stablecoins and tokenized funds .
Smart contract automation, leveraging Chainlink Automation and Functions, is another critical facet that enhances Chainlink's offerings. Automation services, previously known as Keepers, enable contracts to execute autonomously based on pre-set criteria like time schedules or external events . By integrating external API data into smart contracts, Chainlink Functions empowers applications to react dynamically to real-world changes, facilitating complex operations such as automatic fee conversions and stablecoin redemptions .
Competitive Landscape and Market Dynamics
Chainlink stands as a formidable leader in the decentralized oracle market, holding over 80% market share, serving a significant volume of the blockchain ecosystem's contract needs and maintaining partnerships exceeding 1,500, including those with prominent projects like Aave, Uniswap, and Google Cloud . This robust network offers high-value services, ensuring accurate data via technologies such as the Cross-Chain Interoperability Protocol (CCIP) .
However, as the decentralized oracle arena evolves, competitors like Band Protocol , API3 , and smaller emergent players such as RedStone Crypto and Pyth Network strive to capture niche segments of the market. Band Protocol , for instance, provides cross-chain compatibility and provides data feeds across 60 partnerships, although still significantly trailing in comparison to Chainlink's vast ecosystem . Band focuses on specific use cases, offering competitive services for niches like sports data and random number generation .
API3 stands out by employing direct first-party data feeds, eliminating the need for intermediaries which is a major contrast to Chainlink's node-operated model. Although its current market impact is less prominent than Chainlink , API3 's Oracle Extractable Value (OEV) rewards system has incentivized dApps use, successfully distributing substantial rewards to various projects such as Compound .
While these competitors chip at specific market needs, Chainlink strengthens its position by embracing AI integration and maintaining a seamless cross-chain application framework. Its innovative steps into data streaming for sub-second updates and comprehensive AI enhancements further solidify its position as the oracle of choice, capable of handling a wide variety of blockchain needs effectively .
Emerging technologies, such as AI-driven analytics and real-time data services by competitors, suggest intense competitive pressures on Chainlink's foundational strengths. Therefore, Chainlink's continued dominance relies on strategic adaptation, robust technological advances, and maintaining its extensive partner network to combat niche encroachment by these alternative services .
Challenges and Strategic Responses
Chainlink is currently navigating a complex landscape of challenges, from market volatility and regulatory scrutiny to scaling its technical operations. To sustain its growth and maintain its market position, Chainlink must implement strategic responses that address these concerns dynamically.
Market volatility remains a formidable challenge for Chainlink, as the cryptocurrency market is known for its rapid fluctuations. High volatility can lead to unpredictable price swings that affect investors' confidence and market positioning. To mitigate these risks, Chainlink should focus on strengthening its ties within the DeFi ecosystem, ensuring robust integrations with major blockchains like Ethereum, and leveraging its expansive network of 1,500+ partnerships to stabilize its influence and market relevance .
Governmental scrutiny and regulatory compliance are additional hurdles. The regulatory landscape for cryptocurrencies constantly evolves, with heightened focus on transparency, anti-money laundering (AML), and know-your-customer (KYC) standards. Chainlink’s proactive engagement with regulatory bodies, as evidenced by co-founder Sergey Nazarov's advocacy for regulatory clarity around real-world asset (RWA) tokenization, positions the company to influence favorable policy outcomes that support its operational goals . Establishing partnerships that enhance compliance will ensure that Chainlink remains adaptable in a rapidly changing legal environment.
Prospects for Chainlink’s Future Growth
Chainlink is poised to significantly influence the blockchain landscape by leveraging technological innovations and strategic positioning. As the blockchain ecosystem matures, Chainlink’s proactive adoption of advanced technologies like the Cross-Chain Interoperability Protocol (CCIP) will be pivotal. This protocol facilitates secure cross-chain asset transfers and interactions, which are essential for enhancing decentralized finance (DeFi) and enabling enterprise-level tokenization—a key avenue for future growth .
In the ever-evolving blockchain environment, maintaining robust interoperability through CCIP can position Chainlink as a leader in cross-chain solutions. They continue to expand their reach with significant integrations across multiple blockchains, such as Arbitrum, Avalanche, and Ethereum. These integrations underscore Chainlink's growing footprint in decentralized applications, further solidifying their influence in the industry .
Market trend analyses for Chainlink vary broadly, reflecting investor sentiment and anticipated market developments. While some forecasts suggest conservative price estimates for 2025, ranging from $14.17 to $19.74, others project moderate optimism, predicting values between $25 and $39.2 driven by continued DeFi influence and technical innovations . Long-term outlooks are more bullish, with anticipated values reaching up to $181.79 by 2031, highlighting potential substantial growth as Chainlink capitalizes on macroeconomic crypto trends.
My prediction is the same
Chainlink’s decentralized oracle network remains crucial for bridging smart contracts and real-world data, playing a foundational role in supporting not only DeFi but also broader enterprise solutions. The expansion of Chainlink’s integrations and services enhances its capability to harness cross-chain functionality, vital in driving its future success .
Preemptively positioning itself within emerging enterprise dynamics and leveraging cross-chain solutions effectively can ensure that Chainlink maintains a competitive edge. As blockchain technology integrates deeper into various industry sectors, Chainlink's forward-looking strategies, particularly in enhancing interoperability and service expansion, will be key to sustaining its growth trajectory and tapping into new market opportunities over the next decade.
Conclusions
Chainlink solidifies its position as a leader in decentralized oracle services, with strategic integrations and technological advancements fortifying its market presence. While it faces competition and regulatory challenges, its potential for growth remains significant. By maintaining innovation and strategic alliances, Chainlink is poised to navigate future challenges effectively, offering considerable opportunities for investors and stakeholders. The insights discussed underscore Chainlink’s resilience and its continuous influence in shaping the future of blockchain and DeFi ecosystems.
Best regards EXCAVO

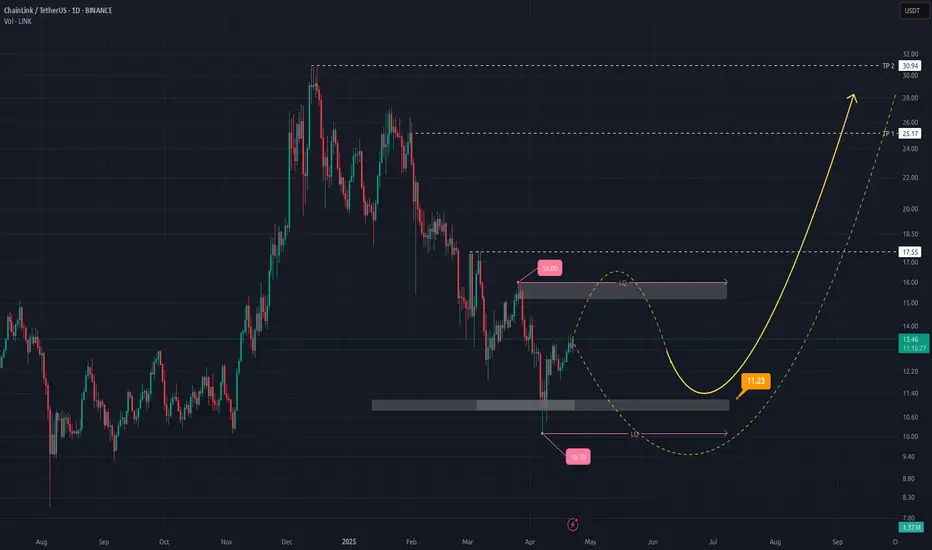
ChainLink (LINK/USD): A Bullish Breakout on the Horizon?Hey there, traders! Let’s take a closer look at ChainLink (LINK/USD) on the daily chart. There’s some interesting action that might point to a bullish move, but let’s break it down with a bit of caution to see if the stars are truly aligning.
Price Action
After a consistent downtrend, we’re seeing a potential shift at $11.23. There’s a bullish reversal candle showing up here, which could suggest buyers are stepping in at this key support level. It looks promising, but we’ll need more confirmation to be sure this is a real trend change.
Volume
The volume at this reversal point is picking up, which is a good sign—those bars are taller than the recent average. This might mean stronger buying interest, but it’s not a massive spike, so I’d keep an eye on whether this volume trend continues to support the move.
Pattern
Looking at the bigger picture, it seems like a cup-and-handle pattern could be forming. The price has rounded out (the “cup”) and is now consolidating (the “handle”). If LINK can break above the $16.00 resistance, we might see a bullish breakout—but this pattern isn’t fully confirmed yet, so let’s stay alert.
Potential Targets
If we do get that breakout, here’s what we might aim for:
TP1: $24.17 – A possible first target.
TP2: $30.04 – Could happen if momentum builds.
TP3: $32.00 – A stretch goal, but only if the bulls really take charge.
Key Support
The $11.23 support is our critical level to watch. If the price drops below this, the bullish setup could be in trouble, so let’s not get too ahead of ourselves.
Wrap-Up
We’ve got a reversal candle, some increased volume, and what might be a cup-and-handle pattern forming, so LINK could be setting up for a bullish move. But it’s not a done deal yet—breaking above $16.00 will be the real test. If you’re thinking of jumping in, set a stop-loss below $11.23 and manage your risk carefully. What do you think—could this be the start of something big? Let’s watch and see! Happy trading! 🚀
LINKUSDT 1D AnalysisLINK ~ 1D Analysis
#LINK Buy after successfully penetrating this resistant line with a short -term target of at least 10%+.

Chainlink Next Target $43, A 222% Profits Potential RiseChainlink is starting to recover. After producing a long-term higher low, it is now trading at the highest price on a rise since November 2024.
The entire consolidation range of late 2024 has been left behind. LINKUSDT remained within these levels for two weeks and is now finally trading above it. Bullish territory for sure.
Now, Chainlink has been producing higher highs and higher lows both based on candle wick and candle close, this leaves room for no doubt as to where prices are going next.
When looking at some of the other pairs, with lower highs and lower lows, we have to find supporting signals that predict additional growth. Like high trading volume being a good example.
Here we do not need to look for these signals as the trend is clearly identifiable. It means that Chainlink is strong in relation to many other pairs.
A strong chart, a strong pair can produce a strong All-Time High when the time comes.
Say the $43 target is only a mid-term one, within the next 1-3 months, but there will be more.
The 2025 bull market is likely to go until late 2025 or even beyond, early 2026. With this in mind, the target shown on the chart can be considered easy, this is only the first step.
After this target is reached, we are likely to see a correction, a mild one, followed by additional growth. We will adapt to the market if conditions change.
The most important part is to buy when prices are low, in this way, we can hold easily when strong shakeouts and retraces develop out of nowhere. We are going up.
This is a good pair, a good project, a great chart. Buy and hold.
Namaste.

Chainlink vs Bitcoin: Trading Disaster Or Buy Opportunity?Spoiler alert! It is a buy opportunity.
Good evening my fellow Cryptocurrency trader, how are you feeling in this wonderful day?
I know what you are wondering. You are wondering...
This is an amazing opportunity that I am showing to you in the form of a chart. It is a chart but the chart is not the opportunity.
It is a trade but the opportunity is not in the candles or the information I am about to share, the opportunity is all about you and how you choose to behave.
The opportunity is only real if you decide to take action.
I'll just translate the chart and I'll let you figure out the rest.
An all time favorite, Chainlink here is paired against Bitcoin rather than the US Dollar, so LINKBTC is the trading pair.
The chart here is a long-term one and is saying two things mainly that are of interest to you and this opportunity that you are about to take:
1) There is no more bearish action. The bottom is in.
2) There is strong potential for growth. The market will grow.
These are the main points that are compelling me, attracting me and telling me to please tell you to buy up this coin. Only if you are into Crypto and looking at Crypto to make money, to collect profits and while you grow, become rich and have some fun.
Chainlink is about to grow. This is true of LINKBTC as it is true for LINKUSDT.
This chart is now at the bottom and it cannot go any lower. Bottom prices won't last long.
Where are you?
Look at the chart and take action —buy and hold.
Thanks a lot for your continued support.
Namaste.

LINK/USDT 8H - targets and stoplossHello everyone, let's look at the 8h chart LINK to USDT, in this situation we can see how the price has come out on top from the local downtrend line and how it is currently moving in a local sideways trend.
Let's start by defining the targets for the near future that the price has to face:
T1 = 12.65 USD
T2 = 13.13 USD
Т3 = 13.87 USD
Т4 = 14.40 USD
Now let's move on to the stop-loss in case the market continues to fall:
SL1 = 11.91 USD
SL2 = 11.05 USD
SL3 = 10.36 USD
SL4 = 9.66 USD
The MACD indicator shows an attempt to return to the uptrend, but here we can see a struggle that gives a sideways trend on the chart.

LINK Potential Falling Channel Reversal + RSI SignalsBINANCE:LINKUSDT has been in a downtrend since December, grinding inside a falling channel for 2 months, and it's now sitting right above the key ~$10.00 demand zone.
Price Action
• Price is respecting both bounds of a well-defined falling channel.
• Currently consolidating just above the demand area, early signs of potential strength.
RSI Insights
• Clear bullish divergence at demand zone retest.
• RSI could be approaching a breakout of its multi-month downtrend — worth watching closely.
Key Zones
• Support: $9.5–$10.5 is critical. It held last time and could fuel a reversal. If broken, it would invalidate the setup.
• Resistance: Falling channel upper boundary.
• Confirmation: RSI breakout + channel breakout = potential confirmation of trend reversal.
Also watch $15.5-$16 (previous S/R) and the whole $18-$20 area, which previously acted as support and has a high volume traded. Both could be good levels to take profits, together with the main supply zone in the $25-$27 area.
Still in a No-Trade Zone until a breakout is confirmed.
