Link LINKUSDT - Elliot Wave analysis + ChannelWe are currently in this parallel channel with 5 waves completed to the downside. This recent move to the upside is very bullish based on structure and how this coin pumped. Main resistance is 13.2 and 0.618 fib level.
If you like this technical analysis , please hit the like button and follow me for more of these ideas!
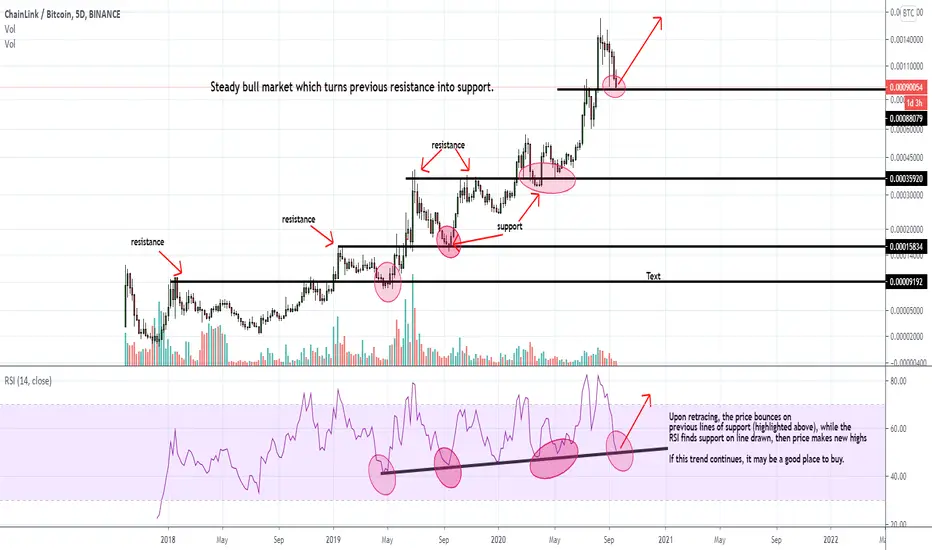
LINKBTC

Dow three market phases on CHAINLINK.The primal trend based on the weekly chart is bullish
The second trend is bearish since the price is down-trending
The third trend is bearish as well


Link in Ascending Triangle! Link is in ascending triangle which has bias to break to the upside in uptrend.
I am looking to buy at the uptrend line.
My targets are:
$12 - 13%
$13.04 - 22%
Good luck with this trade!
Tibor


Link in Ascending Triangle! 20% Profit.LINKUSD - Short Term
We are looking to buy at the uptrend line or buy the breakout.
Trade will be canceled if the uptrend line get's broken.
Our outlook is bullish.
We are trading within a Bullish Ascending Triangle formation.
A break of 11.230 is needed to confirm follow through bullish momentum.
The bias is to break to the upside.
Our profit targets will be 11.860 and 12.458
20 and 50 EMA uptrend is active.
Resistance : 10.800 / 11.230 / 11.850
Support: 10.500 / 10.100 / 9.905
Signal Centre

#LINK USDT Breakout Again !Entry Between : 8.9$ - 10$
TP1 : 13.7$
TP2 : 17.5$
TP2 : 20$
Stop loss : 7$
Risk/Reward : 17%/130%
Don't forget about risk management
Please support the idea by pressing the Like button

LINKBTC MOVES DOWNThe exact day when BTCUSDT reached its 2020 high (16 Aug), LINKBTC has started its downtrend. This trend seems to be fit well in the channel as the chart presents. If the price do not penetrate the trendline and falls again, we will see the LINKBTC price around the channel line during a few days ahead with some probable pause and retracement on sup/res lines. By the way, an increase in volume around the trendline make sense!

LINK following our channelIf you like my TA or other ideas, please leave a like to show support. It helps me out a lot
-------------------------------------------------------------------
- 4th big retest of the lower channel
- Rally towards the middle
- Strong resistance around $10.2
If we break $10.2, we could see further movement towards the top o/t channel @ $11.5. After which, we could see:
- a breakout (w/ a nice amount of volume) and a continuation towards the next resistance @ $13
- a rejection and again a move down towards the bottom of the channel
If we hold $10.2, I would be looking to short with my target just before the bottom of the channel and my SL @ $10.5
Safe trading Marines

Chainlink buyers are coming back!Chainlink seems to have bottomed at 7.2869 as Pivot suggest and also daily support area
Looking more at daily, MACD is in third selling wave which ussualy means that sellers are satisfied enough.
Daily candle has a good possibility of bullish engulfing if the price closes above $8.75 per Link.
Looking at current hourly chart, the price seems to be forming a flag with a bullish outcome.
It's important to break $9, then Link can easily go all the way up to $9.92 which is 12% from the top of the resistance area and then to $10.3 which is 17% from the top of the resistance area.
Indicators looks good, $9 is the key level to break.
Good luck!
Tibor

LINK fell major Fib and bounced!LINK came back for a retest. ($8.8-$9.0)
Maybe it will not look back at this fib ($7.5) again.
Really need to hit that fib above, without touching the fib ($7.5) below again.

LINKUSD UPDATES! Gaining Strong Momentum!Chainlink Getting Momentum Here!
A Chance to Breakout But Must Hold $9.5..
Notes To Consider:
- Still on The Downward Channel
- Slightly Overbought, Consolidation is what we are aiming for and not a Dump.
- We are Under 200 MA which is a strong resistance to break
- Rejected by initial attempt to break $10.5
LET ME KNOW WHAT YOU THINK! 🧐
💡 IF YOU LIKE MY IDEA, PLEASE HELP AND SUPPORT MY CHANNEL BY
HITTING THE THUMBS UP, LEAVING A COMMENT AND FOLLOWING 💯
*You are Welcome to Request Chart Analysis at Anytime! Simply Comment Down Below or DM Me :)
````````````````````````````````````
⚠ DISCLAIMER:
Trading Involves High Risk! Be Responsible For All Your Actions.
This Chart is Used for Educational Purposes Only And NOT A Recommendation to Buy or Sell the Asset.

LINKUSD Downtrend Channel Still In Play Remember My LINKUSD Chart a couple of days ago? Well it's playing out exactly how we are expecting it!
We are hovering around Low $8 I'd hold all the shorts and wait for another trend confirmation. We will consolidate on this levels for now.
Remember: LINK is STILL on a downward Channel. Resistance that needs to be broken is AT LEAST $9.5
LET ME KNOW WHAT YOU THINK!
IF YOU LIKE MY IDEA, PLEASE HELP AND SUPPORT MY CHANNEL BY
HITTING THE THUMBS UP, LEAVING A COMMENT AND FOLLOWING :)
````````````````````````````````````
⚠ DISCLAIMER:
Trading Involves High Risk! Be Responsible For All Your Actions.
This Chart is Used for Educational Purposes Only And NOT A Recommendation to Buy or Sell the Asset.

LINKUSDT STILL IN CORRECTIONI think that´s gonna be the next movement, maybe take a few days with bounces between the supports. Take care of your investment.
Isn't a financial advice! God bless you and take a breathe! :)

Link in the 7's should hold - love the chartLove the look of this beast, wanted to FOMO higher and glad I decided to wait until here. DXY nearing major resistance, crypto should start doing well here soon ish, great longterm buy here I think.

LINK huge support, huge buy signalTA: 1. EMA 200 on daily
2. huge support area
3. falling wedge pattern
4. huge buy signal
Time to load up .... ChainLink is amazing project ...

LINKBTC Time to start buying in two stagesUnfortunately a lot of traders rushed into LINK and bought the August top when in fact there was no confirmation on the long-term charts (1D) neither from the MA200 or the RSI. What do I mean by that? Traders who follow me know that I've been a LINK buyer for a few years now but only on the right levels, as I've been posting on my studies, including those below:
As seen on the chart, every time LINKBTC makes an All Time High ( ATH ), the price pulls back below the previous ATH and touches (some times marginally breaks) the 1D MA200 and then rebounds to make new ATH. The sequence has been repeated several times since 2018, solid enough to make it a reliable pattern. However on the High of July 17, the price rebounded without touching the previous ATH of 0.000566 nor the 1D MA200. So there is a gap to fill there and in fact currently is getting too close to the 1D MA50. Whether it rebounds there or actually touches the ATH too, we can't know, but both definitely make low enough levels to buy. On top of that, the MA200 bottoms have coincided with bottoms on the RSI. As you see the RSI is currently on tha clear Buy Zone.
Take advantage of the above factors and jump on the wagon on time for the most optimal risk/reward ratio.
** Please support this idea with your likes and comments, it is the best way to keep it relevant and support me. **
!! Donations via TradingView coins also help me a great deal at posting more free trading content and signals here !!
Shout-out to TradingShot's top TradingView Coin donor this week ==> billstenzel
## Also if you are not a TradingView user yet, I encourage you to do so and upgrade to a premium plan in order to use the same tools I use and enjoy this high level charting experience! ##
Click ==> HERE <== and upgrade to a TradingView premium plan !!

LINKBTC IDEAI think LINK is re-testing it's long term trendline on weekly time frame.
Rsi is sitting on its own trendline. I expect a bounce from here if BTC remains calm (which is not looking good).
Not a financial advice. Just my two cents.

LINK USDT-Demand zone
- Channel EQ
- Potential Hidden bullish divergence
Demand zone entry: 6.9 - 8.1
But if we drop through the Weekly demand zone, I expect a dump to 4-5 dollars.

LINKUSD, Bitcoin Structure repeating itself? Fractal, BullishLINKUSD;
Inverse HnS, followed by a falling wedge.
That was Bitcoin's market structure just when it revered from the bear market.
Except LINK has taken 16 days to do what took bitcoin 79 days to complete.
Will the fractal repeat itself?

LINKBTC - 4H🙈 Locally watching a falling wedge. Price tested it successfully. I will try to enter long with the goals indicated on the chart

Link (ChainLink) is close to ...Correction on the Way. But Then a big Growth.
Of course coin is BIG.
MC Heavy. So. Its take a time to get that aims/
Only for those, who have a patience/
actually im waiting for a Black Swan on the Market.
So. Be careful.
it will take a time to get this aims, so if you have better investment idea - use it!!!
Cheers/
