LINK more evidence for support around 10Channel up shows a touch of the middle of the trend
This is highly possible a bounce area for LINK
Looks good
Original post
LINKBTC

$LINK, On high volatility with 20% daily candles$LINK
On high volatility with 20% daily candles
~120k/94k levels I'm watching as resistance/support..
UCTS is bearish on the daily and lower tfs // Ichi cloud matching support
BTC will have a great influence so unless you are already short wait for some consolidation
#LINK

$LINK - Following a bubble pattern - The sotory continuesA few weeks ago I had this feeling $LINK is following a typical bubble pattern. It was not believed, however it still is valid to me. We are at a crucial point however. Will $LINK manage to get back to the mean? And possibly cross the 200MA again? Interesting. For now I am just studying this chart before taking a position.

Link Update Link is supported by 100 EMA on daily and is moving in descending channel which is a bullish pattern.
Bullish and Bearish targets are posted and trades can be opened based on the break out or rejection of the upper trend line.

Link on an 8 hour. Brief rebound then looks like a long decline.Link looks like itll have a quick rebound before starting a decline that looks as if itll find a bottom around Oct 18th. If you look back at my pass charts, where trend lines cross almost always seems to signal a reversal. The sizes of the reversals vary but seem to be larger where more trend lines intersect. Oct 18th is loaded with trends overlapping, all of which are trends based off the largest movements of volume within the time periods contained within the trend.
I do not suggest a short here however as the crypto market in itself tends to suggest the opposite of what link here is showing and link also has a very active retail community who could take advantage of any dips to bolster the price. This is more a suggestion of caution if contemplating a long, as well as potentially a guide to help determine a buying point if the price follows the chart from now until Oct 18th. That being said, I only short on very short time frames, so if your a long term shorter you probably know what your doing and can disregard this.
Also, on the link chart I posted earlier today comparing the 1hr to the 30m, you can see that the peaks on the 1hr are in a decline and the peaks on the 30m are on an incline, which suggest that there is more support in this cycle when relatively compared to the last.
That means there is evidence of both a potential breakout and a potential dump. However it is always healthy to have a good retrace before attempting new all time highs and I dont see link breaking $21 unless it goes through a healthy correction first.

Turkish Baklava Pattern-The Time is Coming-LINK/BTCIt has found support, the possible leap will be very soon.

Chainlink ready for possible longterm bullrun, 3 scenariosThree entry points based on time and price, price was derived from horizontal support analysis, time was derived by diagonal trendline analisys
Upper longterm target is just a guess based on psychological significance, $LINK could very well reach 0.01 BTC instead of 0.005
This is a longterm analisys, for the time being the outlook is neutral

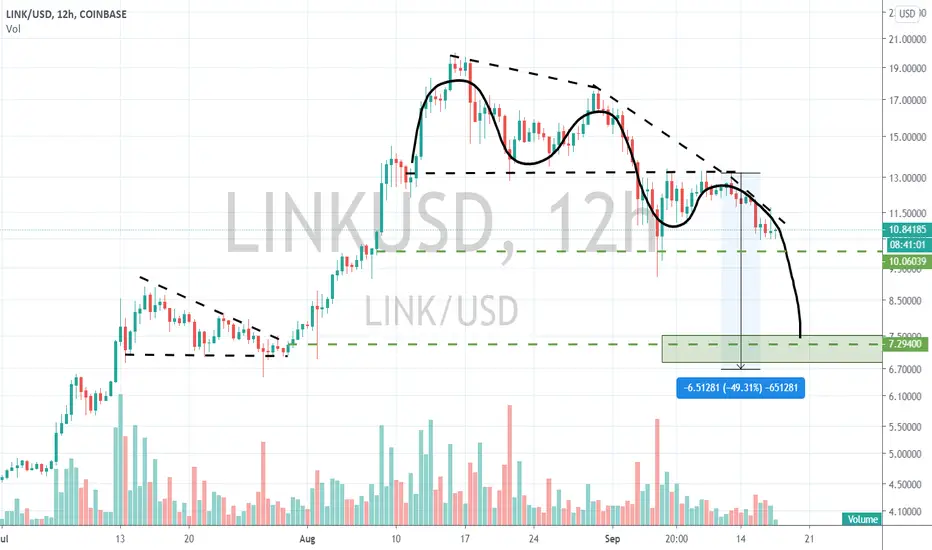
Two scenarios for LINKIf you like my TA or other ideas, please leave a like to show support. It helps me out a lot
-------------------------------------------------------------------
S/R scenario:
- LINK is ranging between $13 & $10.5
- It finds support @ $10.5 and moves up, either to break through $13 towards $15 or to test resistance for the fifth time at $13
Channel scenario:
- Link is ranging in a downward channel
- It can find support in the middle of the channel (matches with the $10.5 level) and moves up towards the top of the channel.
- Or LINK doesn't find support in the center and breaks further down in which case we could be seeing $6 LINK very soon.
What is your opinion on this pair?

link is going to die ?!
🌴FREE COIN ANALYSIS🌴
💎Poor $LINK going to see more blood soon. 4H closed below the swing low. Aligns with the idea of more altcoin blood to come.
💎 BTC dominance seeing a rise over the last 48h ( weekly open ) as Bitcoin seemingly outperforms the market (but does not look good as well no more). Immediately this can be interpreted as bearish for altcoins, especially if we start to see a run-up towards resistance at 64%. Presently, we don't recommend buying new alts as they are likely to keep dropping against bitcoin.
💎Stay safe✅😎

LINK Fib Circle SupportSupport zone for link
Buy zone in green
Currently within
Descending Broadening Wedge


LINKUSD - looking very BULLISH with possible bottom in placeDuring the past months LINK experienced something called a blue sky breakout. The drop from last month was expected as traders need to create new supports/resistances to trade out of (look at TESLA for example). As seen from the chart, it is showing very strong signs of recovery and a bottom from monthly trend-line.
Watch price action at current levels, if it breaks, we may experience another shake out. Keep an eye on 15$ (if it reaches it) to a possible rise back to 20$.
TP levels 15-20$
Remember trade what you see and not what you think, being emotionally invested in anything is not a good idea.
Not a financial advisor, trade at your own risk.

LINK might drop furtherIf you like my TA or other ideas, please leave a like to show support. It helps me out a lot
-------------------------------------------------------------------
- Heavy resistance tested three times
- Ascending triangle, which is usually a continuation pattern
- Next support zone is around $10

LINK USDSideways chop followed by breaking through of the descending resistance line. Re-test this then you are looking at 20 dolla real quick. It will be psychological barriers thereafter... $25, $30, $40, $50 etc.
The Content is for informational and entertainment purposes only, you should not construe any such information or other material as legal, tax, investment, financial, or other advice. This is not financial advice nor am I a financial adviser. :)

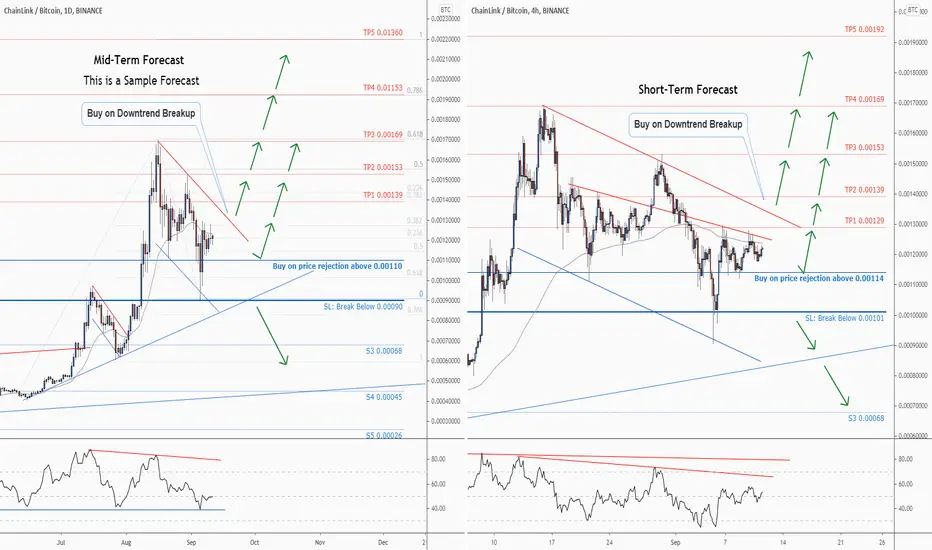
Two buy opportunities on this chart for LINKBTCMid-Term Forecast
Trading suggestion:
". There is a possibility of temporary retracement to suggested support line (0.00110).
. if so, traders can set orders based on Price Action and expect to reach short-term targets."
Technical analysis:
. LINKBTC is in a range bound and the beginning of uptrend is expected.
. The price is below the 21-Day WEMA which acts as a dynamic resistance.
. The RSI is at 50.
Take Profits:
TP1= @ 0.00139
TP2= @ 0.00153
TP3= @ 0.00169
TP4= @ 0.01153
TP5= @ 0.01360
SL= Break below S2
---------------------------------------------------------------------------------------------------------------
Short-Term Forecast
Trading suggestion:
". There is a possibility of temporary retracement to suggested support line (0.00114).
. if so, traders can set orders based on Price Action and expect to reach short-term targets."
Technical analysis:
. LINKBTC is in a range bound and the beginning of uptrend is expected.
. The price is below the 21-Day WEMA which acts as a dynamic resistance.
. The RSI is at 52.
Take Profits:
TP1= @ 0.00129
TP2= @ 0.00139
TP3= @ 0.00153
TP4= @ 0.00169
TP5= @ 0.00192
SL= Break below S2
❤️ If you find this helpful and want more FREE forecasts in TradingView
. . . . . Please show your support back,
. . . . . . . . Hit the 👍 LIKE button,
. . . . . . . . . . Drop some feedback below in the comment!
❤️ Your Support is very much 🙏 appreciated! ❤️
💎 Want us to help you become a better Forex trader ?
Now, It's your turn !
Be sure to leave a comment let us know how you see this opportunity and forecast.
Trade well, ❤️
ForecastCity English Support Team ❤️