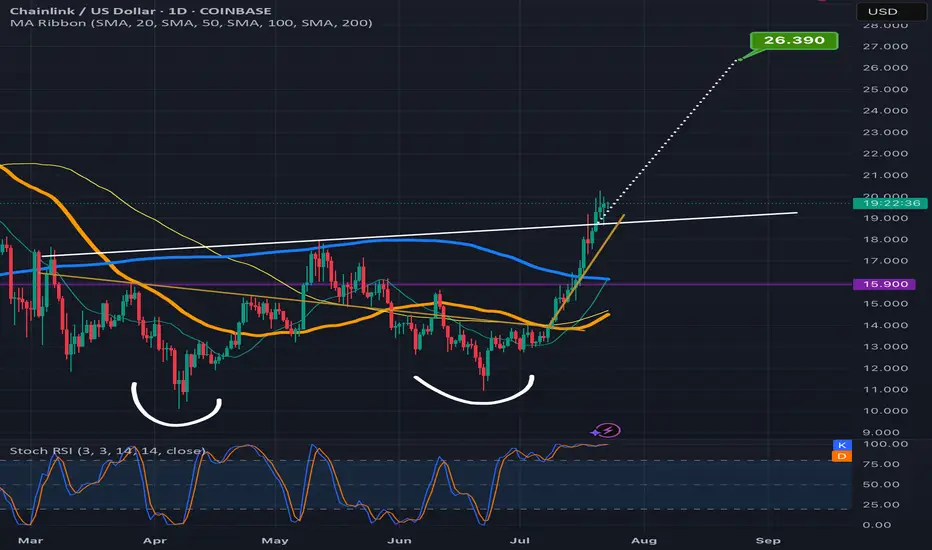
Chainlink climbing the measured move line staircaseLooks like Chanlink is ready to confirm the double bottom breakout here as the past few candles have already started to climb up the measured move line like a staircase.Always possible for a dip back below the neckline at this point but probability slightly favors the readout being validated instead for now. *not financial advice*
LINKUSD
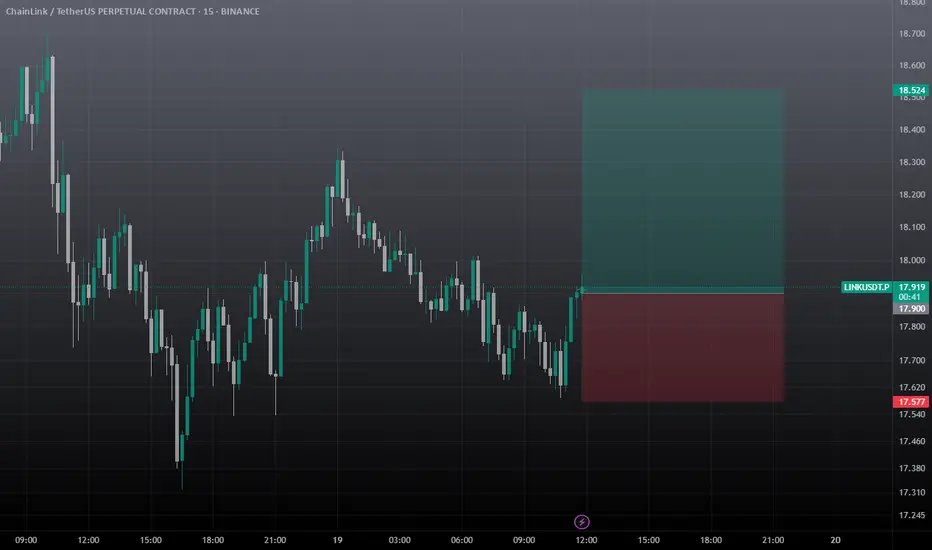
Link Scalp Trade IDEA / Long Scalp Setuplink looking to take out 18.5 area. can take at cmp 17.91, must use sl, it's a scalp trade so don't hold it for long time.
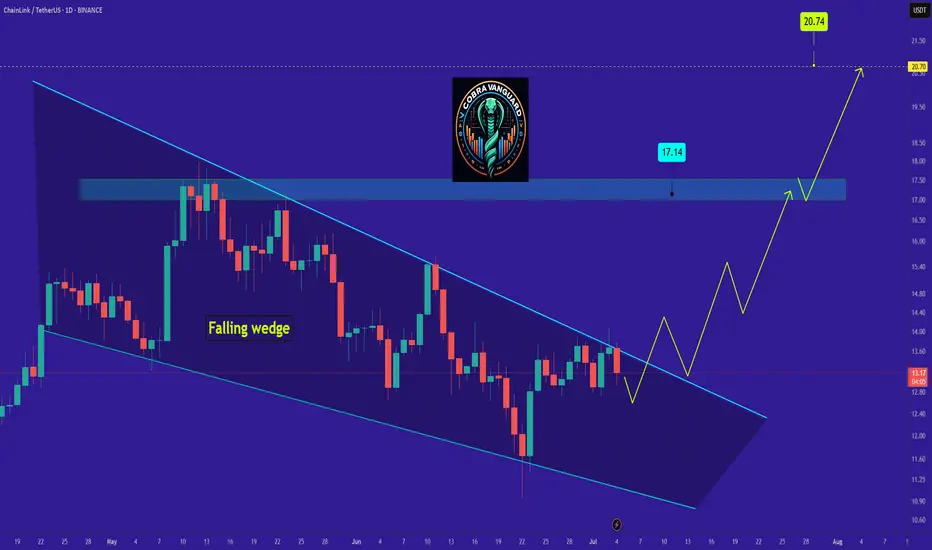
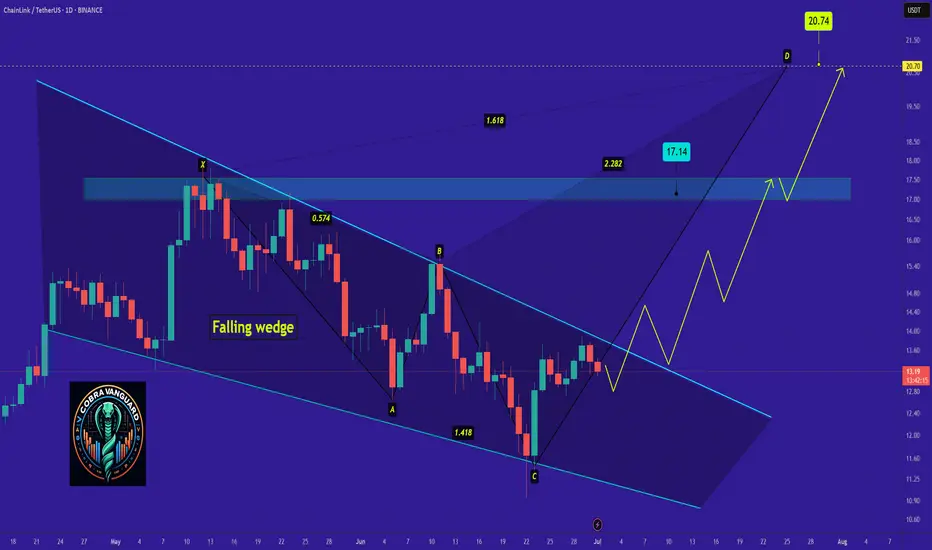
LINK's Situation, A Comprehensive Analysis !!!So if you pay attention to the LINK chart you can see that the price has formed a Ascending wedge which means it is expected to price move as equal as the measured price movement.( AB=CD )
NOTE: wait for break of the WEDGE .
Best regards CobraVanguard.💚
Wings of Opportunity: LINK’s Harmonic Setup Unfolding🦋 Title: A Butterfly on the Edge – But Only with Confirmation
On the 2H timeframe, a Bullish Butterfly Harmonic Pattern is unfolding. The wave structure (X → A → B → C → D) aligns closely with harmonic principles, and point D lies above X, within the 1.27 to 1.618 Fibonacci extension of XA — reinforcing the pattern’s validity.
📌 No entry has been triggered yet.
We are currently waiting for price to break and hold above the key resistance at 13.60 to confirm the bullish scenario.
🔹 Bullish Scenario (our primary and preferred outlook):
Given the strong reaction around the 12.74 demand zone and the harmonic structure completion, we are primarily focused on a long opportunity, if and only if confirmation is achieved above 13.60.
📥 Entry Zone: 13.05 – 13.65
🎯 Target 1: 17.94
🎯 Target 2: 18.76
🛑 Stop-Loss: Below 12.74 (structural invalidation)
🔻 Alternative Bearish Scenario:
If price fails to break 13.60 and instead loses the 12.74 support, the bullish setup becomes invalid, and the market could enter a deeper correction phase.
Potential downside targets in that case:
📉 11.80
📉 10.90 – 10.30 (if bearish momentum continues)
📊 Risk Management Notes:
Position sizing should not exceed 1% of total capital
Avoid early entries before confirmation
Prefer partial entries after breakout and retest
Stick to the invalidation level strictly
📈 While both scenarios are on the table, we are currently favoring the bullish setup, as long as price action supports it. Discipline and patience are key — confirmation first, trade second.

LINKUSDTThis is chart ready for pump but wait for break 14$. BINANCE:LINKUSDT
I in below say best supports and resistance's.
Support:
12.66
11.50
10.50
resistance's:
14
16.68
17.70
⚠️Contorl Risk management for trades.

LINKUSD - Possible Correction from Channel ResistanceStructure: Ascending Channel
Indicators: RSI Overbought, Bearish Divergence Forming
📌 Confirmation:
Look for:
A strong bearish candle or
RSI breaking below 60
Volume divergence
Bias: Short-term bearish correction, bullish structure intact as long as price holds the channel.

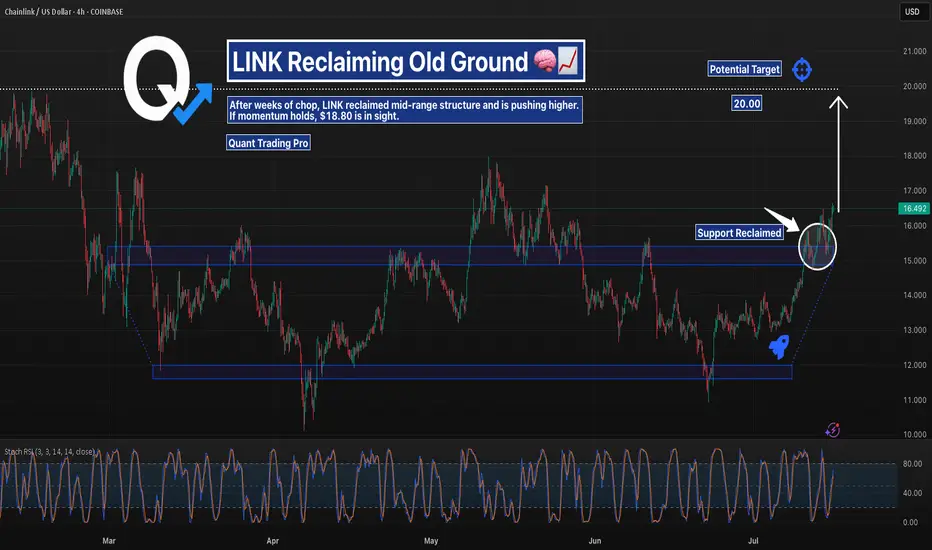
LINKUSD – Mid-Range Reclaim | Push Toward $18-20?Chainlink has reclaimed the mid-range supply zone between $14.50–$15.50 and is now pushing higher.
The structure looks clean with a potential target near $18.80 if bulls maintain strength.
Key support now sits around the breakout zone. Watching for continuation or a failed retest.
#LINKUSD #Chainlink #RangeBreakout #SupportResistance #QuantTradingPro #TradingView
Chainlink Just Broke Out — Is $30 The Next Stop?After nearly 250 days of compression inside a falling wedge, Chainlink has officially broken out. The chart shows a textbook breakout with clean structure, higher lows, and a confirmed break of structure (BOS). A retest zone between $12.8–$14.0 could offer a “buy the dip” opportunity before any continuation.
With momentum shifting and sentiment improving, bulls have eyes on the $30 target — a prior high and wedge-measured move. This is a breakout you don’t want to ignore.

"LINK - Time to buy again!"So if you pay attention to the LINK chart you can see that the price has formed a Ascending wedge which means it is expected to price move as equal as the measured price movement.( AB=CD )
NOTE: wait for break of the WEDGE .
Best regards CobraVanguard.💚
LINK/USDT Chainlink Gearing Up for a Major Breakout?
🧠 Overview:
The LINK/USDT chart is showcasing a high-conviction technical setup — a well-defined Descending Triangle that has been forming for over 6 months. This pattern often acts as a pressure-cooker scenario, building up momentum before a major breakout.
The triangle is composed of consistent lower highs pressing against a strong horizontal support zone at $12.5 – $13.2, which has been tested and held multiple times since February 2025.
Currently, the price is approaching the apex of the triangle, signaling that a breakout is likely imminent.
📐 Pattern Details – Descending Triangle:
🔻 Descending Resistance Line: Connecting lower highs since the January 2025 peak.
🟨 Flat Support Zone: The $12.5 – $13.2 level has served as a strong demand zone.
⏳ Apex Nearing: Price action is compressing, and breakout pressure is building.
📉 Decreasing Volume: Volume is drying up — a classic precursor to a breakout move.
✅ Bullish Scenario (Breakout):
If LINK breaks above the descending trendline and reclaims resistance around $14.00 – $15.44, the chart could ignite a strong upside move.
🚀 Bullish Targets:
1. $15.44 (first key resistance & breakout validation)
2. $17.44 (prior structure resistance)
3. $19.38 (swing high from Q1)
4. $26.58 (major resistance zone)
5. $28.00 – $29.35 (long-term upside target)
📌 Breakout Confirmation: Look for high volume and a successful retest of the breakout level to confirm bullish momentum.
❌ Bearish Scenario (Breakdown):
If LINK fails to hold the $12.5 – $13.2 support zone and breaks below it with strong volume, downside risks increase significantly.
⚠️ Bearish Targets:
$11.00 (minor support)
$9.50 (next demand zone)
$8.00 (macro support from 2023)
A breakdown from this triangle would invalidate the bullish setup and could trigger a broader bearish continuation.
🧩 Conclusion & Strategy:
📊 Pattern: Descending Triangle
🕰️ Formation Duration: 6+ months (strong reliability)
🟨 Critical Zone: $12.5 – $13.2 = Key Support
📍 Breakout Trigger: Above $15.4
🔍 Breakdown Trigger: Below $12.5
📌 Trading Ideas:
🔼 Long Position: Upon breakout above $15.4 with confirmation
🔽 Short Position: Upon breakdown below $12.5 with increased volume
📚 Bonus Insight:
Chainlink remains one of the most widely adopted oracle solutions in DeFi and enterprise blockchain. A technical breakout from a long-term consolidation like this could attract both retail and institutional capital.
#LINKUSDT #Chainlink #CryptoBreakout #DescendingTriangle #Altseason #TechnicalAnalysis #BullishSetup #CryptoSignals #TradingView #AltcoinSetups

Final $LINK in the corrective chain?If you find this information inspiring/helpful, please consider a boost and follow! Any questions or comments, please leave a comment!
LINK could be finishing a double zigzag correction. Recent reaction at the channel’s most likely target area shows promise. Watching for an internal retrace that holds above key support.
Key Levels:
11.81: Ideal retrace floor
11.00: Break kills impulse idea
13.25: First upside flip needed
15.00: Big level to break for bulls
Bulls have been tricked before with possible impulse starts. This one has the right look and confluence, but caution is warranted. Ideally, we get consolidation and push above 13.25 to build confidence in further upside.
As long as price holds above 11.81 and builds higher lows, potential remains for an impulsive move up. Break below 11 and bias flips back to bearish continuation.
Trade Safe!
Trade Clarity!

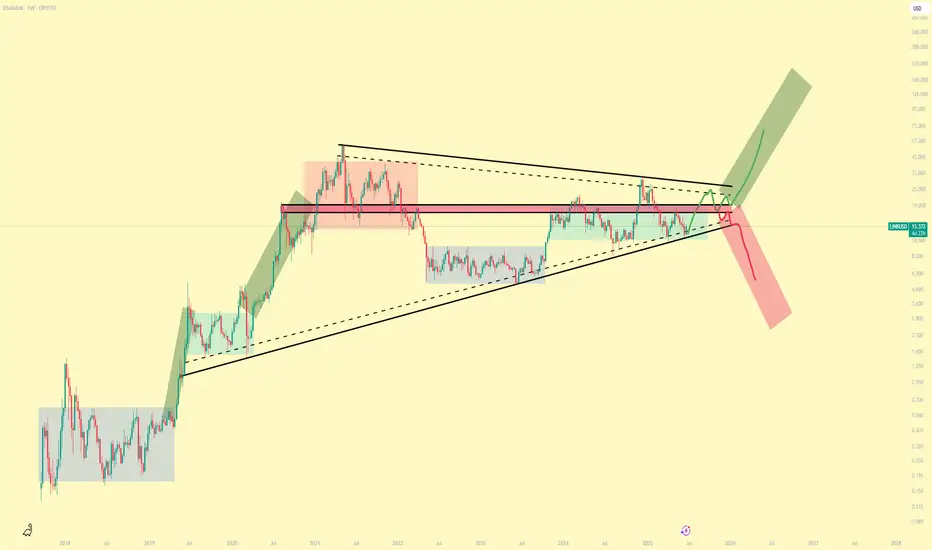
LINKUSD Paths on OfferPretty clear accumulation stages going on and so I am inclined to think we head towards the Bullish path to ~$100
Bears will want to buy LINK at massive discounts and so perhaps we do see some capitulation before our next mark-up phase.
However, the current Total Market cycle patterns, along with the BTC pairing, almost rule out the possibility of further downside, or at least major downside.
LINK MARINES are becoming a dwindling force.It was likely a fabricated tag solely for Crypto Twitter, conceived by early ICO investors. Something to rally a war cry behind.
Similar to the LINK Crypto dominance chart.
There’s a continuation head & shoulders pattern with a logarithmic target indicated.
Indeed, the token might increase in dollar value.
However, with 700 employees to compensate through token sales,
The salaries are excessive given the stagnant growth of token holders, and I must say, the decline in holders over the years makes it difficult to sustain the price/valuations.
If a #DEFI season was to occur, I would probably take advantage and unload old bags into the pumps.

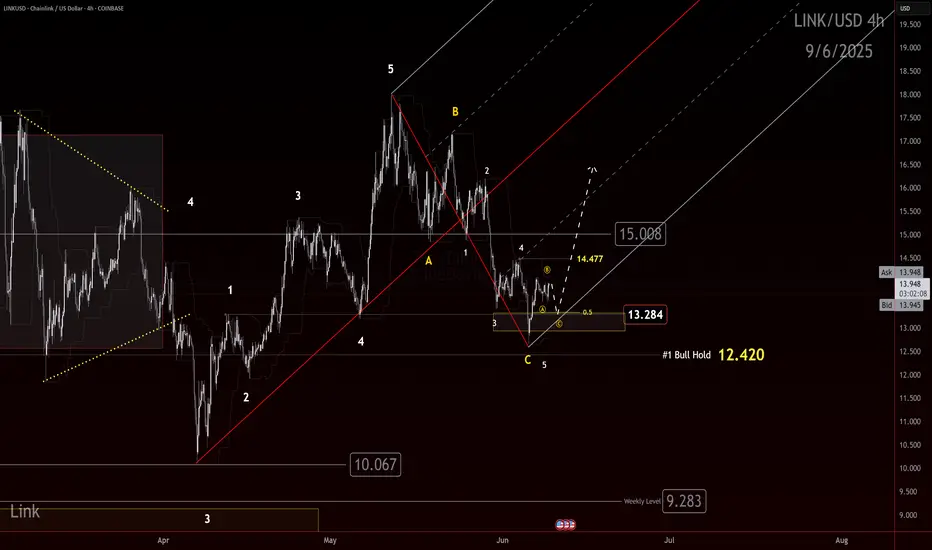
LINK Bulls Building Toward a Chain ReactionIf you find this information inspiring/helpful, please consider a boost and follow! Any questions or comments, please leave a comment!
LINK just gave us a clean reaction out of an identified box. Bulls may finally be gaining control and a trend shift up is on the table.
We had eyes on this box for a potential reaction. The market delivered. Now bulls need to prove they can build on it. The first key is to defend 13.284. As long as this level holds, the case for a higher trend remains alive.
Next, bulls need to clear 14.47. That is the first smaller degree LH that must be taken out to confirm that buyers are pushing through the structure.
The big step remains 15.00. This has acted as a major flipping level. A true test for the bulls will be whether they can reclaim and hold above it. If they do, the door opens for stronger upside follow through.
The path is clear:
💥 Hold 13.284
💥 Break 14.47
💥 Reclaim 15.00
We will continue to track this closely with the Elliott Scanner mindset. If momentum picks up through these levels, this could become an attractive higher-degree setup.
Watch these levels carefully. Bulls have work to do, but the ingredients for a shift are building.
Trade Safe!
Trade Clarity!
Link Correction complete? CRYPTOCAP:LINK Correction Nearing Completion? Key Levels to Watch
Recap
CRYPTOCAP:LINK continues to retrace and lose levels. Price action looks a bit incomplete on the Elliott wave side, but technicals suggest the retracement may be nearing its end.
The Setup
The cleanest scenario would see price make one more leg down into the 12.42 area. That level offers symmetry and structural balance for a completed correction.
If instead price breaks above 15.008, it opens the door for the correction to be considered complete. Still, confirmation would require a strong reaction from that move—not just a quick wick.
The Outlook
A defense of 12.42 would keep the bullish scenario alive. A break below that level, however, would weaken the outlook and raise the probability of an extended correction or trend continuation lower. Namely an impulsive move down. Right now, we have a potential correction, we need the PA to provide proof of what we have. Wave 4s and 5s at matching degrees as what has printed are need to prove an impulse and an invalidation will prove otherwise.
For now, the focus remains on reactions at these two levels. Watch closely— CRYPTOCAP:LINK could be setting up its next directional move.

Link Analysis (12H)Chainlink (LINK) Technical Outlook – Elliott Wave Perspective
After applying Elliott Wave Theory, the chart appears to speak for itself — the downward corrective phase seems to have concluded.
Zooming into lower timeframes, there are several bullish signs suggesting that LINK is primed for an upward move.
Key Technical Reasons Supporting Upside Potential:
Bullish Flag Formation: A clear flag pattern has formed in lower time frames, and LINK is currently testing its resistance level.
Elliott Wave Count: Based on wave structure, Wave 3 appears to be nearing completion. Should we see a short-term pullback, it would likely be Wave 4, offering a strong buy opportunity around the support zone of the flag.
Fib Confluence: The potential retracement aligns perfectly with the 50% Fibonacci level — a typical target area for Wave 4 corrections.
Two Possible Scenarios:
Immediate Breakout: With support from Bitcoin’s continued momentum, LINK could extend its current Wave 3 and break out from the flag without any significant pullback.
Healthy Correction: Alternatively, LINK could retrace to the 50% Fib level before initiating the final leg of Wave 5 — providing a textbook buying opportunity.
Target:
In both scenarios, the upside target remains the same: $18.00 to $18.40 range.
— Thanks for reading.

LINKUSDT 1D AnalysisLINK ~ 1D Analysis
#LINK Buy in stages from here with a short term target of at least 10%+ and a long term target of $31

Link Update (4H) Correction Has StartedIn my previous analysis, I presented two different perspectives on LINK.
On lower timeframes, LINK completed its 5-wave impulsive structure, but in doing so, it invalidated the macro reversed Head and Shoulders pattern—rendering it no longer valid.
Currently, LINK has entered a classic A-B-C corrective phase, signaling temporary market weakness. If the price drops below the key S&R zone (highlighted in pink), I expect a swift move down towards the $13.45 level.
This target coincides with a well-defined demand zone, adding further confluence to the short thesis.
📉 Outlook: Favorable for short positions upon confirmation of breakdown.
— Thanks for reading.

Important Support and Resistance Areas: 16.72-19.52
Hello, traders.
Please "Follow" to get the latest information quickly.
Have a nice day today.
-------------------------------------
(LINKUSDT 1D chart)
The important support and resistance range is 16.72-19.52.
It is expected that a full-scale uptrend will begin only when it rises above this range.
To do so, we need to see if the price can be maintained above the M-Signal indicator on the 1M chart.
In other words, the key is whether it can receive support and rise around 15.14.
-
If it fails to rise,
1st: 12.49
2nd: 6.70
We need to check whether there is support around the 1st and 2nd ranges above.
-
If it rises above the important support and resistance range, the first resistance range is expected to be around 23.98.
-
Thank you for reading to the end.
I hope you have a successful trade.
--------------------------------------------------
- Here is a description of the big picture.
(3-year bull market, 1-year bear market pattern)
I will explain more details when the bear market starts.
------------------------------------------------------

LINK 1H LINK possible path has been drawn
a bit set back and then going even higher is possible
BINANCE:LINKUSDT
𓄀𝓈𝓉𝒶𝓎 𝓉𝓊𝓃ℯ𝒹 𓃓

Interesting breakout moment for LINK LINK is showing signs of follow-through as the momentum potentially gets overbought. After achieving a CHOCH the only thing left is to break above the tops and follow through the volume gap.
Full TA: Link in the BIO

LINKUSDT: Inverse Head & Shoulders Breakout! The Reversal BeginsBINANCE:LINKUSDT has broken out of a classic inverse head and shoulders pattern — a well-known bullish reversal formation. After the breakout, price action showed strength by coming back to retest the neckline support and holding it successfully. This confirms the pattern and signals a potential shift in trend.
From a technical perspective, this setup is highly promising. The market structure indicates a likely reversal after an extended downtrend, and the breakout could be the start of a strong bullish phase. With solid fundamentals backing BIST:LINK , the rally could gain serious momentum once it gets going.
This pattern isn’t just any breakout — it’s a reversal of the reversal, a major turning point in trend. If bulls take control, this move has the potential to accelerate rapidly. However, it’s crucial to always manage risk, use a well-placed stop-loss, and avoid overexposure.
Get ready — once the rally starts, it might be unstoppable!
BINANCE:LINKUSDT Currently trading at $15.5
Buy level : Above $15
Stop loss : Below $13
Target 1: $17
Target 2: $1.4
Target 3: $2.1
Max leverage 3x
Always keep stop loss
Follow Our Tradingview Account for More Technical Analysis Updates, | Like, Share and Comment Your thoughts

LINKUSDT 1D AnalysisLINK ~ 1D Analysis
#LINK Buy after successfully breaking through this resistance line with a short-term target of at least 10%++
