LINK breaking down for a 5th waveVery clean count on LINK, we just broke down from massive support range, if LINK continues to hold below without a quick move back up into the range we should expect a full 5th wave down to finalise the correction.
Target $2.5
LINKUSD

Wyckoff Accumulation is about to completion for ChainlinkWe are ready for the bull market as Wyckoff accumulation is now about to complete. This suggests that LINK is at the sweet spot to buy.

LINK TO THE PASTHistorically Link has been brilliant to trade from a technicals perspective.
You can see the prior consolidation channel and the 2 x Head and Shoulder patterns that played out beautifully. You can also see how the green circles were great entry levels
At present we appear to be in a consolidation box awaiting breakout.
I am leaning Long Term Long for the following reasons:
- On Balance Volume is increasing
- Break above 50 week MA
- RSI pressing upwards
- 90% correction in price since May 2021 (when we broke RSI resistance line, important to watch for this and exit trade if it occurs).
- LINK/BTC is also in a downward channel and looks ready to break out
- You will see from my recent BTC Dominance chart i believe we will have a slight pull back in dominance over coming weeks offering ETH and Alts an opportunity to make some gains
- The prior patterns, the H&S, Parallel channel and subsequent H&S top, these all lasted between 52 and 72 weeks. We are in this current consolidation pattern almost 50 weeks. It is probable that we get a break out within 2 - 22 weeks.
Trade Management (swing trade)
- A retest of the 50 MA would be a reasonable entry. Bottom of the box event better.
- Break below box, exit trade.
- Trade timeline 2 - 22 weeks (explained above)
- If already in the trade I would be keen to exit the trade once in oversold territory on the weekly RSI (We can always reenter it later).
PUKA

LINK on its final short leg down before the upthrust!
Get ready to DCA folks. LINK is about to fakeout and shakeout. My TP for DCA'ing will start below $5 all the way down to 4.x. Accumulate, accumulate, accumulate!
THIS IS NOT FINANCIAL ADVICE!
Cheers

LINKUSD ❕ descending structureThe LINK is out of the range in which it has been trading for a long time and is now aiming for historical lows.
After the rebound, the chart retained the downward structure.
I think that the asset will continue to decline after overcoming the support level.

SOL, ADA, LINK,NEO,TEZOS AND FILECOIN analysis for JuneLast Saturday gave us multiple entries on multiple coins. And as I always say ,price will hit your entry zone mostly during bad news (in this case the lawsuit against Coinbase and the attack of SEC on some coins like ADA and SOL).
Disclaimer: This is not a financial advice and please do your own analysis before investing and only invest what you can afford to lose.

LINKUSDT is in a bearish move.💎 #LINKUSDT just experienced a drop. Paradisers, we need to exercise patience for an uptrend to materialize. The bottom was marked at $5.91. Remember, in the world of crypto, patience is a profitable virtue. Stay tuned for more updates and happy trading!

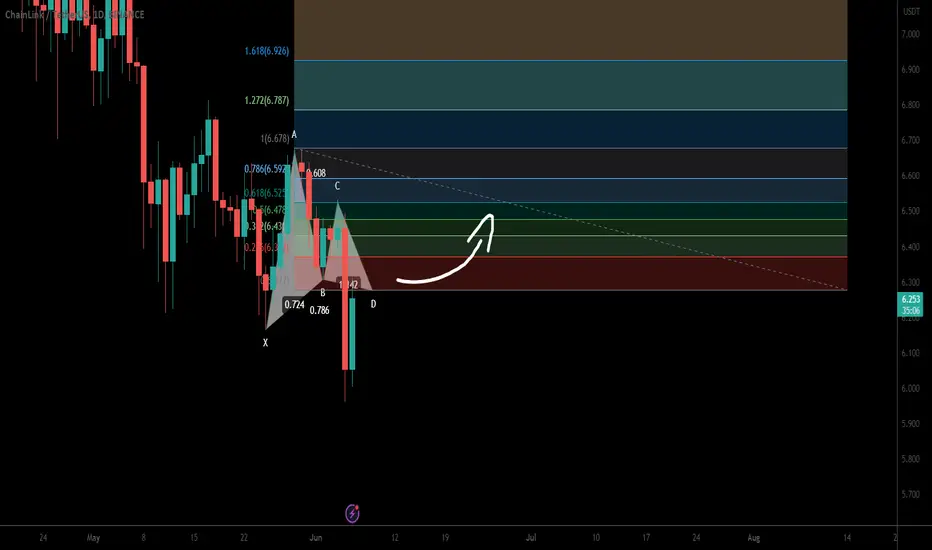
Chainlink (Link) formed Gartley for another price reversal moveHi dear friends, hope you are well and welcome to the new trade setup of Chainlink (Link) with US Dollar pair.
Previously we caught almost 30% pump of LINK as below :
Now on a daily time frame, LINK has formed a bullish Gartely move for a massive bullish reversal move.
Note: Above idea is for educational purpose only. It is advised to diversify and strictly follow the stop loss, and don't get stuck with trade.
LINKUSD ❕ holds the lineThe LINK is testing the uptrend line again.
TD Sequential has formed an upward reversal signal (4H TF)
I believe that the asset will bounce after fixing above the trend line.

LINK - It is timeLink has been consolidating in the same tight zone for 330 days. After that long period of accumulation, I predict the move up will probably be large and sustained for at least 2-3 big legs up.
The problem is that we've had 3 fake-outs where price closed above $8.5 and then dumped hard right after. With that in mind, I plan on buying the next time LINK closes above 8.5 and cutting my losses if I see it close back below the support/resistance (S/R) zone highlighted in red, meaning below $8.
If the breakout is real, a I think and hope it is, then I intend to take profits between $19-20, and keeping the rest for the possibility that LINK becomes a beartime runner again, like last time.

LINKUSD ❕ trading above the range50EMA broke through 200EMA up at 30m Timeframe.
TD Sequential formed a reversal signal upwards (30m TF)
I believe the LINK may continue to rise after fixing above the range.

Linkusdt Big Drop Loading Linkusdt
Linkusdt not looking good link needs to hold this support and breakout the upper resistance incase of rejection from 6.85-7 I am exoecting big drop
Dyor

LINK, FIL, SOL , DOT and QNT entries and targets for best RRR Some possible targets and entries for better RRR . We may have more than 10x in some coins

LINKUSD ❕ fixed above the trend lineThe chart has formed a confirmed bullish divergence on the 4H and 1H Timeframes.
Price broke through 50EMA up at 30m TF.
I think price will continue to rise.

LINKUSDT daily chartLink has been following the same pattern for a year. The chart is divided into 3 parts. The zone of sellers and buyers and no man's land. In the previous 3 times when the price returned from the seller's zone, we saw that the price was shot aggressively towards the buyers. This idea I want to sell and go to the buyer's zone. I will be happy to hear your opinions. This is not a financial advice

LINKUSD ❕ lower boundary of the rangeA bullish divergence is still forming.
LINK has fallen to the lower boundary of the range.
I believe that the asset may bounce from the current level.

✅TS ❕ LINKUSD: uptrend channel✅✅ LINK trades within the channel.
The chart is testing the lower limit of the channel and the support level.
The price of the asset will bounce back up. ✅
🚀 BUY scenario: long to 7.283 🚀
----------------------------------------------------------------------------
Remember, there is no place for luck in trading - only strategy!
Thanks for the likes and comments.

LINK: LAST Month to ACCUMULATE💰BINANCE:LINKUSDT
Hi Traders, Investors and Speculators of the Charts 📈📉
Ev here. Been trading crypto since 2017 and later got into stocks. I have 3 board exams on financial markets and studied economics from a top tier university for a year.
LINKUSDT has been in a typical Wyckoff Method consolidation phase. Looking at previous fractals, wee see that Chainlink often goes parabolic during the months of June / July. This is right around the corner! Even should it not happen that way this time around, LINKUSDT has establishes a clear bottom and will most likely only go upwards from here.
To confirm this bias, we take a look at the Technical Indicator CryptoCheck START v3.5 and see a buy signal flashing on the weekly (which is bullish on such a high timeframe) :
Since you're here ! Check out this idea on BTCUSDT :
_______________________
📢 Show us some LOVE 🧡 Follow for daily updates and trade ideas on Crypto , Stocks , Forex and Commodities 💎
We thank you for your support !
CryptoCheck

LINKUSD ❕ above the liquidity zoneThe LINK is moving above the liquidity zone.
The RSI chart is trading in a bullish zone (4H, 1H and 30m TFs)
The price of the asset will continue to rise.

LINK: starting all over againTwo weeks ago LINK had a very good week, when the price of the coin reached a resistance line at $8.0. Start of the previous week was even better, since the price was pushed to the weekly highest level at $8.7, however, the long term resistance line at $9.0 has not been tested. But the weekend brought some heavy drop in price, due to generally negative market sentiment, erasing totally profits from the last two weeks. The price of LINK is ending the week by testing the $7.0 support line. This was certainly a strong drop, which LINK did not deserve, but the market is always right.
At the beginning of the week RSI reached a clear overbought side, however, the indicator is ending the week below the level of 50, and around 45. Moving averages of 50 and 200 days continue to move as two parallel lines, still not providing much indication whether they are ready for any kind of a cross in the coming period.
LINK will start the week ahead by testing the $7.0 support line. This line was strongly holding during the last period, while emerging buying orders as of the weekend are providing some potential that $7.0 will hold in the coming days. In case of some surprises, the price might go to the level of $6.5 but just within a short period of time. On the opposite side, current charts are showing some potential for $7.5 in the coming days.

LINKUSD ❕ tests the supportLINK continues to move over liquidity.
Trading volumes are still showing interest in price growth.
The asset may resume growth after fixing above the support level.

Quick look at LINKHere's a quick look at the LINK daily chart. As we can see, the price is trying to hold above the resistance zone, and if the price manages to sustain its position above the resistance zone, then a move to the red trendline is likely to happen! Therefore it is recommended to monitor the resistance zone in case it does sustain its position above it!
-------------------------------------------
Recent Altcoin trades:
ARB / USDT: 30% profit!
ROSE / USDT: 5% profit!
-------------------------------------------
About our trades:
Our success rate is notably high, with 10 out of 11 posted trade setups achieving at least their first target upon a breakout price breach (The most on TW!) . Our TradingView page serves as a testament to this claim, and we invite you to verify it!
-------------------------------------------
If you like the content, then make sure to comment and like the post :D
Follow me for daily profitable trading setups.
BTC dictates the market. If BTC falls, then Alts will drop as well. Trade safe!

#Chainlink ripping to over $10 before you know itLOOK at that #HVF
#LINK is a go!!!
after a YEAR long consolidation
and red candles should be bought up
Longing your longs could also be fruitful!
@TheCryptoSniper
#HVF
