LINKUSDT: Wyckoff analysis 4hrHello friends. According to Waykoff's method, we are witnessing the formation of its phases, it is expected to move towards phase D and E, so such a movement is not unexpected for this currency.
LINKUSD

$LINK - HEADING TO OUR TARGET.$LINK - HEADING TO OUR TARGET.
This Gray Box is a Demand Zone from the Weekly Chart.
I will be loading up on Chainlink big time in the $3.50- $4.50 area.
Do you hold any Chainlink?
#LINK

LINKUSD D1: 30%+ CORRECTION WARNING TP 4.00(SL/TP)(NEW)Why get subbed to me on Tradingview?
-TOP author on TradingView
-2000+ ideas published
-15+ years experience in markets
-Professional chart break downs
-Supply/Demand Zones
-TD9 counts / combo review
-Key S/R levels
-No junk on my charts
-Frequent updates
-Covering FX/crypto/US stocks
-before/after analysis
-24/7 uptime so constant updates
🎁Please hit the like button and
🎁Leave a comment to support our team!
LINKUSD D1: 30%+ CORRECTION WARNING TP 4.00(SL/TP)(NEW)
IMPORTANT NOTE: speculative setup. do your own
due dill. use STOP LOSS. don't overleverage.
🔸 Summary and potential trade setup
::: LINKUSD daily/candle chart review
::: 30% CORRECTION WARNING
::: updated/revised outlook
::: distribution in range / weak chart
::: limited upside / expect dump from HIGHS
::: weakness will last for 4-8 weeks
::: LOG SCALE chart
::: backtested wedge breakout
::: RISING WEDGE BEARS taking over
::: FTX/ FTT bankruptcy will pull crypto down
::: CLEAN REJECTION AT recent highs
::: S/R was re-tested produced WEAK bounces
::: final BOUNCE possible now before DUMP
::: also noteworthy sequence of lower highs
::: recommended strat: MARKET SHORT IT
::: final TP BEARS is 4.00/4.20 usd
::: 40-45% correction possible next
::: 4-8 weeks in November/December 2022
::: right now no upside in this market
::: position traders should wait for
::: better entry prices later after
::: no upside in this market it's game over
::: recommended strategy: SHORT SELL AT MARKET
::: TP BEARS is +40% gains - near 4.00 USD
::: BULLS stay out until correction is over
::: SWING TRADE: SHORT/HOLD IT
::: correction run not over yet
::: good luck traders!
::: BUY and get paid. period.
🔸 Supply/Demand Zones
::: N/A
::: N/A
🔸 Other noteworthy technicals/fundies
::: TD9 /Combo update: N/A
::: Sentiment mid-term: BEARS/CORRECTION/40%
::: Sentiment short-term: DUMP/GAMEOVER
RISK DISCLAIMER:
Trading Crypto, Futures , Forex, CFDs and Stocks involves a risk of loss.
Please consider carefully if such trading is appropriate for you.
Past performance is not indicative of future results.
Always limit your leverage and use tight stop loss.

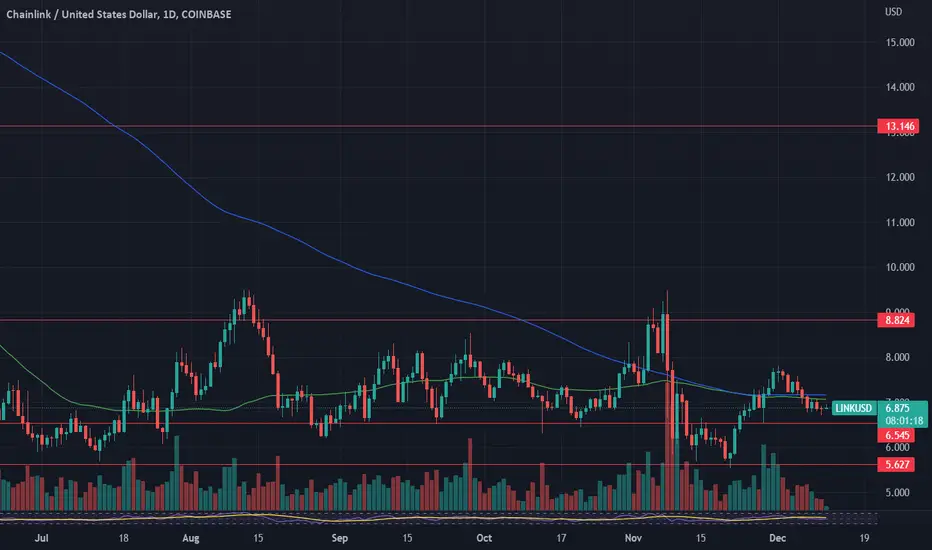
LINK: back on old trackA lot of negative news on the market during the previous week, related to FTX contingencies and recession in the US in the coming year, pushed the price of LINK to the downside and lowest weekly level at $5.8. Based on current charts it doesn’t seem that the support line at $6.0 has been broken, but it seems that it has been tested to the downside during the last two days. This is generally positive for LINK, because it shows that even in a stressful time, investors sustain confidence in this coin.
With latest price moves to the downside, RSI reached level of 34, but indicator still did not reach the clear oversold side of the market. Moving averages of 50 and 200 days continue to move as two parallel lines with tiny differences between them, still holding the probability that a potential cross might come in the near future.
As per current charts, it could be expected for LINK to enter into a short reversal, after not being able to clearly break the support line at $6.0. Considering quite low daily trading volumes, it should not be expected to make significant moves in price. There is probability for $6.5 short resistance to be tested, with currently decreased probability that $7.0 might be reached.

LINKUSDT trading strategyFor the last six months, the LINKUSD price has been in a broad consolidation range of $5.5 - $9.5.
Fundamentally speaking, Chainlink was always on top of the Oracle category and has been accumulating for quite a long time now.
In our opinion, LINK will continue to consolidate in the range of 5.5-9.5 in the short term; and it can go up to 12$ or $18 in the mid to long term.
Two trading strategies can be applied here:
1. Trade the Sideway:
Swing traders can enter a LONG position at its local support of $5.5- $6 and enter SHORT at its local resistance of $9. I myself have made a limit order of buying LINK at $5.5. Hopefully, it will get filled.
2. Trade the Breakout:
For more precise decisions, traders can wait for a confirmed breakout of either side to enter a trade. This strategy will bring less profit but can give you a better chance at winning.
Choose a strategy suitable to your preferences and stick with it. Remember, always trade at your own risk, and never risk more than you can afford to lose.

LINK longterm forecastThis is my idea for Chainlink vs USD
As always - no financial advise!
Happy trading

Link bulls are in the way Hello guys, as you can see price create very bullish sign in the middle of trading range if it could break above blue line , what I expect is pomp for Link
Stay safe ;)

LINK: still in reversalAfter not being able to make a clear road toward the $8.0 resistance line two weeks ago, LINK entered into short correction during the previous week, exactly as it was expected. What is interesting with this coin is that while general investors hesitate to enter into any position, LINK acts like it does not have such a problem. This is quite positive, as it supports investors' positive prospectus on the coin.
LINK started the previous week around level of $7.5 and moved to the downside, to the lowest weekly level at $6.7. RSI was pushed from the level of 56 down to 46, indicating that the market is probably still not over with selling orders. Moving averages of 50 and 200 days continue to move as two parallel lines with very tight distance between them, which increases probability of potential cross in the near future.
At this moment, charts are not clearly pointing that the reversal from the previous week is still over. In this sense, the level of $6.5 might be tested, with lower probability that price might reach the $6.0 support line. On the opposite side, $7.0 resistance might be tested again, with still lower potential over $8.0 next resistance line.
Link 8HRising wedge under the important resistance zone, a good setup for the short position.
#link
#chainlink

$LINK - TRADING OPPORTUNITY. Short Term, 4H Chart.$LINK - TRADING OPPORTUNITY.
Yesterday we posted a bearish 1D Chart for Chainlink. But in the short term, I'm expecting some upside.
This is the EXACT trade I'm taking. (4H Chart)
The SL shows the Stoploss, and the green supply box is where I'm looking to sell!
#LINK

$LINK - THE DAWN BEFORE THE STORM$LINK - REJECTION. (2D CHART)
After a good move from $6, we rejected at the original break down level.
Will ChainLink finally head to the Gray Support Box?
$3.5 - $5 is were the real buying opportunities of a lifetime are for #LINK.

$LINK to 6.40 $ USD?I have found a Rising Wedge in the Link/USDT pair with base targets
1️⃣6.89🎯
2️⃣6.67🎯
3️⃣6.40🎯
4️⃣6.03🎯

LINKUSD ❕ tests the uptrend lineLINK trades above the control point.
On the 30m Timeframe price and RSI have formed a bullish divergence.
I expect price to rise if the LINK holds the uptrend line.

LINK: on a quest for $8.0During these turbulent times on the crypto markets, LINK came as a surprise, as the coin was holding strongly between levels of $6 and $7. It shows that investors still have high confidence in future prospectus of this coin, regardless of general developments on the market. During the previous week, LINK reached its highest level at $7.8. Resistance line at $8.0 has not been tested on this occasion. Instead, the coin reverted a bit to the downside, as of the end of the week, finishing the week around $7.3 level.
During the week RSI was pushed up to the level of 60, still the indicator is ending the week around level of 54. Regardless of short reversal, it still shows that investors are more interested in the overbought side of the market, than the opposite one. It also adds to potential for the price to be pushed higher in the coming period. Moving averages of 50 and 200 days continue to move as two parallel lines with very tight distance between them, which increases probability of potential, cross in the near future.
Charts are showing that LINK entered into a short reversal, after not being able to make a clear move toward the next resistance line at $8.0. In this sense, the support line at $7.0 might easily be the next target for LINK at the beginning of the week ahead, eventually $6.5. In case that this line is not clearly breached, then it might be expected for LINK to continue its quest toward the $8.0 resistance line for one more time.

Link looking goodaccumulating link down at these prices
if we can flip 8 to support might see a nice move up

Chainlink (LINK) - November 30Hello?
Traders, welcome.
If you "Follow", you can always get new information quickly.
Please also click "Boost".
Have a good day.
-------------------------------------
(LINKBTC 1W Chart)
As it began to rise above 0.0003 950, it began to release its upward force.
If it starts to rise above 0.0005 508, it is expected to explode the strength of the uptrend.
--------------------------------------
(LINKUSDT 1W Chart)
The important thing is whether you can rise to the 11.976-15.374 section and be supported.
To do so, we need to see if it can rise above the MS-Signal indicator.
(1D chart)
The 7.230-7.820 zone is an important support and resistance zone.
Therefore, when rising in this section,
1st: 8.649
2nd 11.064
There is a high probability of rising in the vicinity.
However, since the 11.976-15.374 section determines the trend, if it is located below this section, a short-term response is required.
If there is a decline below 6.700, there is a possibility of a decline around 3.703-4.976, so you need to think about how to react.
-------------------------------------------------- -------------------------------------------
** All descriptions are for reference only and do not guarantee profit or loss in investment.
** If you share this chart, you can use the indicators normally.
** The MRHAB-T indicator includes indicators that indicate points of support and resistance.
** SR_R_C indicators are displayed as StochRSI (line), RSI (columns), and CCI (bgcolor).
** The CCI indicator is displayed in the overbought section (CCI > +100) and oversold section (CCI < -100).
(Short-term Stop Loss can be said to be a point where profit or loss can be preserved or additional entry can be made by split trading. This is a short-term investment perspective.)
---------------------------------

LINKUSD ❕ trading between zonesChainlink trades above the liquidity control point of the current range.
Trading volumes have declined.
I expect that LINK may correct from the current resistance, but after fixing above it will continue to grow.

The ChainLink LINK price is preparing for a good growthToday, we will consider the LINKUSDT price chart on the 3-day time frame
For the last six months, the LINKUSD price has been in a wide consolidation range of $5.50 - 9
Trading volumes in the range show that buying prevails, and therefore we can conclude that the "big player" is gaining long positions.
If in the coming days, the LINK price does not fall below $6, then in our opinion this is a signal for strong long.
The first task of buyers is to break out of this consolidation upwards, that is, to confidently consolidate above $9.
In the medium term , we see the following targets for the growth of the ChainLink token price: $12.50 - $14.80 - $17.50
_____________________
Did you like our analysis? Leave a comment, like, and follow to get more

LINK has registered a range trend!Over the past week, LINK has registered a range trend on its important support range. After the buyers' efforts brought the price of this currency to the resistance range of 9.3-10 dollars, the simultaneous profit saving of short-term buyers and selling pressure in the market forced the medium-term buyers to sell their assets. As you can see, we are generally in the descending channel in the weekly time frame and in a trading range area in the daily time frame.
The floor of this area in the range of 6.2 to 5.9 dollars has repeatedly prevented the price from falling, and this support occurred again in the last encounter. But the most important thing about the last encounter is that the penetration of the price inside this range is a sign of possible breaking of this level and the possibility of falling to the bottom of the descending channel in the range of 4.5 to 5 dollars. In the 4-hour time frame, you can consider a downward trend line for possible reversals. By breaking this dynamic resistance, the possibility of short-term growth to the $7 range can be provided. Of course, in the condition that Bitcoin stays at least in the range trend and does not fall further.

LINKUSD: Was It a Fake Bullish Breakout? 😱 | Nov. 25, 2022This week, we will stick to the 4-hour time frame to analyze the price action in detail!
It seems like a false bullish breakout was seen earlier this week following which a strong rally was witnessed. Seems like the price will soon approach the next resistance situated at $7.35. If the resistance is reclaimed by the bulls, traders can expect a strong rally in the coming week.
Once the resistance at $7.35 is reclaimed, we can see a clear path to the supply zone at $8.51. However, this view is only valid once the price is able to sustain above $7.35.
Traders must maintain caution of the demand zone at $6 because if this zone is broken once again, a sharp fall could be seen. At the time of writing, it looks like we may see a small pullback as the RSI has started falling. Expect the price to test the support at $6.3 before continuing the rally.
The important price levels for this week are $6.3 and $7.35!

LINKUSD ❕ tests the support zoneThere was an increase in trading volumes on the rise in price.
The price broke up 50EMA (4H TF)
50EMA broke up 200EMA (1H TF).
I expect growth in the asset if the LINK can hold above the support zone.

LINK breaking the Rectangle chain - Target $2.63Bear Rectangle with a sideways Range on Link
21 > 7MA Price <200MA
We do see a strong bull candle though, which could save the day (month) but this will be mainly a testing zone.
Target $2.63
The stop loss is tight because, if it touches, the market will turn extremely bullish and will break out of the rectangle and head on up.
for now the bias is bearish unfortunately.

LINK $2.26 - $1.76 BUY ZONELINK is not looking too good with everything else... if you can buy this crap at $2.20-$1.80, that'd be a steal... but that's what i'm expecting
not trading advice
tg
