Linkusdsignals

LINKLINK next stop $46 IMO. Break out of massive triangle correction & now forming a bee u ti full Inverted Head & Shoulders pattern

LINK roadmap short term. Pump to the moon starts NOW ...Hi,
LINK is due to an imminent breakout as RSI 1W is about to cross bullish for the 1st time since it went Bearish beginning of July (bear fakeout).
I wont put the price levels for price discovery phase yet, because that would be pure Fibonacci speculation. But, my bet for LINK is around 400 euros per unit by Q2/Q3 2022.
Rather I provide you with the main price levels for LINK. Price are in euros because this is what I trade but same applies to USD/T.
Once we break 38.20 euros per unit, and confirm by bouncing on new supoort, RSI 1W will trigger a huge bullish signal, sending it to 43.00 euros.
It will need to work on the price level at 33.75 for some time though, but I have little doubt this would hold for long.
I also think we could break the ATH and send it to Moon just like MANA did few days ago.
Kind regards,
;-)

LINK USDT ✈ChainLink is a decentralized oracle network built on Ethereum. It connects off-chain data sources, such as APIs, data feeds and bank payments to on-chain smart contracts.

LINKUSDT Long !! ✈ Long forecast LINK ..
Chainlink (LINK) is an Ethereum token that powers the Chainlink decentralized oracle network. This network allows smart contracts on Ethereum to securely connect to external data sources, APIs, and payment systems.

LINKUSDT A whoop for LINK Price?Market cap $ 15,431,933,875.0000
Circulating Supply $ 461,009,553.9175
All time high $ 52.7000 May 10, 2021
All time low $ 0.1482 November 29, 2017
Chainlink allows smart contracts to connect to the data feed of any web API or data source. This idea has changed the rules of the game in the blockchain industry.

LINKBTC Falling Wedge IdeaAn idea for LINK on the BTC pair
Price is currently forming a falling wedge
This is a pattern that tends to break out to the upside after completing
Demonstrated by 1,2


LINK is Super Bullish! (Ready to recover)After a long drop from $52 to $13 a few months ago, LINK's recovery is finally looking promising as it begins to ascend within the upward channel. Expect LINK to have micro pull-backs as it marks up, but I believe we can expect it to mark up in the short term and over the next coming months. This is not trading advice and yes I do HODL Link.
Please do not risk what you can't afford to lose. Happy trading!

Link - is getting ready to sky rocket 😱🚀🚀The LINK on the daily timeframe got close to the trend line. If price continues to squeeze and breaks this trend line, it could be a good buying opportunity.
But as Bitcoin has been rising for a long time without any correction or consolidation, we should be careful when buying altcoins, the local situation on the bitcoin chart is not good and from the technical analysis side, there might be a local correction, which will affect altcoins a lot.
Therefore, we should also note the second scenario, when the price corrects to a local low and then breaks the trendline and goes up.
Write in the comments all your questions and instruments analysis of which you want to see.
Friends, push the like button, write a comment, and share with your mates - that would be the best THANK YOU.
P.S. I personally will open entry if the price will show it according to my strategy.
Always make your analysis before a trade.

LINK A break of the top TL and the $30-$35.40 shaded box area will almost seal the W3 weekly count and LINK will be back at ATHs B4 u can say Valtik.

Link In a Danger ZoneBad news for Link Holders
Link Dominance chart that i attached to this idea show up a 1 year trend line
if Link couldn't reach 28$ channel in couple days its gonna be dangerous for Linkusdt Long Positioners
and could be drop to 20$
but if Link.D can break that trend line and reach to 0.55 and above in Dominance chart its blowing
everything depends on BTC.D

LINK 1 Year Trend LineLink on the Edge and this is dangerous for LINK Holders
Link.D drops to 0.47 and if that goes down to 0.4
Link Price could be drops to ~ 20$
But in best scenario, if LINK.D can break this trend line again like September 6th or Sep 16th
Link price Rise Above 35$ Again

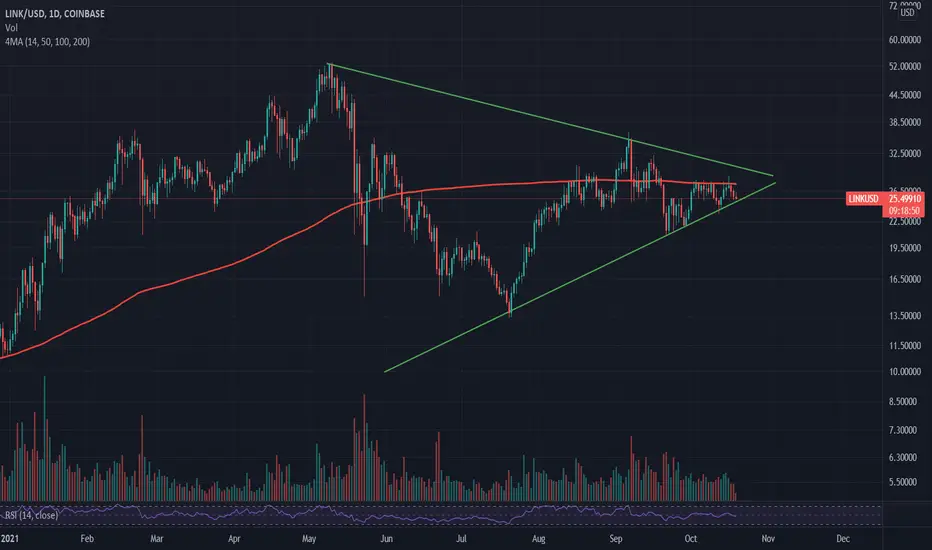
Chainlink symmetrical triangle, 200MAChainlink formed a symmetrical triangle and and still below 200MA, similar to VeChain. Link currently testing the support line and hopefully successfully bounces off the support line. Then I hope for a successful breakout in the next few days. If Chainlink successfully breaks through the symmetrical triangle and 200MA it will be a very bullish sign.
LINK/USDTHello,LINK is in a long-term uptrend channel and the price fell after hitting the channel ceiling.If the price breaks the downtrend line, the price increase was for a long time.I think we will see the price increase to $ 100

CHAINLINK, The Time is Near for this undervalued currency.Forming Inverse HnS, Gonna Go High. Usually this pattern indicates the spike in the price.

LINKUSDTLINK/USDT
setting up for break out loading some here (the price currently 26.42$)
short term target 35-37
mid/long term I believe link can crack 100
Key Resistance 28.16$
call invalidate if 23,34.
ideally, if you can monitor your trade only exit if the price closes below 23.34$ to avoid scam wicks.

LINKUSDLINK has since seen an uptrend since it hit a low of in mid Jul at 13.72. Even with the strong buyers take and uptrend from that point to 36.35, we still observe a little downtrend and a strong position for both buyers and sellers at that. Do you think LINK as a good change of hitting another bull run to it's resistance of 52.22?

Link- 32 could be the bulls targetFrom the beginning of October, Link is consolidating in a range.
25 is acting like clear and strong support, and as long as the price stays above this support bulls hold the upper hand
A break above 28 would confirm this bullish outlook and will open the door for 32 resistance

Link Rise Finally in a WeekLink Bullish pattern is completed and its ready to explode
in the most pessimistic scenario this takes a week but i think it will happened less
please check my last analysis on LINK that attached in related ideas
EYES ON LINK

LINK/USDT 4HOUR UPDATE Welcome to this quick link/usdt analysis.
I have tried my best to bring the best possible outcome me in this chart.
Reason of trade :- link/usdt is creating this triangle pattern is our given entry can also leverage 2x to 5x most important stoploss
Entry:- 26$,26.70$
Traget:-
T1:- 27.22$,
T2:- 28.00$
T3:- 29.00$
Stoploss:- 25.45$
Remember:-This is not a piece of financial advice. All investment made by me is under my own risk and I am held responsible for my own profit and losses. So, do your own research before investing in this trade.
Happy trading.
Sorry for my english it is not my native languages.
Do hit the like button if you like it and share your charts in the comments section.
Thank you...

LINK Huge growth potential with price cycle x10Hi all holder LINK
Today in the weekly price bracket I provide a very interesting cycle by Link, graphically this cycle will have a Bull
run around 800-1000%, I will buy more consolidation 10-15$ area if it's lucky to drop in price, Link is the leader
in the general decentralized Oracle market, with the Web3 wave happening, LINK has the opportunity to
cooperate with a variety of big companies like GOOGLE, VISA, MASTERCARD, ...
On the LINK side, there is a team that is fully working in the right positions, with the right people for the right
job, and this team is admired by everyone who looks at it, with their constant release of improved versions
leaving competitors behind very far behind, in other words LINK is like
GOOGLE and AMZN in the era of technological change.
LINK GO TO $160 SOON!

LINK- Marketcap dominance. New high commingIt's time for Link to outperform the market. Money will flow into Link.
Not financial advice. Just sharing my opinion
