LINK Market Cap - Double Top? Double top to form the handle?
Put in some areas of accumulation that are relevant
Linkusdsignals

$LINK about to flash a rare Buy Signal. Last time Link up 383%$Link WEEKLY chart. The last time $LINK flashed a buy signal, we went up 383% in less than 50 days. We are on the verge of printing another very soon, likely this week. If that happened again, LINK would be $67 Are you ready?

LINKDOWNUSDTWe can just watch BTC price @ this moment.
Near ATH, some exchanges new ath, lot of emotions, lot of money for Bitcoin.
My theory is to just buy more Linkdown bcs I wait next BEAR MARKET. Imagine that the LINKUP and LINKDOWN just switch places? Is that possible? Yes, when BTC does he's thing.
So just long hodl and small bags for it...


LINKUSDT (Channel Breakout in 1 Day Chart)LINK/USDT currently trading at $15.30
LONG Entry-level: $14.75 to 15.50
STOP LOSS: $13.75
Resistance level 1( Target): $17.75
Resistance level 2 (Targe ): $20.00
Resistance level 3 (Target ): $25.00
We can expect a big move after $20 resistance Breakout
Max Leverage: 5X
Risk reward ratio 1:3
ALWAYS KEEP STOP LOSS...
Follow our Tradingview Account for more Technical Analysis Update, | Like, Share and Comment your thoughts

LINK is looking like it's ready for take-off before XmasNot too much to say since the chart speaks for itself. If Chainlink manages to stay inside the current fib channel, we could reach anywhere from 100% to 200% gains before Christmas. I'm long again since $12.25 and plan to stay that way for at least the next three weeks.
PS - I'm new to TradingView and publishing my TA publicly, so let me know if you see something I don't or if you have any comments or suggestions. Thanks! -Juice


LINKCHAIN BREAK OUT!!LINK / USDT
🌟 Techincal analysis🌟
Alot of attempts before
To break strong resistance between 13$-13.5$
Finally it break it today
And with highest daily close since 2 September 2020
Now i think the way is open for link.. up to test ATH again or more

Link Will Recover Link Holders do not sale Link Will Recover Link Holders do not sale stay in trades

LINK Looking A Little Bearish (Short Term)My Fellow Crypto Traders,
Appreciate you taking the time to view my analysis in which I hope you may find beneficial. Please be sure to “LIKE” if you indeed find my analysis useful and/or find my analysis intriguing.
Cheers & Happy Trading!
----------------------------------------------------------------------------------------------------------------------------------------------------
ANALYSIS:
It seems that LINK Marines and their longs are hitting a relatively strong resistance level , in which LINK has failed to penetrate through this level. Moreover, w/ the market sentiment signaling greed, it would not surprise me if we see LINK re-test lower supports as a momentum builder to go on and make higher highs. However, w/ BTC maintaining dominance w/in the market, Atls remain second fiddle. This narrative of BTC holding on to dominance for a while longer is supported by BTC's money velocity chart showing lower lows, signaling people are holding BTC vs's trading. Thus w/ major institutional players buying up BTC induces these aggressive BTC moves to the upside.

Amazing call on link ...whats next targets ?Yesterday we shared with you this idea about link that it was looking bearish in both usdt and btc pairs see here :
Price broke the trendline support and fall from rising wedge as expected
As long as price cant get close by daily candel above 10.74$ -10.8$ (0.5 fibonacci level)
(Also this level is the trendline support breakdown level)
We can see next target easy
Potential next targets to be reached :
Target 1 : around 8.5$ ( 0.618 fibonacci level )
Target 2 : around 7.3$ ( was recent low for link )
Target 3 : around 5.5$-5.3$ ( 0.786 fibonacci level )
For investor this areas is a good ones to accumulate partially before next bull run in link
Link was and still one of my favorite coins
Long term is bullish
Please like and subscribe for more idea if you see it helpfull


LINK Entry at 10Its hard to be looking for cheaper prices at this current time!
LINK is hot
10 is a great entry

Link looking bearish on both usdt and btc pairLink start to look bearish now
As you can see in btc pair it forming symmetrical traingle and start to break it
In usdt pair it test the trendline support for 4th time which make it weaker
And we can look for sell position if it broken or at retest it
Agree or not show your opinion in comment and support by like and follow

LINK opportunity for new highs?Hi all,
this is my first public analysis.
These 2 years in crypto have learnt me to focus on simpler strategies and to detect the right moment for entering an interesting positions.
Bullish triangle in a form, maker higher lows and waiting for breakout.
According to my patter I would wait for this bullish pattern to confirm by breaking out of the zone.
I would appreciate your comments on the idea.
Many thanks and happy trading!

LINKUSDT POSISBLE SCENARIOON 1D CHART I SEE AN UPTREND , I HAVE 3 HH AND 3 HL, IN THIS MOMENT I THINK I CAN GO WITH NEXT IMPULSE MOVE.
I HAVE A 4H CHART ENTRY BASED ON A HAMMER CANDLE AT THE BOTTOM OF THE CORRECTION (AT LEAST I THINK SO, A TRADER WORK'S WITH PROBABILITIES), CLOSED ABOVE SUPORT AND ABOVE TREND LINE .
WITH ALL THIS INFO I DECIDED TO TAKE A LONG POSITION, WITH A 1:4 RR AND I PLACED MY STOP LOSS UNDER SUPORT AND UNDER TREND LINE SO PRICE CAN BREED :)
I THINK I HAVE 2 KEY AREAS THAT WILL HOLD PRICE IN AN UP DIRECTION AT LEAST UNTILL THE NEXT SRESISTANCE MARKED WITH RED DOTTED LINE.
NOT FINANCIAL ADVICE , JUST MY OPINION.
LET THE SHOW BEGIN ;)


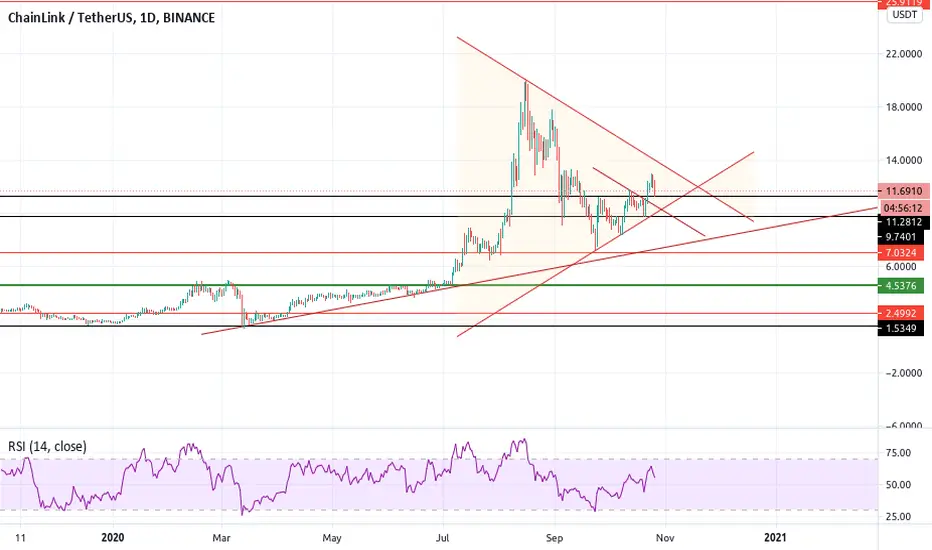
LINKUSDTLINKUSDT LONG-TERM CHART
Cir. Supply - 389,509,556 LINK
Total Supply - 1,000,000,000 LINK
Market Cap - $4,514,189,423 ($4.5 Billion)
Scenario 1: - Watch out for the Whales DUMP
#Link has been showing minor breakouts in past few week but none looks sustainable and solid.
I now therefore expect ChainLink to return to $1.50 to $1.65 Billion Market cap.
If Link breaks our channel marked here then it is a sign of its down trend.a I believe during Nov 2020 - March 2021 whales normally takes their profits and Would be happy to bet all in at $4.2 - $4.5 level. Which is a major support and was its breakout point.
Scenario 2: - BTC forms a flag here and then comes PUMP
Link has been reacting positively to BTC rise since long. As, more money in BTC means more money for LINK or BNB or ETH platform.
Thus, If BTC continues to surprise us and breaks 13,500 resistance then there is no reason for Link to be bearish.
Just as ETH or BNB it will cont. to sail ahead along BTC and will hit the new ATH finding resistance around $24-$25
<> This is Not a Financial advice. Just sharing my thoughts.


LINKUSDT [H4] TREND RUNNING WAIT TO ENTRY 🔥🔥🔥LINKUSDT TREND RUNNING WAIT TO ENTRY 🔥🔥🔥
LINKUSDT TREND UP IS RUNNING WAIT UNTILL FALL TO SUPPORT AND BUY IT TO MAKE PROFIT
GOODLUCK
TON TRADER

LINK / USD New RangePrice of link in the Rising Wedge on higher timeframe, looking for pullback from resistance 12.8 zone down to support at 11.4

Can Chainlink $Link can hit $5 Yes there is possibility if price goes below $9 and stay there then price can hit $5. $5 support looks very strong and price can reach there.
But if price goes above the 100 day moving average that is currently at $11.4 then target will be moon.
we are watching the price action , follow for more updates
