LINK POTENTIAL GOES UP TO $26 TO $34 After Long AccumulationLink includes the DeFi coin category which I think will rise in 2024.
There is a high probability that soon, this LINK will break out of the markdown structure.
LINK is observed to have accumulated for almost a year. The coin has been quite stable in recent months.
At this time it tends to move slowly. It is suspected that there is an accumulation phase at each stage before the high rise.
The predicted increase is in the first quarter and third quarter of this year.
Linkusdsignals

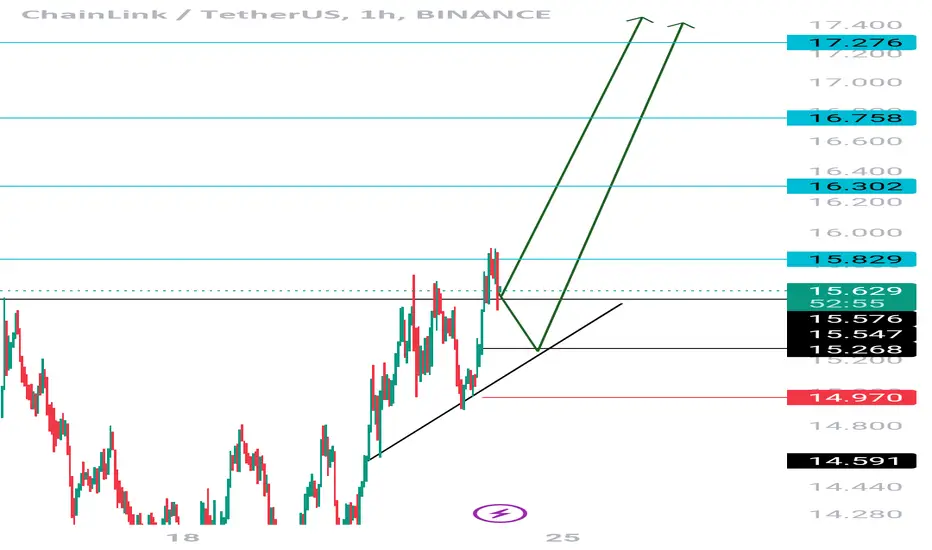
So start again up-trend(LINK)❤️❤️Thanks for boosting 🚀 and supporting us!
📈Back to again start . Startes .
📊 (Entry) : 14.86
🔴 Stop Loss : 14.17
🎯 Take Profit : 15.47-15.95-16.70-17.30
🔗 For more communication with us, In the footnote and send a message in TradingView.
👨🎓 Experience and Education: Our trading team has five years of experience in financial markets, especially cryptocurrencies.

Link/Usdt is showing robust strength and potential. Link/USDT is showing promising signs. It looks like it's gearing up for a bullish move, and I anticipate the price to increase by 15-30% in the coming days. However, it's important to note that this is not financial advice, so please do your own research (DYOR) before making any decisions.
LINK - Gearing up for MASSIVE GainsHi Traders, Investors and Speculators of Charts📈📉
For a while now, LINK has been trading in a very clear accumulation phase. This is the zone we see after a bearish cycle and BEFORE a new bullish cycle.
Chainlink can be very "wicky", and often the price will go JUST UNDER/OVER the resistance zone, or JUST UNDER/OVER the support zone. This makes it hard to give precise entry points. Working within ranges and choosing the lower part of the range is the safest best to protect against those ugly wicks.
Here are some easy setups that guarantee profits during the next bullish cycle - but you will have to have packed-bags in order to bag-in on profits!
_______________________
📢Follow us here on TradingView for daily updates and trade ideas on crypto , stocks and commodities 💎Hit like & Follow 👍
We thank you for your support !
CryptoCheck
COINBASE:LINKUSD BINANCE:LINKUSDT

TWO entry (LINK)❤️❤️Thanks for boosting 🚀 and supporting us!
📈
1- I if break resistance = Entry trigger or buy stop.
2- back to break trendline = limit buy.
🔗 For more communication with us, In the footnote and send a message in TradingView.
👨🎓 Experience and Education: Our trading team has five years of experience in financial markets, especially cryptocurrencies.

Seize the Potential of Chainlink with EMA 20 for Incredible Gai
I am here to present you with an exceptional opportunity that promises to revolutionize your portfolio and take your gains to unprecedented heights. Chainlink, a true gem of a project in the blockchain universe, has caught our attention and should undoubtedly catch yours too.
With its recent surge and the Extra Moving Average (EMA) 20 indicator looking remarkably attractive, the stage is set for an exhilarating adventure into the land of Chainlink. This golden EMA 20 - indicating a bullish trend - acts as a beacon for new buyers, beckoning them towards a potentially profitable journey.
Let me be clear - this is not just another hyped-up project! Chainlink has consistently demonstrated its strength and resilience within the market, boasting a strong track record and earning the trust of both traders and industry experts. Its fundamental technology, harnessing the power of smart contracts, ensures transparent and secure transactions with immense potential use cases across various industries.
So, here's the call-to-action - Join the Chainlink revolution NOW and witness your trading strategies soar to new heights! Seize the moment and embark on this thrilling journey with strength, courage, and conviction. Take advantage of the EMA 20 indicator, which tells a promising story about the future of Chainlink, showing great potential for substantial gains.
Whether you're a seasoned trader or just starting out, Chainlink promises an exciting adventure filled with astounding profit possibilities. Don't let this opportunity slip through your fingers. Embrace the spirit of exploration, the thrill of the market, and the allure of a technology that has the potential to reshape the way we interact with the digital world.
Ready to dive into the world of Chainlink? Take that leap of faith today! Let your trading journey be guided by the energy and excitement that Chainlink harnesses. Feel the surge of adrenaline as your profits skyrocket alongside the growing demand for this game-changing cryptocurrency.

LETS GO TON 14.5$*-Technical Analysis 📈
next pullback to berak-zone and sharp-move now lets go to finish 2-leg
*-Trade (Buy) 📊
10$ - 10.6$
*-Stop Loss 🔴
9.7$
*-Take Profit 🎯
13.72$ - 14.5$
*-Risk Management 🚧
3-5 %
👨🎓 Experience and Education: Our trading team has five years of experience in financial markets, especially cryptocurrencies.

LINK Price Alert and Call-to-Action for Patient TradersI wanted to bring to your attention an important development in the LINK market that requires your immediate attention. As an avid trader, I believe it is crucial to stay informed about potential opportunities and risks that may impact our investment decisions.
Over the past few days, I have been closely monitoring the Aroon indicator on the 2-hour timeframe for LINK. It has come to my attention that the Aroon is showing a significant drop, indicating a potential upcoming downturn in the price of LINK. While this may be concerning to some, I believe it presents an opportunity for patient traders like us.
Based on my analysis, I predict that LINK has the potential to hit $18 in the near future. However, it is important to exercise caution and approach this opportunity with patience. Market fluctuations can be unpredictable, and we must be prepared for potential volatility in the short term.
Considering the current market conditions and the potential for LINK to reach $18, I encourage you to consider a long position on LINK. However, it is crucial to approach this trade with a patient mindset, as it may take some time for the price to reach our target.
In light of this information, I invite you to carefully evaluate your trading strategy and consider adjusting your portfolio accordingly. By taking a long position on LINK, you can potentially benefit from the expected price increase. However, please remember to exercise proper risk management and set stop-loss orders to protect your investment.
Remember, successful trading requires discipline and patience. While we anticipate LINK to hit $18, it is important to be prepared for potential market fluctuations and to adjust your trading strategy accordingly. By staying informed and making well-informed decisions, we can increase our chances of success in this volatile market.
I encourage you to conduct your own analysis and research before making any trading decisions. If you have any questions or require further assistance, please do not hesitate to reach out to me. Let's stay connected and support each other on this trading journey.
Wishing you profitable trades and success in your investment endeavors.

Celebrating Chainlink's Remarkable 76% RiseChainlink has soared a staggering 76% to become the top-performing cryptocurrency of the moment. 🚀🎉
It's moments like these that remind us why we love being a part of the crypto trading community. The thrill of witnessing such remarkable growth and seizing profitable opportunities is truly electrifying. And with Chainlink's recent surge, it's time to ride this wave of success together!
If you haven't already considered it, now is the perfect time to explore the potential of long positions on Chainlink. With its impressive momentum and strong market presence, Chainlink has proven itself to be a force to be reckoned with. By going long on Chainlink, you have the opportunity to capitalize on this upward trend and potentially maximize your returns.
Here's why I think going long on Chainlink could be a game-changer for you:
1. Unprecedented Growth: Chainlink's recent 76% surge is a testament to its potential as a top-performing cryptocurrency. This kind of growth is hard to ignore, and by going long, you position yourself to benefit from further upward movements in its price.
2. Strong Market Presence: Chainlink has established itself as a trusted and reliable player in the crypto market. With numerous partnerships and integrations, it has proven its value and utility, making it an attractive choice for long-term investors.
3. Technological Innovation: Chainlink's cutting-edge technology, particularly its decentralized oracle network, has gained significant recognition within the blockchain industry. Its ability to connect smart contracts with real-world data is revolutionizing various sectors, including finance, insurance, and supply chain management.
Now, I don't want you to miss out on this incredible opportunity. Take a moment to assess your trading strategy and consider how going long on Chainlink aligns with your goals. Remember, the crypto market is highly dynamic, and staying ahead of the curve can be immensely rewarding.
If you need any assistance or have any questions regarding Chainlink or any other trading opportunities, please don't hesitate to reach out by commenting below. I'm here to support and guide you in making informed decisions that align with your trading objectives.

$LINKUSDT LONG. Bossco Algo caught every $LINK bullrun
BINANCE:LINKUSDT long entry has been in play. Bossco Algo caught every BINANCE:LINKUSDT bullrun.
Pity that TV took down my old post since it referenced an outside URL where entries are called in real time ...
Model Architecture:
• 1,000+ hours of quantitative research.
• 1,000+ machine hours of backtesting & forward testing.
• Based on pure price action, zero bias, zero emotions (see methods tested 👇)
• Long & Short, Execution on 4H timeframe
All methods tested:
Why share?
• It's my model, so I get the model signals first. I'll already be positioned in my longs, so I don't really care if you enter or not. Hedge fund PMs literally have dinners where they talk their own book after positioning.
• Signals are on a high timeframe on liquid assets, so you should be able to get in at the same price. You can't stop hunt me, because I don't post stop losses.
I will never give away the code or the techniques selected . No one gives away proprietary quant models that actually work. Please don't ask.
I don't plan on ever making signal access paid, since I want a public record of proof that the signals are real. I make my money through trading, not scam discords or courses.
Model output is for research purposes only. Not financial advice.

Celebrating Chainlink's New Yearly High! Join the Long Party Chainlink (LINK) has just hit a new yearly high, and the celebrations are in full swing! 🎉🚀
Chainlink has been on an incredible journey this year, defying all expectations and surpassing milestone after milestone. Its upward trajectory has been nothing short of remarkable, and we couldn't be more thrilled to witness this groundbreaking achievement together.
Now, you might be wondering, what does this mean for us as traders? Well, it's an opportunity we simply cannot afford to miss! With Chainlink's continuous upward momentum, it's the perfect time to consider going long on LINK and ride the wave of success.
Why long Chainlink, you ask? Allow me to present you with a few compelling reasons:
1. Unmatched Performance: Chainlink has consistently outperformed the market, demonstrating its resilience and ability to generate substantial returns for investors.
2. Strong Market Position: As one of the leading decentralized oracle networks, Chainlink has established itself as a crucial player in the blockchain ecosystem. Its partnerships with major industry players only reinforce its position as a reliable and innovative project.
3. Growing Adoption: Chainlink's technology is gaining widespread adoption across various industries, including finance, gaming, supply chain, and more. This growing demand for decentralized oracles further solidifies Chainlink's long-term potential.
4. Community Support: The Chainlink community is passionate, engaged, and constantly pushing the boundaries of what's possible. Being part of this vibrant community not only provides valuable insights but also fosters a sense of camaraderie and shared success.
So, my dear traders, it's time to seize this opportunity and take advantage of Chainlink's new yearly high. Don't let this train pass you by! Let's make the most of this bullish momentum and embark on a profitable long position with LINK.
If you're ready to join the party and go long on Chainlink, I encourage you to take action today. Conduct thorough research, analyze the market trends, and ensure you make an informed decision that aligns with your trading strategy. Remember, our success lies in our ability to adapt and capitalize on emerging opportunities.
Wishing you joyful trading and abundant profits as we celebrate Chainlink's remarkable achievement! Should you have any questions or need support along the way, please don't hesitate to reach out by commenting below.

Chainlink Bull Run May Lose Momentum
The current state of Chainlink's bull run seems to be showing signs of losing momentum. As an informed trader, it is essential to remain cautious and consider the potential risks associated with any investment decision.
Over the past few months, Chainlink has witnessed an incredible surge, capturing the attention of many traders and investors. The project's innovative approach and promising technology have undoubtedly contributed to its success. However, it is crucial to recognize that every bull run eventually encounters a point of exhaustion, and Chainlink may be nearing that stage.
Several indicators suggest that the momentum behind Chainlink's upward trajectory is beginning to wane. The recent price fluctuations, coupled with a lack of significant positive news, have raised concerns among market analysts. While no one can predict the future with certainty, it is prudent to approach Chainlink trading with caution at this juncture.
In light of these observations, I would like to encourage you to pause and reevaluate your trading strategy regarding Chainlink. Taking a step back to assess your positions and reassess the market sentiment can help ensure that you make informed decisions that align with your risk appetite.
Moreover, it is crucial to diversify your portfolio and not solely rely on a single asset, especially during times of uncertainty. Allocating your investments across different cryptocurrencies or asset classes can help mitigate potential risks and provide a more balanced approach to trading.
Remember, successful trading requires a comprehensive understanding of the market dynamics and a disciplined approach. While Chainlink's bull run has been impressive, it is essential to remain cautious and avoid being swayed solely by the excitement surrounding its recent performance.
As always, I encourage you to conduct thorough research, stay updated with the latest news and developments, and consult with trusted financial advisors before making any investment decisions.
Should you have any questions or require further insights, please do not hesitate to comment below. I am here to assist you in navigating the ever-evolving cryptocurrency market.

Chainlink Pushes Towards $12 with Positive EMA and MACD IndicatoWith the EMA period and MACD indicators both staying positive, Chainlink is making significant strides towards the $12 mark. It's time to seize this opportunity and consider a long position on Chainlink!
The current market conditions have provided us with a strong bullish trend for Chainlink, and the EMA period and MACD indicators are reinforcing this positive sentiment. As the EMA continues to climb steadily, it reflects the sustained upward momentum of Chainlink's price. Additionally, the MACD staying positive indicates that the buying pressure is outweighing the selling pressure, further supporting the bullish outlook.
Now, you might be wondering, what does this mean for you as a trader? Well, it's an exciting chance to capitalize on Chainlink's upward trajectory! By taking a long position on Chainlink, you have the potential to ride the wave of its growth and potentially reap substantial profits. The positive EMA period and MACD indicators serve as strong signals that the upward momentum is likely to continue, making it an opportune time to consider entering a long position.
So, what's the next step? Don't miss out on this fantastic opportunity! I encourage you to carefully analyze the market conditions, conduct thorough research, and consider taking a long position on Chainlink. As always, it's essential to have a solid risk management strategy in place and stay updated on the latest market developments.
Remember, trading is all about seizing opportunities, and Chainlink's current positive trend is one you definitely don't want to overlook. Stay positive, keep your spirits high, and let's make the most of this exciting market movement together!
If you have any questions or need further assistance, feel free to comment below. I'm here to support you on your trading journey.

Chainlink: The Unstoppable Force Dominating the Crypto Market! Chainlink has been on an unstoppable rampage in the crypto market, boasting an astonishing 59% return over the past three months! 📈🔥
Yes, you read that right! Chainlink has been flexing its muscles and leaving other cryptocurrencies in the dust. It's been a wild ride, and if you haven't jumped on the Chainlink train yet, now is the perfect time to hop aboard and experience the exhilarating gains for yourself!
Why Chainlink, you ask? Well, let me tell you. Chainlink has been revolutionizing the blockchain industry with its cutting-edge technology and real-world applications. Its decentralized oracle network has garnered immense attention from major players in the market, propelling it to new heights.
But enough about the past, let's focus on the future. Chainlink's potential is still untapped, and as traders, we have the opportunity to ride this wave of success to even greater heights. So, here's my call-to-action for you: it's time to long Chainlink and seize the moment!
Don't let this opportunity slip through your fingers. Join the ranks of savvy traders who have already recognized Chainlink's potential and are reaping the rewards. With its strong fundamentals and a dedicated community backing it, Chainlink is poised to make even more waves in the coming months.
So, grab your trading gear, fuel your excitement, and let's embark on this thrilling journey together! Long Chainlink and be a part of the unstoppable force that's dominating the crypto market.

LINKUSDT.1DBased on the given market data, the current price of LINK is 10.819 USDT. The Relative Strength Index (RSI) for 4 hours, 1 day, and 7 days are 61.23, 83.32, and 74.02, respectively. Typically, an RSI above 70 indicates an overbought condition, suggesting that a price drop may be imminent. Thus, the 1-day and 7-day RSI levels indicate that LINK could be overbought.
The Moving Average Convergence Divergence (MACD) for 4 hours, 1 day, and 7 days are 0.378, 0.939, and 0.505, respectively. This indicates a bullish trend in the short, medium and long term.
The Bollinger Bands (Bb) for 4 hours, 1 day, and 7 days are 11.788, 11.446, and 11.560, respectively. The current price is slightly below the middle band, suggesting a neutral trend.
The support levels for 4 hours, 1 day, and 7 days are 10.056, 8.359, and 7.086, respectively. The resistance levels for the same periods are 11.932, 14.321, and 11.828, respectively. This indicates that the price has a potential to go up or down but given the RSI, a downward movement could be anticipated.
In conclusion, while the MACD indicates a bullish trend, the overbought RSI levels suggest there may be a pullback in the short term. However, the market is unpredictable and it's essential to consider other market factors and conduct a comprehensive analysis before making investment decisions. Always ensure to invest wisely.

LINKUSDT - Breakout after an extended Period of Consolidation!!LINKUSDT (1D Chart) Technical analysis
LINKUSDT (1D Chart) Currently trading at $8.2
Buy level: Above $8.1
Stop loss: Below $7
TP1: $9.5
TP2: $12
TP3: $14
TP4: $18
Max Leverage 3x
Always keep Stop loss
Follow Our Tradingview Account for More Technical Analysis Updates, | Like, Share and Comment Your thoughts

LINKUSD reminding us of its glorious days.Chainlink (LINKUSD) smashed through our 8.000 target (and the Lower Highs) that we set on the September analysis (see chart below):
The price made a 17-month High, broke above the 1W MA100 (green trend-line) for the first time since the week of February 07 2022 and has essentially welcomed the new Bull Cycle as it's now above even the Bear Cycle's Lower Highs. The last Resistance standing is the 1W MA200 (orange trend-line), currently at 13.1636.
We have shifted our focus on the more long-term 1W time-frame as it allows us to compare LINK with the previous Cycle, at the time when the 1W RSI first turned overbought above 70.00 (as it has now). That was on the week of May 13 2019, on a strong 3-week rally (as currently), with the 1W MA50 (blue trend-line) turned into Support.
The rally didn't stop there but instead extended up to the 2.618 Fibonacci extension. There is no reason to expect a stop before at least $18.00, which is the March 2022 High. The 2.168 Fibonacci is a little over $20.00.
-------------------------------------------------------------------------------
** Please LIKE 👍, FOLLOW ✅, SHARE 🙌 and COMMENT ✍ if you enjoy this idea! Also share your ideas and charts in the comments section below! This is best way to keep it relevant, support us, keep the content here free and allow the idea to reach as many people as possible. **
-------------------------------------------------------------------------------
💸💸💸💸💸💸
👇 👇 👇 👇 👇 👇

Celebrating LINK's Remarkable Breakthrough - Long LINK Our beloved LINK defied expectations and broke through its one-year trend with an incredible 13% jump! 🚀
Let's take a moment to appreciate the magnitude of this achievement. LINK has not only shattered the barriers of its previous trend but has also shown its potential for continued growth. This remarkable breakthrough is a testament to the strength and resilience of the LINK community and its long-term vision.
Now, you might be wondering, what does this mean for you as a trader? Well, my friends, it means that there's an incredible opportunity knocking at your door. The time has come to consider joining the long LINK movement and seize the potential for further gains.
Why long LINK, you ask? Here are a few compelling reasons:
1. Momentum: LINK's recent surge has demonstrated its ability to defy trends and propel itself to new heights. By long LINK, you can ride the wave of this positive momentum and potentially maximize your profits.
2. Strong Fundamentals: LINK's underlying technology and the team behind it have repeatedly proven their worth. With a solid foundation, LINK has the potential to continue its upward trajectory.
3. Diverse Use Cases: LINK's integration with smart contracts and decentralized finance (DeFi) applications has opened up a world of possibilities. As the demand for DeFi grows, LINK's value is poised to follow suit.
So, how can you get in on the action? It's simple! Take a moment to evaluate your trading strategy and consider adding a long position on LINK to your portfolio. Keep a close eye on market trends, set realistic targets, and remember to diversify your investments for a well-rounded approach.
Remember, trading is both an art and a science, and timing is everything. While the past performance of LINK is no guarantee of future results, it certainly provides us with an exciting opportunity to capitalize on its recent breakthrough.
As always, please conduct thorough research, consult trusted advisors, and make informed decisions aligning with your risk appetite and financial goals.


🔗Chainlink(LINK)🔗will Go Down by Triangle⏰(1-Hour)⏰Hi, everyone👋.
🔗Today, I decided to analyze Chainlink(LINK) for you. I hope that it is useful to analyze.
📚 What Is Chainlink(LINK) ❗️❓
🔸Founded in 2017, Chainlink is a blockchain abstraction layer that enables universally connected smart contracts. Through a decentralized oracle network, Chainlink allows blockchains to securely interact with external data feeds, events, and payment methods, providing the critical off-chain information needed by complex smart contracts to become the dominant form of digital agreement.
🔸The Chainlink Network is driven by a large open-source community of data providers, node operators, smart contract developers, researchers, security auditors, and more. The company focuses on ensuring that decentralized participation is guaranteed for all node operators and users looking to contribute to the network.
🚩It seems that Chainlink(LINK) is creating a Contracting Triangle between two areas of 🟢Support🟢 and 🔴Resistance🔴 .
🔔I expect Chainlink(LINK) to move towards the 🟢 support zone($7.34-$7.13) 🟢 after breaking the lower line of the Contracting Triangle .
Chainlink Analyze (LINKUSDT), 1-hour time frame ⏰.
Do not forget to put Stop loss for your positions (For every position you want to open).
Please follow your strategy; this is just my Idea, and I will be glad to see your ideas in this post.
Please do not forget the ✅' like '✅ button 🙏😊 & Share it with your friends; thanks, and Trade safe.

CHAINLINK - 06/10/23LINK
It looks like #ChainLink wants to take out the $8.271 SUPPLY or at least tap it, could the cup and handle be about to play out?
This is going to depend on BTC breaking out the range it is stuck in.

LINKUSDT - 05/10/23LINK
NOTES:
We look like we are ready to take off here from a cup handle on the 4hr, if BTC breaks out and does the move I'm in the trade for then this will break $8 today!
Targets:
Bullish: $8.80 then $9.50 are my take profits if BTC pumps or this breaks the SUPPLY at $8!
Bearish: $7.00 could be a last leg down before they push up and break if the handle I made doesn't hold I will not take this trade unless the handle breaks and tests!

LINKUSDT - 04/10/23LINK
First out the traps for a pullback to test the $7.70 area will see what the pullback to the 50 EMA will be for an entry on the 15 minutes for scalp!
I want a bounce then ill look to enter again until the high!
