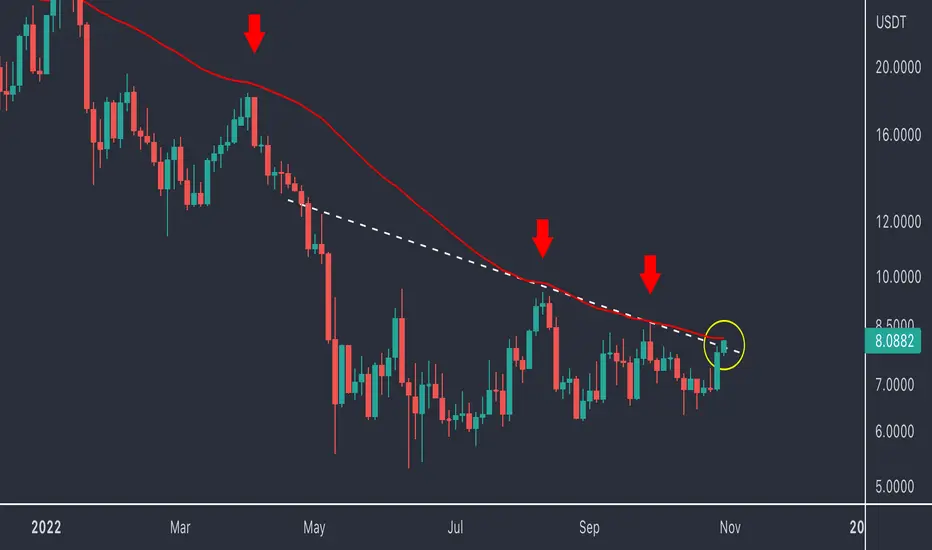
Long Entry at Strong LT Support Zone for CHAINLINKGreetings, Snipers!
LINK has been consolidating sideways from $5.30 - $9.50 since May 2022
Two long-term trendlines from 2020 have been well-respected as support. As you know, the longer the time-frame, the more reliable the signals.
In the shorter time frame, we can trade this sideway channel:
We can take a long-entry now, at $6.00, and sell at $9.00 for a Risk-Reward ratio >3 (SL at $5.20).
If Bitcoin cannot hold the current support, we may see Link drop to the next support at $4.30.
Hope you enjoy my first post! I wish to give back to the community, more or less, after lurking around for so long :)
Happy Sniping!
Linkusdsignals

LINK - The Bearer of Bad News & Great NewsLink has been hovering around the 0.382 fib retracement for quite a while, tested it 3 times, i never trust the 4th nor the 5th test on a support line.
"Stop talking gibberish and give us the bad news nah"
Bad Nus: $LINK will go down another 80%-90% :D before this bear market is over.
Great Nus: $LINK will be a $1k-$2k token at the peak of the next Bull Run.
- Weekly MACD (Bearish)
- Weekly Pekipek's Divergence BETA (Bearish)
- Weekly RSI (Neutral)
- Weekly Stochastic RSI (Neutral)
- Weekly Cipher (Bearish)
- Weekly OBV (Bearish wtf OBV r u in distribution mode?)

Link bulls are in the way Hello guys, as you can see price create very bullish sign in the middle of trading range if it could break above blue line , what I expect is pomp for Link
Stay safe ;)

Link 8HRising wedge under the important resistance zone, a good setup for the short position.
#link
#chainlink

$LINK to 6.40 $ USD?I have found a Rising Wedge in the Link/USDT pair with base targets
1️⃣6.89🎯
2️⃣6.67🎯
3️⃣6.40🎯
4️⃣6.03🎯

Link looking goodaccumulating link down at these prices
if we can flip 8 to support might see a nice move up

LINKUSD: Was It a Fake Bullish Breakout? 😱 | Nov. 25, 2022This week, we will stick to the 4-hour time frame to analyze the price action in detail!
It seems like a false bullish breakout was seen earlier this week following which a strong rally was witnessed. Seems like the price will soon approach the next resistance situated at $7.35. If the resistance is reclaimed by the bulls, traders can expect a strong rally in the coming week.
Once the resistance at $7.35 is reclaimed, we can see a clear path to the supply zone at $8.51. However, this view is only valid once the price is able to sustain above $7.35.
Traders must maintain caution of the demand zone at $6 because if this zone is broken once again, a sharp fall could be seen. At the time of writing, it looks like we may see a small pullback as the RSI has started falling. Expect the price to test the support at $6.3 before continuing the rally.
The important price levels for this week are $6.3 and $7.35!

LINKUSDT Long3 month consolidation within this range. Reclaim of support, with LTF showing HH and HL.
Long with SL at 5.51, targeting range highs.

LINK Is Trading Too Close to Support! What's Next? 😨 Nov. 18In our previous analysis, we ascertained if the support at $7.5 is taken out, the price will test the last standing support at $6.2.
At the time of writing, LINK is trading dangerously close to the support at $6.2, and it looks like a breakdown could be seen soon.
If this support is broken, traders can expect the price to collapse to $5.2, which is the 52-week low.
Therefore, traders should proceed with caution until LINK is able to reclaim the resistance at $6.5.

Link update Link now in clear down trend , after breaking the descending triangle , i believe its going to 2$ area .
70% down from the top of triangle .
GOOD LUCK

LINK on the verge of breakout !LINK / USDT
ChainLink try to break both dynamic and trendline resistance
If breakout done ✔️ November will be a good bullish month for LINK
Keep your eyes on it
LINK :: Path Forward :: Nov 1Orange lines = Strong support/resistance lines.
Teal lines = Probable path forward until it break above or below.

LINK :: Support/Resistance Levels :: 1DThe distance between each S/R is about 22%. The current line needs to hold for a small rally.

LINK ANALYSISLINK has broken below to the symmetrical triangle on DAILY which is not a good sign for the LINK holders.LINK must close in the symmetrical triangle on DAILY candle but if gets rejected from the resistance ,downside move might continue.

LINK - Buying SignalBYBIT:LINKUSDT
1D time frame
-
LINK forms an ascending triangle here, the resistance zone is around 9.2, and an uptrend supports price continuously.
Now the price retests uptrend again, so we can open long here.
-
Entry: 6.93
Add: 6.82
TP: 7.7
SL: 6.5

LINK : Bearish setup here...Link is trading inside a bearish pennant like pattern and if price breaks below the trendline, Expecting more downside for Chainlink.
Traders can keep manual stoploss of hold above 7.2

LINK/USDT :: Under $8 .LINK/USDT :::
The price is in the lower part of the middle line and will slowly move towards the middle line and then towards the ceiling of the channel. Long position is a good choice .

LINK looking bullish in short-termNotice a lower high, higher low pattern on LINKUSDT. Time to place some bet on. My side is LONG (if we can find a good entry, otherwise, never FOMO)
Entry: 6.83x
SL: 6.47x
TP1: 7.95x
TP2: 9.3xx


LINK is a SLEEPING GIANTThe value potential on LINK is incredible and how could someone not take this opportunity to load up? We are now on the verge of closing above a range that could launch the price to almost 30%. Bullish divergence on the weekly along with all other major timescales as we start to slowly see the tides turning and crypto not following other major markets as they look to be decoupling in some ways….. LINK


Link shortLink is making a bearish trend in 4 hour tf.if we see a some correction it’s not be strange
