LINK/USDT Assessing Bullish Potential from Key Support?👀🚀LINK💎 Paradisers, let’s focus on #LINKUSDT as it demonstrates a critical juncture in the market. Currently holding a key support level, it is showing signs that point towards a potential bullish movement.
💎 #CHAINLINK has consistently respected the support level at $14.988 without breaking below it. This steadfastness in maintaining its position above this support level is now leading to a heightened probability of a bullish trend, targeting the significant resistance at $17.206.
💎 However, in the ever-changing landscape of the crypto market, the ability to adapt strategies is vital. If #LINK faces challenges in maintaining its stance above the $14.988 support, we may need to recalibrate our approach.
💎 This could involve preparing for a bullish resurgence from a slightly lower support level at $14.769. Crucially, if BIST:LINK falls below this secondary support, it could signal a shift towards a bearish market direction. 🌴💰
LINKUSDT

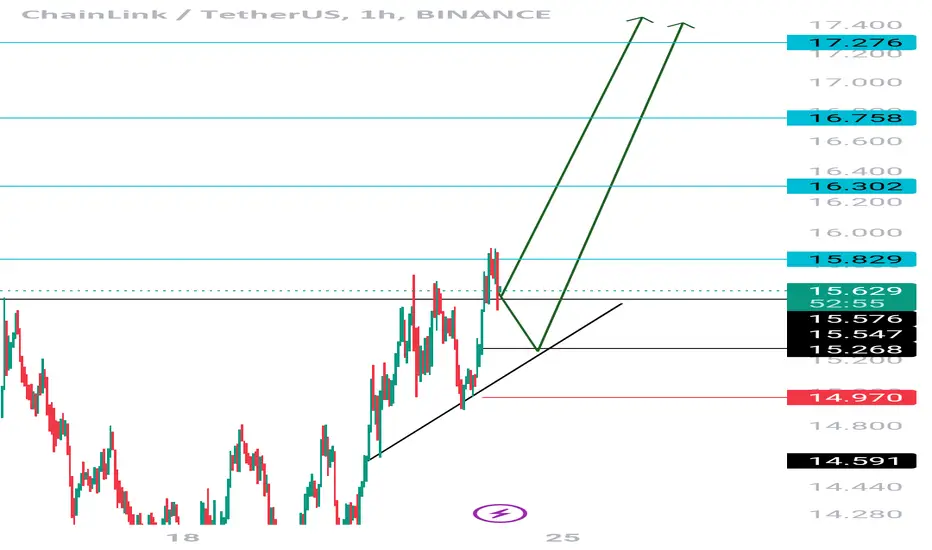
So start again up-trend(LINK)❤️❤️Thanks for boosting 🚀 and supporting us!
📈Back to again start . Startes .
📊 (Entry) : 14.86
🔴 Stop Loss : 14.17
🎯 Take Profit : 15.47-15.95-16.70-17.30
🔗 For more communication with us, In the footnote and send a message in TradingView.
👨🎓 Experience and Education: Our trading team has five years of experience in financial markets, especially cryptocurrencies.

LINK prepare for longTime is running out for a good LINK entry!?
It's time to prepare for Chainlink bull run!
If the market decide to make a big "ETF-move" - I see LINK leave the bull flag with speed and never come back.
I see next big stop at 27 dollar - potential 85%.
I still think 15 dollar for LINK is really cheap, but 14.0 - 14.6 could be nice area for some limit orders!
I will not wait for any break and retest of the bull flag, I have way to much confidence in LINK and I also plan to hold link "forever".
I don't think the big money will ignore LINK, when it starts to move!

Link/USDT strong demand areaLINK/USDT
This area of demand for the link is very important and can push the price up
Trade according to the personal capital management system and after receiving the entry trigger

linkIt has an important support in this area, which I hope will not be broken and will start an upward movement

LINK/USDT - Chainlink: Falling Wedge◳◱ On the $LINK/ CRYPTOCAP:USDT chart, the Falling Wedge pattern suggests a pause in volatility, potentially gearing up for a breakout. Traders might observe resistance around 16.264 | 17.265 | 19.582 and support near 13.947 | 12.631 | 10.314. Entering trades at 15.259 could be strategic, aiming for the next resistance level.
◰◲ General info :
▣ Name: Chainlink
▣ Rank: 16
▣ Exchanges: Binance, Kucoin, Bybit, Huobipro, Gateio, Mexc
▣ Category/Sector: Services - Data Management
▣ Overview: Chainlink is a decentralized oracle network. It aims to serve as a middleware between smart contracts on smart contracting platforms and external data sources, allowing smart contracts to securely access off-chain data feeds.
◰◲ Technical Metrics :
▣ Mrkt Price: 15.259 ₮
▣ 24HVol: 75,890,616.439 ₮
▣ 24H Chng: -4.917%
▣ 7-Days Chng: -2.66%
▣ 1-Month Chng: 5.93%
▣ 3-Months Chng: 89.72%
◲◰ Pivot Points - Levels :
◥ Resistance: 16.264 | 17.265 | 19.582
◢ Support: 13.947 | 12.631 | 10.314
◱◳ Indicators recommendation :
▣ Oscillators: NEUTRAL
▣ Moving Averages: SELL
◰◲ Technical Indicators Summary : SELL
◲◰ Sharpe Ratios :
▣ Last 30D: 0.96
▣ Last 90D: 3.18
▣ Last 1-Y: 1.59
▣ Last 3-Y: 0.58
◲◰ Volatility :
▣ Last 30D: 0.85
▣ Last 90D: 0.93
▣ Last 1-Y: 0.75
▣ Last 3-Y: 1.09
◳◰ Market Sentiment Index :
▣ News sentiment score is 0.74 - Bullish
▣ Twitter sentiment score is 0.59 - Bullish
▣ Reddit sentiment score is 0.50 - Bullish
▣ In-depth LINKUSDT technical analysis on Tradingview TA page
▣ What do you think of this analysis? Share your insights and let's discuss in the comments below. Your like, follow and support would be greatly appreciated!
◲ Disclaimer
Please note that the information and publications provided are for informational purposes only and should not be construed as financial, investment, trading, or any other type of advice or recommendation. We encourage you to conduct your own research and consult with a qualified professional before making any financial decisions. The use of the information provided is solely at your own risk.
▣ Welcome to the home of charting big: TradingView
Benefit from a ton of financial analysis features, instruments and data. Have a look around, and if you do choose to go with an upgraded plan, you'll get up to $30.
Discover it here - affiliate link -

LINK - Wyckoff Reaccumulation Schematic#LINK
Link is following a texbook Wyckoff Reaccumulation Schematic as seen in one from an ETH chart on the left, which includes an Elliott's Wave ABC then another, once liquidity has been grabbed on the 3rd pop up.
* Note there is usually a variance between the schematic images when compared to real time Cryptoland due to what I assume is high leverage stop hunting.

LINK - Liquidity Grab then Double Bounce to Infinity#LINK Update
Projection unfolding as it has multiple times across history. First grab some liquidity then one last bounce on top of support before moonshot...

Link headed up?!If you find this information inspiring/helpful, please consider a boost and follow! Any questions or comments, please leave a comment! Also, check out the links in my signature to get to know me better!
BIST:LINK update. 🧵
Followed the path on the left and bounced
close to the level provided.
Now we get to find out what it is.
PTT and W5 MLT for the conservative bull count.
Falling back from here, could lean X/B complete...
But, hope it keeps climbing.

LINK/USD Main trend. Wedge. 53$ - 5,3$ = -90%Basic tendency. Logarithm. The time interval is 1 week.
A clear downward wedge was formed in the pair to the dollar. Pay attention that the maximum is $53, and the minimum is $5.3. It is interesting that it is exactly -90%. This makes it clear that the price is completely "manageable."
A line chart to understand the direction of the trend and the wedge.
Secondary trend.
LINK/USDT Secondary trend. Downward wedge.
Alts should be looked at starting at -90%.
But I want to remind you that -96% is also -60% of -90%.
It's the average set and reset price that matters, but this logic should always be kept in mind. Averaging, this is not buying "cheap", but buying in potential trend reversal zone, if past buying turned out to be wrong (very relevant for those who work with large amounts and keep most of their cryptocurrency on wallets).
You have bitcoins and you don't want to sell most of them for any money, neither cheap nor expensive? Then HYIP, a cryptocurrency, is designed to take them away from you!
Then, after a few cycles of hype around another promising crypto-monet, former bitcoin holders will be collecting satoshis and remembering, "I used to have a lot of bitcoins... But I wanted to get rich so badly that I lost them all...". With each coin prospect and with each jump in the market cycle, my balance decreased, and now I have pennies compared to my former numbers...
Illusory money prospects and trivial greed can deceive you. With these two components of the market, you have to stay at arm's length.

LINK/USDT Secondary trend. Downward wedge.Logarithm. Secondary trend. Downward wedge.
A clear downward wedge was formed in the pair to the dollar. In case of its breakage, I showed the maximum potential.
Note that the maximum is $53, and the minimum is $5.3 Interestingly done, that is exactly -90%. This makes it clear that the price is completely "manageable. People do not influence the price, they are directed to form the desired price.
A line chart to illustrate the key pivot zones.
Alts should be looked at starting at -90% .
But I want to remind you that -96% is also -60% of -90%.
It's the average set and reset price that matters, but this logic should always be kept in mind. Averaging, this is not buying "cheap", but buying in potential trend reversal zone, if past buying turned out to be wrong (very relevant for those who work with large amounts and keep most of their cryptocurrency on wallets).
The main trend. Time frame 1 week.
LINK/USD Main trend. Wedge. 53$ - 5,3$ = -90%

LINKUSDT - Elliott Wave Analysis - BullishBINANCE:LINKUSDT LINKUSDT - Elliott Wave Analysis - Bullish
Article: The price chart analysis of ChainLink (LINK) using the Elliott Wave Theory, with lines drawn by this indicator, highlights it as one of the cryptocurrencies to watch.
The long-term (1-week) price chart of ChainLink (LINK) has shown a bullish movement since 2020, breaking through several key resistance levels and continuing to climb steadily.
The structure created by the indicator's automatic line drawing clearly shows that we are potentially in wave 3 of a bullish trend while concurrently in wave C of a bearish correction. Therefore, we expect prices to reach levels at $86, $105, and $137 respectively.
However, other factors should be considered when forecasting future price directions such as fundamental asset factors, technical factors, and economic conditions. The fundamentals for LINK are strong due to its popularity as a DeFi project with increasing real-world usage. Technical indicators support an upward trend.
Factors supporting the upward trend for ChainLink include:
Growth in real-world usage of ChainLink.
Partnerships with new allies.
Launching new products and services.
Risks against the upward trend for ChainLink include:
Global economic recession.
Volatility in cryptocurrency markets.
Competition from emerging technologies.
Conclusion
In summary, the long-term (1-week) ChainLink price chart indicates a robust upward trend, with expectations of breaking through key resistance levels, specifically at $53. Currently, the price is in an accumulation phase, poised for a soon-to-come upward adjustment. Additionally, it is noteworthy that the price has been consistently adjusting upward on a weekly basis.

LINKUSDT #1 ( Bullish rally road map ! ) Hello dear traders.
Good days .
LINKUSDT broken decreasing channel and important Monthly Gann Square Fan trend line with strong surge . As I mentioned in chart , LINKUSDT broken Daily Gann Square Arc resistance with same move . For continuing the bullish rally , expected to get support from Broken Monthly Gann Square Fan trend line at reversal time zone which defined on chart .
Rally road map is plotted with help of Gann Square & Gann box .
Good luck and Safe trade.
Thanks for your support and comments.

LINK - The Stair Step + Double Bounce#LINK
After a beautiful ABC correction after an Impulse wave #Link has taken multiple shots and cracked up through resistance and is now coiling up and stair stepping on top of support.
When PA is as clean as this, with volume in all the right places. Yes there is incredible potential for clean gains, but more than that it's a spectacular example to learn from IMO.
Such a beautiful illustration of how support & resistance work. I hope this helps provide a lens through the noise of PA so you can truly appreciate what's taking place in plain sight and hopefully also how to use this as a map for future gains.

I Cannot Short This !!! situation+next targets.LINKUSDT is in an ascending triangle which means the price is about to do a good bullish movement. The price can increase as much as the measured price movement ( AB=CD ) .The break out needed for increasing further has not happened but it should happen pretty soon.
🤑Stay awesome my friends.
_ _ _ _ _ _ _ _ _ _ _ _ _ _ _ _ _ _ _ _ _ _ _ _ _ _ _ _ _ _ _ _ _
✅Thank you, and for more ideas, hit ❤️Like❤️ and 🌟Follow🌟!
⤵️⤵️⤵️⤵️⤵️⤵️⤵️⤵️⤵️⤵️⤵️⤵️⤵️⤵️⤵️⤵️⤵️⤵️⤵️⤵️⤵️⤵️⤵️

LINKUSDT Long PositionEverything Mentioned In The Chart
Use Proper Risk Management And Financial Advice

LINK-Beautiful Rising ABC Flag, Stair Stepping Up Out Of A Wedge#LINK
- Beautiful Rising ABC Flag
- Stair Stepping Up Out Of A Wedge
- Multiple Precision Touches On POI's
- Observe Reactions From POI's
- Volume In All The Right Places
= Number Go Up

Link/Usdt is showing robust strength and potential. Link/USDT is showing promising signs. It looks like it's gearing up for a bullish move, and I anticipate the price to increase by 15-30% in the coming days. However, it's important to note that this is not financial advice, so please do your own research (DYOR) before making any decisions.
LINK - Gearing up for MASSIVE GainsHi Traders, Investors and Speculators of Charts📈📉
For a while now, LINK has been trading in a very clear accumulation phase. This is the zone we see after a bearish cycle and BEFORE a new bullish cycle.
Chainlink can be very "wicky", and often the price will go JUST UNDER/OVER the resistance zone, or JUST UNDER/OVER the support zone. This makes it hard to give precise entry points. Working within ranges and choosing the lower part of the range is the safest best to protect against those ugly wicks.
Here are some easy setups that guarantee profits during the next bullish cycle - but you will have to have packed-bags in order to bag-in on profits!
_______________________
📢Follow us here on TradingView for daily updates and trade ideas on crypto , stocks and commodities 💎Hit like & Follow 👍
We thank you for your support !
CryptoCheck
COINBASE:LINKUSD BINANCE:LINKUSDT

🚨 Breakout after several touches to the level. SHORT #LINKSHORT #LINKUSDT from $13.64
There is a clear lows and compression of the price to the strong support level. Expecting the breakout after several touches to the level. Open short on high activity of tape. Target - 13.0

LINK/USDT 4HInterval ChartHello everyone, I invite you to review the LINK chart on a four-hour interval. In this case, we have a visible movement in the upward trend channel, where locally the price remains below a strong downward trend line.
Now let's move on to marking support points for the price and we can see that first of all we have a strong support zone from $14.38 to $13.58, which is located just at the lower border of the current channel, but if the price drops lower and breaks out of the channel , we can see a strong decline close to the height of the channel towards the support level of $11.26
Looking the other way, we can see that the price has currently bounced off the resistance level at $15.32, when we manage to break it higher, the price will move towards the strong zone and the upper border of the channel from the level of $17.14 to the level of 18.09 $.
Please look at the RSI indicator because you can see movements around the middle of the range, while the STOCH indicator, despite the increase, does not show a significant price increase on the chart, which may translate into further declines and an attempt to leave the channel at the bottom.

LINK: Sweeping lows to Grow Faster 🚀💰Let's unravel the latest dynamics of Chainlink (LINK) as it navigates the crypto seas with a distinctive flair. LINK is currently dancing within an ascending channel, and recent liquidity sweeps above the upper boundary signal intriguing possibilities. Here's a breakdown of the current scenario and what traders might expect in the upcoming chapters. 📊🚀
Analyzing LINK's Chart: Ascending Channel and Liquidity Game
Ascending Channel Dynamics:
Charting the Trajectory: LINK is gracefully traversing within the confines of an ascending channel, showcasing a structured upward movement.
Technical Significance: Ascending channels are often indicative of bullish trends, with higher highs and higher lows characterizing the pattern.
Strategic Liquidity Sweeps:
Breaking the Chains: Recent moves have seen LINK surging beyond the upper boundary of the channel, executing strategic liquidity sweeps.
Fueling the Surge: The clearing of liquidity above resistance levels, often driven by stop-losses, acts as fuel for potential upward acceleration.
Trading Strategy Insights:
Retesting the Waters:
Ideal Scenario: A retreat to retest the channel's upper boundary around $12 would not only validate the breakout but also offer an optimal entry point.
Pooling Liquidity: A potential drop to $12 can attract liquidity and set the stage for a robust upward move.
Catalysts for Growth:
Stop Loss Dynamics: Recognizing that stop losses act as accelerators for upward movements, the market may capitalize on these fueling mechanisms.
Key Levels: Keep a keen eye on critical levels, especially the retest around $12, for potential trend confirmation.
Price Projection:
Optimistic Outlook: In the event of successful retests and sustained bullish momentum, LINK could eye a significant hurdle at $20.
Conclusion:
Chainlink's dance within the ascending channel, coupled with strategic liquidity sweeps, sets the stage for an exciting chapter. Traders are advised to observe the potential retest around $12 as a strategic entry point, acknowledging the role of stop-loss dynamics in fueling rapid upward movements.
❗️Get my 3 crypto trading indicators for FREE! Link below🔑

LINK/USDT 4HInterval ChartI invite you to review the LINK chart in pair with USDT. First, we will use blue lines to mark the upward trend channel in which the price is approaching its lower boundary.
In this situation, we will unfold the trend based fib extension and check the support areas. And here we can see that the price is above the strong support zone from $14.42 to $13.60, but if it goes lower, we can see a break from the channel and return to the support area at $11.31.
Looking the other way, we see that first the price must overcome the important resistance zone from $16.57 to $17.31, which would also result in an exit from the channel and after breaking the resistance at $18.26, a path towards $21.
Please look at the CHOP index, which indicates that we have more and more energy, on the RSI indicator we are moving around the middle of the range, but the STOCH indicator shows a clear recovery, which may result in a greater price drop.
