Chainlink retestLINK 2hr Nice copybook retest of the 11.8 resistance turn support after the breakout I really like the look of this chart With follow-through volume the push could start the path to 16 There have been no breaches of the ST since the 7.2 area prior to the last push and with other parameters looking for air we could see some signs of strength from here
LINKUSDT

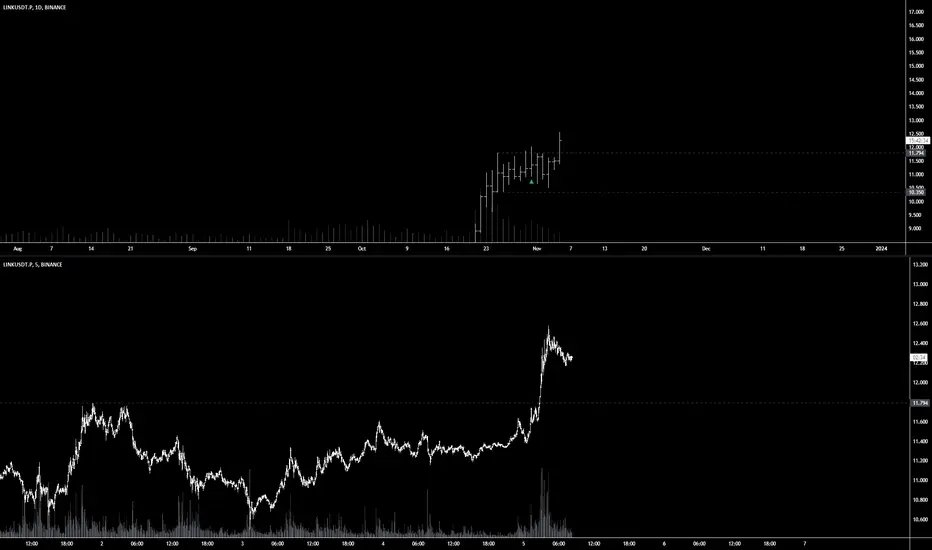
LINK │ LONG │ 05.11.2023BINANCE:LINKUSDT.P
Comment
I posted an idea for a level breakout on October 31, 2023, but that day, there was no actual breakout. Instead, a false breakout occurred, indicating a struggle around the level. Some are not willing for prices to go up, while others want it to.
Although I understood that the level would eventually be broken, I couldn't precisely predict when it would happen, as this knowledge is known to only a few who have spent half their lives in the market. However, by analyzing the chart now, I can identify two points when I would have entered a position:
November 2, 2023 - when the instrument initially moved down, but by the closing of the daily bar, it rose and closed almost at the highest level, near the level. This indicates strong buyers. Despite this, the breakout did not occur on that day, and prices fell again. But I wouldn't have lost anything since the instrument didn't reach my entry level. So, I would have canceled my order and waited for a new entry opportunity.
November 5, 2023 - the breakout occurred. Pay attention to the two days before the breakout. On November 3, 2023, the instrument confidently moved up during the day, and the next day, we see prices stabilizing at almost the same level. It was like the calm before the storm. As a result of this unusual calm, which we observed near the level only once during the entire accumulation period, we had a strong level breakout, where we could have made a move with a greater than 5-to-1 risk-reward ratio.
Conclusion: You need to be patient and wait for the instrument to be ready to break the level. Don't rush; sit quietly and wait, as if you are hunting a wild animal.
Signals for level breakout
the instrument gradually approaches the level;
accumulation of energy for level breakout;
consolidation near the level;
decrease in trading volumes before the level;
a clear zone beyond the level;
the instrument is not allowed to decrease in price;
there is a reserve of calculated ATR;
there is a reserve of technical ATR;
Disclaimer
Every trader should make their trading decisions based on their own analysis and circumstances. The signals in this channel should be considered as an additional tool for your own consideration.
Follow me and receive high-quality cryptocurrency market analysis!
I'm looking for these chart patterns...
This is the SOLUSDT chart overlayed onto the LINKUSDT chart.
I reckon we need to look out for these horizontal chart patterns for potential breakouts...

LINK is bullish now and many Traders don't see it 👀!!!LINKUSDT is in an ascending triangle which means the price is about to do a good bullish movement. The price can increase as much as the measured price movement ( AB=CD ) .The break out needed for increasing further has not happened but it should happen pretty soon.
I hope you make good money in these exceptionally good days🤌
_ _ _ _ _ _ _ _ _ _ _ _ _ _ _ _ _ _ _ _ _ _ _ _ _ _ _ _ _ _ _ _ _
✅Thank you, and for more ideas, hit ❤️Like❤️ and 🌟Follow🌟!

Possible LINK short??Clearly Link has tested that area of resistance, after failing to break it and stay above it multiple times. RSI is showing a possible reversal, and MACD has also started showing sell conditions. Possibly looking at a retracement to the 200 day SMA before retesting resistance?
Please give me feedback and tell me how I am wrong or if I'm missing something obvious. I'm no expert.

Link downThere is nothing new in my previous analysis and my point of view is from Dec 22, 2022 and the same negative view remains for me that this currency is heading to the shaded area below..
Please clarify that I am helping you with my point of view, which may be right or wrong, and see my previous analyzes of many currencies and forex in order to judge the owner of this analysis with a more accurate look
Good luck

SasanSeifi 💁♂Daily Price Analysis and Possible ScenariosHey there! In the daily time frame, as you can see, the price isn't showing any significant movement at the moment and is trading within the $11 price range, forming a range-bound pattern. The scenario we can consider in the daily time frame is as follows: after confirmation if the price falls into a range, it might experience a minor correction down to the $9.50 and $9 price range. Following a rebound from the liquidity zones, while keeping the support levels intact, we might witness renewed price growth. In case of a correction, for a better understanding of the continuation of the price trend, it's important to observe how the price reacts to the support levels.
Moreover, another scenario to consider is that if, after the consolidation, it manages to break above the $12 resistance range and consolidates, there might be potential for further growth towards the $14 price range.
🟢 Keep in mind that these are just scenarios, and it's important to conduct your own analysis and consider other factors before making any trading decisions 😊📈📉
❌ (DYOR)
⭕Of course, if you have any more inquiries or require further clarification, don't hesitate to reach out. I'm here to assist you!
🔹If you found this analysis helpful, please show your support by liking and commenting. Thank you! 🚀😊 🙌

🚨 Link/USDT: Brace for Impact 📉Hey traders, it's time to watch out for Link's next move. The lower support area is calling, and it seems like the buyers are losing their grip. After lingering around, my expectation is that Link's price may dip by at least 20-50% soon. Remember, this isn't financial advice, just an idea – make sure to do your own research! 💼📉

LINK- Inverse Head and ShouldersBackground:
Since May 2022, Link is in an accumulation range.
The range low is at 5.44. The range high is at 9.44.
I consider the deviation below the range low in July as a Wyckoff Spring event.
IMO, Link’s breakout is dependent on Bitcoin’s PA. Meaning, that If Bitcoin fails to break above 31.85K, Link will fail too.
Price Pattern:
It looks as if Link is about to complete an Inverse Head and Shoulders pattern. The neckline breakout point is at 8.48 USDT.
Be advised that the range high of 9.44 USDT is close to the breakout target, and it is likely to be a tough nut to crack.
Trade Idea:
My premise is that if Link does manage to break above the range high, it will likely take-off.
If you are considering taking this as leveraged trade, consider placing tour SL tighter.
• Entry: 8.5
• SL: 7.17
• Target: 12:06.
• R: R: 1:2.66
A breakout above the range high (if and when) is another trade opportunity.

Chainlink Bull Run May Lose Momentum
The current state of Chainlink's bull run seems to be showing signs of losing momentum. As an informed trader, it is essential to remain cautious and consider the potential risks associated with any investment decision.
Over the past few months, Chainlink has witnessed an incredible surge, capturing the attention of many traders and investors. The project's innovative approach and promising technology have undoubtedly contributed to its success. However, it is crucial to recognize that every bull run eventually encounters a point of exhaustion, and Chainlink may be nearing that stage.
Several indicators suggest that the momentum behind Chainlink's upward trajectory is beginning to wane. The recent price fluctuations, coupled with a lack of significant positive news, have raised concerns among market analysts. While no one can predict the future with certainty, it is prudent to approach Chainlink trading with caution at this juncture.
In light of these observations, I would like to encourage you to pause and reevaluate your trading strategy regarding Chainlink. Taking a step back to assess your positions and reassess the market sentiment can help ensure that you make informed decisions that align with your risk appetite.
Moreover, it is crucial to diversify your portfolio and not solely rely on a single asset, especially during times of uncertainty. Allocating your investments across different cryptocurrencies or asset classes can help mitigate potential risks and provide a more balanced approach to trading.
Remember, successful trading requires a comprehensive understanding of the market dynamics and a disciplined approach. While Chainlink's bull run has been impressive, it is essential to remain cautious and avoid being swayed solely by the excitement surrounding its recent performance.
As always, I encourage you to conduct thorough research, stay updated with the latest news and developments, and consult with trusted financial advisors before making any investment decisions.
Should you have any questions or require further insights, please do not hesitate to comment below. I am here to assist you in navigating the ever-evolving cryptocurrency market.

about 15% short position Hello everybody
Considering TP/SL you take short position according to the chart.

Chainlink Pushes Towards $12 with Positive EMA and MACD IndicatoWith the EMA period and MACD indicators both staying positive, Chainlink is making significant strides towards the $12 mark. It's time to seize this opportunity and consider a long position on Chainlink!
The current market conditions have provided us with a strong bullish trend for Chainlink, and the EMA period and MACD indicators are reinforcing this positive sentiment. As the EMA continues to climb steadily, it reflects the sustained upward momentum of Chainlink's price. Additionally, the MACD staying positive indicates that the buying pressure is outweighing the selling pressure, further supporting the bullish outlook.
Now, you might be wondering, what does this mean for you as a trader? Well, it's an exciting chance to capitalize on Chainlink's upward trajectory! By taking a long position on Chainlink, you have the potential to ride the wave of its growth and potentially reap substantial profits. The positive EMA period and MACD indicators serve as strong signals that the upward momentum is likely to continue, making it an opportune time to consider entering a long position.
So, what's the next step? Don't miss out on this fantastic opportunity! I encourage you to carefully analyze the market conditions, conduct thorough research, and consider taking a long position on Chainlink. As always, it's essential to have a solid risk management strategy in place and stay updated on the latest market developments.
Remember, trading is all about seizing opportunities, and Chainlink's current positive trend is one you definitely don't want to overlook. Stay positive, keep your spirits high, and let's make the most of this exciting market movement together!
If you have any questions or need further assistance, feel free to comment below. I'm here to support you on your trading journey.

Nice breakout in Link, where we can enter?Hello Crypto Enthusiast,
LINK - CHAINLINK , a master in Oracle.
Facilitates secure communications between Ethereum projects and various off-chain data.
Holds 61% market share.
Technically, after a long term accumulation, it just broke out.
with that said, where we can buy again? I feel price will do a pullback to 8.5 to 9.5 zone before next rally or buy above the recent high at 11$
I would enter this in zone with a stoploss below the swing low around $7. Risk is 25% and target is 500%. Trade will run for a year or so to reach $50 , $100
Please DYOR before investing.

Chainlink: The Unstoppable Force Dominating the Crypto Market! Chainlink has been on an unstoppable rampage in the crypto market, boasting an astonishing 59% return over the past three months! 📈🔥
Yes, you read that right! Chainlink has been flexing its muscles and leaving other cryptocurrencies in the dust. It's been a wild ride, and if you haven't jumped on the Chainlink train yet, now is the perfect time to hop aboard and experience the exhilarating gains for yourself!
Why Chainlink, you ask? Well, let me tell you. Chainlink has been revolutionizing the blockchain industry with its cutting-edge technology and real-world applications. Its decentralized oracle network has garnered immense attention from major players in the market, propelling it to new heights.
But enough about the past, let's focus on the future. Chainlink's potential is still untapped, and as traders, we have the opportunity to ride this wave of success to even greater heights. So, here's my call-to-action for you: it's time to long Chainlink and seize the moment!
Don't let this opportunity slip through your fingers. Join the ranks of savvy traders who have already recognized Chainlink's potential and are reaping the rewards. With its strong fundamentals and a dedicated community backing it, Chainlink is poised to make even more waves in the coming months.
So, grab your trading gear, fuel your excitement, and let's embark on this thrilling journey together! Long Chainlink and be a part of the unstoppable force that's dominating the crypto market.

Chainlink LINK long medium-term trade #19And we continue our series of potential medium-term trades.
For the past year and a half, the LINKUSDT price has been trading in a wide range of $5-9. During this time, buyers have made 6 attempts to break through and gain a foothold above $9 , but all in vain. Perhaps they will succeed the 7th time?)
Given the fact that in the previous few weeks, LINK buyers have been showing considerable strength and pushing the price up, we are ready to buy LINKUSDT long on the following conditions:
Entry: in the range of $6.60-6.90 (an average price of $6.75 is desirable)
Stop: $6.049 (-10.4%)
Take profit: $11.84 (+75.4%)
P/L ratio: 7.26
We allocate $10,000 for LINKUSDT trade, in the event of a mistake, we will lose $1040. If the trade will be a success, we will receive a profit of $7540

LINKUSDT.1DBased on the given market data, the current price of LINK is 10.819 USDT. The Relative Strength Index (RSI) for 4 hours, 1 day, and 7 days are 61.23, 83.32, and 74.02, respectively. Typically, an RSI above 70 indicates an overbought condition, suggesting that a price drop may be imminent. Thus, the 1-day and 7-day RSI levels indicate that LINK could be overbought.
The Moving Average Convergence Divergence (MACD) for 4 hours, 1 day, and 7 days are 0.378, 0.939, and 0.505, respectively. This indicates a bullish trend in the short, medium and long term.
The Bollinger Bands (Bb) for 4 hours, 1 day, and 7 days are 11.788, 11.446, and 11.560, respectively. The current price is slightly below the middle band, suggesting a neutral trend.
The support levels for 4 hours, 1 day, and 7 days are 10.056, 8.359, and 7.086, respectively. The resistance levels for the same periods are 11.932, 14.321, and 11.828, respectively. This indicates that the price has a potential to go up or down but given the RSI, a downward movement could be anticipated.
In conclusion, while the MACD indicates a bullish trend, the overbought RSI levels suggest there may be a pullback in the short term. However, the market is unpredictable and it's essential to consider other market factors and conduct a comprehensive analysis before making investment decisions. Always ensure to invest wisely.


LINK bottom 51h / 1D time frame
-
On the left chart, LINK get rejection from the resistance zone(10.7~12.3), and I think there is a possibility to create a Head and Shoulders structure.
On the right chart, top 9.45 and bottom 5.45 are a box range. LINK has already broke above the top resistance at 9.45 and start consolidating. This is might be a liquidation hunting, once LINK go below 9.45 again, a fake breakout will be confirmed.
TP: 5.5
SL: 11.9

A gift is under $6.5Chart 4H TF
After soared, LINK is pulling back to 6.7 - 6.5 - 6.2
I expect LINK will bounce back around 6.5 if it's declined this level
So wait and see

LINK could be preparing for a huge moveLink has been trading in a big range just above an HTF order block. It could grab liquidity from below this range and then start a huge move upwards.

LINK/USDT 1DAY UPDATE BY CRYPTOSANDERS !!Hello friends, welcome to this LINK update from Crypto Sanders.
Chart Analysis:- Chainlink (LINK) was a notable gainer on Wednesday, as the token rose by as much as 9% in today’s session.
Following a low of 9.84 on Tuesday, LINK/USD rallied to an intraday peak at 11.55 earlier in the day. the cryptocurrency climbed to its strongest point since last year when its price peaked at over 12.00.
the latest surge in price has kept the relative strength index (RSI) above the 80.00 level.
the index is tracking at 81.87, which is its highest point since August 2020, which is deep in overbought territory.
LINK is trading at 11.11,
I have tried to bring the best possible results in this chart.
If you like it, hit the like button and share your charts in the comments section.
Thank you.

LINKUSDT - Breakout after an extended Period of Consolidation!!LINKUSDT (1D Chart) Technical analysis
LINKUSDT (1D Chart) Currently trading at $8.2
Buy level: Above $8.1
Stop loss: Below $7
TP1: $9.5
TP2: $12
TP3: $14
TP4: $18
Max Leverage 3x
Always keep Stop loss
Follow Our Tradingview Account for More Technical Analysis Updates, | Like, Share and Comment Your thoughts

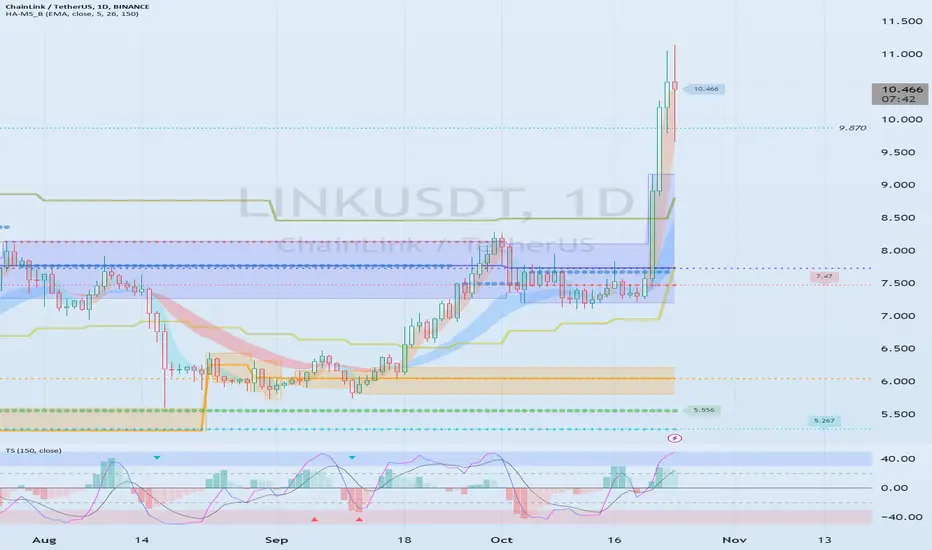
The key is whether the price can be maintained above 9.870Hello?
Hello traders!
If you "Follow" us, you can always get new information quickly.
Please also click “Boost”.
Have a good day.
-------------------------------------
(LINKUSDT chart)
(1M charts)
The key is whether it can rise above 15.13.
To do this, it is important to receive support around 11.236.
(1W chart)
The key is whether it can receive support in the 10.852-12.754 range and rise above 15.0.
If possible, I would like to see a movement that causes the HA-High indicator to fall and be created by shaking it up and down.
(1D chart)
The key is whether the price can be maintained above 9.870 and rise above 13.660-20.410.
--------------------------------------------------
- The big picture
The full-fledged upward trend is expected to begin when the price rises above 29K.
This is the section expected to be touched in the next bull market, 81K-95K.
-------------------------------------------------- -------------------------------------------
** All explanations are for reference only and do not guarantee profit or loss in investment.
** Trading volume is displayed as a candle body based on 10EMA.
How to display (in order from darkest to darkest)
More than 3 times the trading volume of 10EMA > 2.5 times > 2.0 times > 1.25 times > Trading volume below 10EMA
** Even if you know other people’s know-how, it takes a considerable amount of time to make it your own.
** This chart was created using my know-how.
---------------------------------