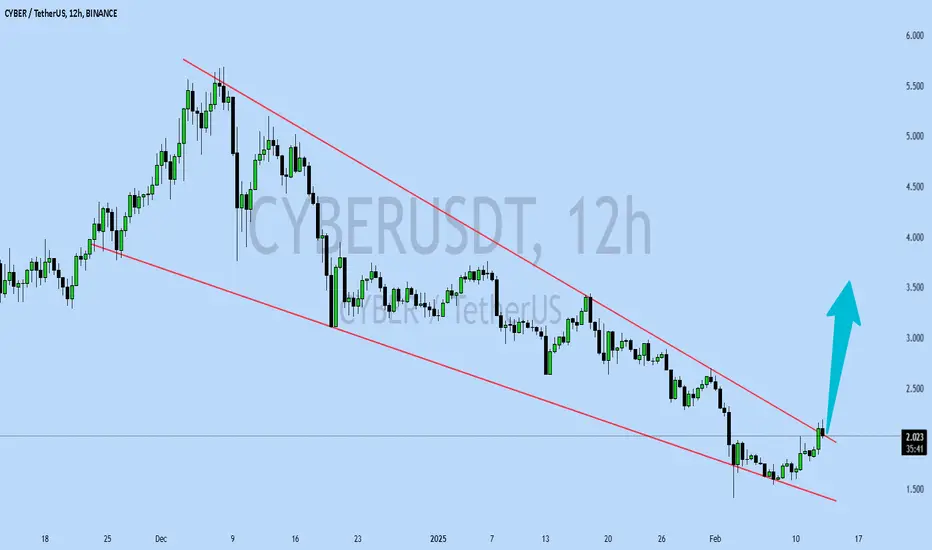
CYBERUSDT UPDATECYBERUSDT is a cryptocurrency trading at $2.026. Its target price is $3.500, indicating a potential 70%+ gain. The pattern is a Bullish Falling Wedge, a reversal pattern signaling a trend change. This pattern suggests the downward trend may be ending. A breakout from the wedge could lead to a strong upward move. The Bullish Falling Wedge is a positive signal, indicating a potential price surge. Investors are optimistic about CYBERUSDT's future performance. The current price may be a buying opportunity. Reaching the target price would result in significant returns. CYBERUSDT is poised for a potential breakout and substantial gains.
LINKUSDT
LINKUSDT BULISHo start, I want to mention that if the targets in this analysis are achieved in a short time, it could indicate that the entire altcoin market will turn bullish very soon.
Please pay close attention to the danger zone and stop loss levels. If the closing candle breaks below the stop loss, this analysis will be invalidated.
Note: My ideas are not intended for any type of scalping or scalpers!
You can find the full list of my ideas here: www.tradingview.com
Here are some of my ideas:

IDEXUSDT UPDATEIDEXUSDT is a cryptocurrency trading at $0.04942. Its target price is $0.08000, indicating a potential 60%+ gain. The pattern is a Bullish Falling Wedge, a reversal pattern signaling a trend change. This pattern suggests the downward trend may be ending. A breakout from the wedge could lead to a strong upward move. The Bullish Falling Wedge is a positive signal, indicating a potential price surge. Investors are optimistic about IDEXUSDT's future performance. The current price may be a buying opportunity. Reaching the target price would result in significant returns. IDEXUSDT is poised for a potential breakout and substantial gains.

CAKEUSDT UPDATECAKEUSDT is a cryptocurrency trading at $21.85. Its target price is $3.500 is likely incorrect, as it would be a significant price drop. However, assuming the target price is actually higher, a more plausible target would be around $39.41, indicating a potential 80%+ gain. The pattern is a Bullish Falling Wedge, a reversal pattern signaling a trend change. This pattern suggests the downward trend may be ending. A breakout from the wedge could lead to a strong upward move. The Bullish Falling Wedge is a positive signal, indicating a potential price surge. Investors are optimistic about CAKEUSDT's future performance. The current price may be a buying opportunity. Reaching the target price would result in significant returns.

LINK: Potential 10x Play?LINK has spent years forming a massive symmetrical triangle.
It has already broken out and is currently in its second retest of the upper boundary.
Using a conservative measurement from the triangle pattern, the maximum estimated upside is around $190-$200—a potential 10x move from here.
📌 Entry & Stop-Loss Strategy
If entering now, a reasonable stop-loss could be set at the Feb 3rd wick low, which also aligns with a key support/resistance flip (light blue line).
If the light blue line fails, there’s a high chance of breaking back into the triangle.
But even if that happens, LINK could still see a strong recovery after some consolidation.
🔥 Why is BINANCE:LINKUSDT worth watching?
It’s included in Coinbase 50 Index, Grayscale Trust, and World Liberty Financial (a decentralized project supported by Trump & his family).
It’s also a “Made in USA” project—an attractive narrative for traders.
With so many hype factors, once the bull market kicks in, CRYPTOCAP:LINK could get heavily pumped by news catalysts.
At that point, who knows—10x might be just the beginning. 🚀
🔴 for more future script “guesses” like this! 😃
🔥 I've dropped another 2 analyses for the 2025 altseason on the right hand side if you're using computer, and scroll down a bit to see the link if you're using mobile.

Trading opportunity for LINKUSDTBased on technical factors there is a Buy position in :
📊 LINKUSDT
🔵 Buy Now
🪫Stop loss 17.30
🔋Target 22.22
📏 R/R 2
💸RISK : 1%
We hope it is profitable for you ❤️
Please support our activity with your likes👍 and comments📝

Can LINK Reclaim $20?The expected bearish correction has played out, with LINK forming a potential bottom in the highlighted support zone ($17.20 - $17.80). Bulls are expected to step in within this range to defend support and attempt a recovery.
A breakout above the $20 resistance level would be an early sign of bullish momentum and potential bottom formation.

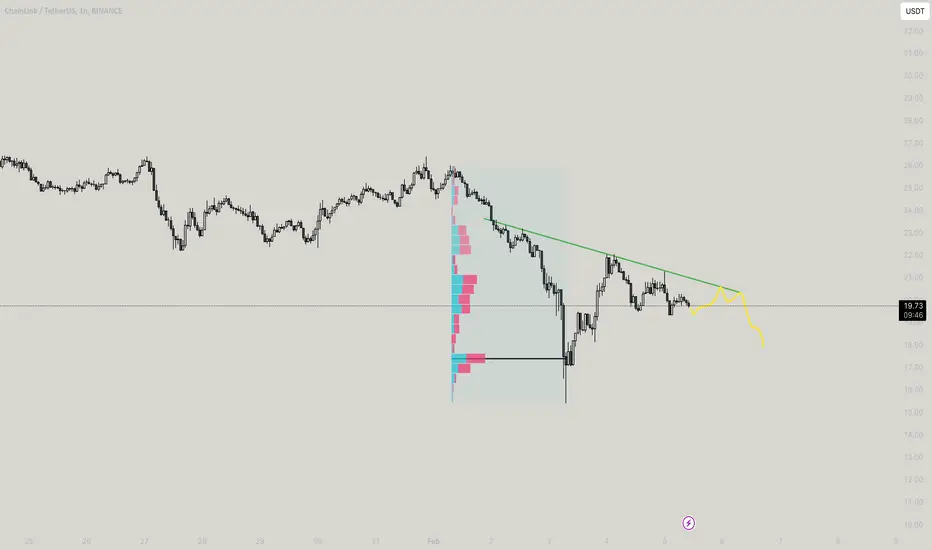
We need confirmation!This is my idea on BINANCE:LINKUSDT and what to expect in next few weeks. There are few alt-coins made higher high and proved it potential, of course one of them is BINANCE:LINKUSDT . As you can see there are 2 zones I consider very crucial (marked as YELLOW). Which means people bought, or entered Futures-Long position when BINANCE:LINKUSDT reached those points and we all know that Link made Higher-High after that that's why I think those areas are very crucial.
1. Unless BINANCE:BTCUSDT suddenly go up and reach 105k-110k area or CRYPTOCAP:BTC.D go down, we are not likely to see first scenario would happen.
2. About a week ago whole crypto made huge squeeze, that squeeze tells me third wave of Elliot wave theory about to begin in 1D timeframe. The moment we close that squeeze I will consider Long position. In this scenario there there is a old Resistance point end of the squeeze, that would be very comfortable place to enter Long position. Which is at 15.
3. There is a minor support zone in 1W timeframe, which I marked it as red block. Also entering in Long position from that area will be very comfortable or we might see squeeze to 13-14 area and close a candle above 15 area which would great opportunity to enter Long position too. If we ever go lower than this point wait and observe will be perfect choice.
In the end BINANCE:LINKUSDT still Bullish in 1W timeframe and I will be taking profits at 38 and 55 (ATH).

LINKUSDT 1WLINK ~ 1W Analysis
#LINK If you still have a Conviction on this Coin, Maybe this support you can consider to start buying again, a minimum target of 20%+.

Public trade #23 - #LINK price analysis ( Chainlink )On the previous march, the price of CRYPTOCAP:LINK , although it made 200%+, did not reach our goal(
Let's try again:
1️⃣ Desired purchase zone OKX:LINKUSDT $16.66-17.66
2️⃣ Well, we would like to sell the #Chainlink token at least for $40, although $52 will also be fine)
_____________________
Did you like our analysis? Leave a comment, like, and follow to get more

LINK/USDTOn the weekly time frame, we got a correction into the discount zone. From the highlighted zone, one can consider buying the coin if it hasn't been done yet.
Growth targets:
Target 1 = 22
Target 2 = 26

LINK Long Spot OpportunityMarket Context:
LINK has retraced into a major support zone, setting up a potential retest and bounce. Given its historical price behavior at these levels, this provides a strong risk-to-reward opportunity for a long spot position.
Trade Details:
Entry Zone: $14.50 - $16.50
Take Profit Targets:
$19.40 - $21.50
$27.00 - $30.00
Stop Loss: Just below $12.00
This setup aligns with historical support zones and potential continuation of the uptrend. Manage risk accordingly and stick to the plan! 📈🔥

is LTC feeling cornered?AHAHA, when you go sticking through the walls on a dark day, the same with it, plan for shorts on the black line!
LINKUSDT: Bullish Setup or Breakdown Ahead?Yello, Paradisers! Could this head & shoulders structure spell trouble for LINKUSDT? Or is the market setting up for a bullish reversal?
💎LINKUSDT appears to be showing signs of a retracement due to its head and shoulders pattern. If the price retraces to the identified support zone and presents a bullish I-CHoCH, W-pattern, or inverse head and shoulders on lower timeframes, the probability of a significant bullish move increases.
💎However, if the price drops further to sweep below the current zone (inducement), it’s prudent to wait for confirmation at the strong support zone. Although reaching this level might seem unlikely, if the price does drop, it would strengthen the likelihood of a bullish rebound. In this case, watch for bullish patterns such as I-CHoCH, W-patterns, or inverse head and shoulders to form before taking any action.
💎On the flip side, if a breakdown occurs and the candle closes below the strong support zone, this would invalidate our bullish outlook. In such a scenario, patience will be key—waiting for better price action and clearer market structure before considering the next move.
🎖 As always, the disciplined and patient approach wins in this market. Stick to the plan, follow the confirmations, and trade smart, Paradisers!
MyCryptoParadise
iFeel the success🌴

#LINK/USDT#LINK
The price is moving in a descending channel on the 1-hour frame and is expected to continue upwards
We have a trend to stabilize above the moving average 100 again
We have a descending trend on the RSI indicator that supports the rise by breaking it upwards
We have a support area at the lower limit of the channel at a price of 20.00
Entry price 20.64
First target 21.70
Second target 23.46
Third target 25.20


CREAMUSDT UPDATECREAMUSDT is a cryptocurrency trading at $10.90. Its target price is $22.00, indicating a potential 100%+ gain. The pattern is a Bullish Falling Wedge, a reversal pattern signaling a trend change. This pattern suggests the downward trend may be ending. A breakout from the wedge could lead to a strong upward move. The Bullish Falling Wedge is a positive signal, indicating a potential price surge. Investors are optimistic about CREAMUSDT's future performance. The current price may be a buying opportunity. Reaching the target price would result in significant returns. CREAMUSDT is poised for a potential breakout and substantial gains.

LINK your mind again!!Know how I work? Just follow my old charts and get a stances of how this works!!

Chainlink BullRipple stablecoin $RLUSD has adopted the Chainlink standard for verifiable data to fuel DeFi adoption with real-time, secure pricing data
The launch of the Chainlink Cross-Chain Interoperability Protocol (CCIP) has been pivotal, enabling seamless cross-chain token transfers and enhancing smart contract capabilities.
Plus the chart looks very bullish.

Chainlink Could Target $30 Once It Breaks Descending Triangle
Chainlink (LINK), the leading decentralized oracle network, has been consolidating within a descending triangle pattern on its price chart. This technical formation often signals a period of indecision among market participants, but it also carries the potential for a significant breakout. If LINK successfully breaks above the descending trendline, it could ignite a powerful rally, potentially propelling the price towards the $30 mark.
Understanding the Descending Triangle
A descending triangle is a bearish chart pattern characterized by a series of lower highs and relatively flat lows. It suggests that selling pressure is gradually increasing, while buying pressure remains relatively weak. However, the flat lows indicate that there is still significant support for the asset.
In the case of Chainlink, the price has been consolidating within this descending triangle for several weeks. This period of consolidation allows market participants to accumulate positions and prepare for a potential breakout.
Factors Fueling a Potential Rally
Several factors could contribute to a bullish breakout and propel Chainlink's price towards $30:
• Growing Adoption: Chainlink's technology continues to gain traction across various sectors, including DeFi, gaming, and enterprise applications. As more projects integrate Chainlink's oracles, the demand for LINK tokens is likely to increase.
• Technological Advancements: Chainlink is constantly evolving and improving its technology, enhancing its security, scalability, and interoperability. These advancements can attract new users and drive further adoption.
• Favorable Market Conditions: A broader bullish trend in the cryptocurrency market could provide a significant tailwind for Chainlink. If Bitcoin and other major cryptocurrencies experience a sustained rally, Chainlink could benefit from increased investor interest and capital inflows.
• Technical Breakout: A successful breakout above the descending trendline would be a strong technical signal, confirming the bullish sentiment and attracting more buyers to the market.
Technical Analysis
Technical analysis provides several clues about the potential for a bullish breakout.
• Volume: A surge in trading volume accompanying a breakout would significantly increase the likelihood of a sustained rally.
• Moving Averages: A move above key moving averages, such as the 50-day and 200-day moving averages, would further strengthen the bullish case.
• Relative Strength Index (RSI): The RSI is a momentum indicator that can help identify overbought or oversold conditions. A breakout accompanied by a rising RSI would suggest strong bullish momentum.
Potential Challenges and Risks
While the outlook for Chainlink appears promising, it is crucial to acknowledge potential challenges and risks:
• Competition: Chainlink faces competition from other decentralized oracle networks and emerging technologies.
• Regulatory Uncertainty: The regulatory landscape for cryptocurrencies remains uncertain, and any negative regulatory developments could impact Chainlink's price.
• Market Volatility: The cryptocurrency market is highly volatile, and sudden price swings can significantly impact Chainlink's price.
Investment Considerations
Investing in cryptocurrencies carries significant risks, including the risk of losing all or part of your investment.
• Conduct thorough research: Understand the technology behind Chainlink, its potential use cases, and the risks involved.
• Diversify your portfolio: Don't invest all your funds in a single cryptocurrency.
• Invest only what you can afford to lose: Avoid investing more than you can afford to lose financially.
• Stay informed: Keep abreast of the latest developments in the Chainlink ecosystem and the cryptocurrency market as a whole.
Conclusion
Chainlink has the potential to play a crucial role in the future of decentralized finance and blockchain technology.
• If it successfully breaks out of the descending triangle pattern and gains traction in the broader market, it could experience significant price appreciation.
• However, investors should carefully consider the risks involved and conduct thorough research before making any investment decisions.
Disclaimer: This article is for informational purposes only and does not1 constitute financial advice.
• Investing in cryptocurrencies2 involves significant risks, and you should carefully consider your investment objectives, financial situation, and risk tolerance before making any investment decisions.
Note: This article provides a general overview of Chainlink and its potential.
• The cryptocurrency market is dynamic and subject to rapid change.
• It is essential to conduct independent research and consult with a qualified financial advisor before making any investment decisions.
Disclaimer: This article is for informational purposes4 only and does not constitute financial advice.
• Investing in cryptocurrencies5 involves significant risks, and you should carefully consider your investment objectives, financial situation, and risk tolerance before making any investment decisions.6

LINK/USDT Analysis – Breakout or Rejection?CRYPTOCAP:LINK is approaching a key descending resistance zone, while the rising trendline continues to provide strong dynamic support (marked with golden boxes).
The price is currently at a decision point—either a breakout or a rejection from resistance.
Please tap the like button to show your support.
Thank you!

LongI usually trade with two time frames. I tend to avoid to buy the dip. I rather buy the strength using momentum indicators:
I just opened a long position using three time frames based on the reasons below:
Weekly:
The stochastic reset at 50 level and is moving to the upside - Bullish momentum building up.
Daily:
Both MACD and RSI lines are about to cross and move to the upside in the bull zone. Stochastic lines have already crossed and are moving to the upside. In terms of price action, it dropped to the previous month low, bounced up and now moving above the previous month mid level.
4H:
The price is currently sitting just below the sell block and below the previous week mid level. I will open a long position if the current 4H candle closes above the previous month's mid level and MACD lines enter the bull zone with green histogram. Having said that, It might be safer to wait for a candle to close above $26 and stochastic lines will enter 50 level.
I don't trade with leverage. I usually close the position when momentum indicators present a clear negative divergence in 4H or daily chart.

TradeCityPro | LINKUSDT The Time to Buy Has Arrived👋 Welcome to TradeCityPro Channel!
Let’s analyze another cryptocurrency from the market, which is also one of my favorites due to its infrastructure role and its ability to simplify crypto. It seems that a buying opportunity has arrived.
🌐 Overview Bitcoin
Before starting the analysis, as always, let’s take a look at Bitcoin on the 1-hour timeframe, where the futures entry trigger at 104,227 was activated. Currently, it is below the important resistance level of 105,939, which will be the last trigger I provide for futures entry.
If this resistance at 105,939 is broken and Bitcoin dominance is declining at the time of the breakout, switch to altcoins and look for long positions on those that have already made a bullish leg and are trading at relatively higher levels. As long as we are above 104,227, I will continue looking for long triggers.
📊 Weekly Timeframe
On the weekly timeframe, LINK has been one of the cryptocurrencies that remained in a range for 500 days. After breaking out, we have seen the beginning of an uptrend.
This is exactly what I mean by avoiding capital lock-up. We waited weeks for the 8.06 trigger to break, allowing us to buy with momentum confirmation rather than buying inside the range and waiting in a high-risk market.
You might say, "Why not buy inside the range to avoid missing the 8.06 breakout?" My answer is that hundreds of coins are still stuck in similar ranges without showing any bullish moves, and even now, they could trap your capital for a long time, causing frustration!
If you entered at 8.06, continue holding. If you are looking for a re-entry, you can buy after the 29.02 breakout. As for selling, I am not selling yet and will actually try to accumulate more!
📈 Daily Timeframe
On the daily timeframe, LINK is one of the few cryptocurrencies that, after recent corrections, did not return to lower levels. Instead, it bounced off the 0.382 Fibonacci level, increasing the bullish bias.
After breaking 12.96, LINK had a strong rally up to 29.07, where resistance was observed.
Instead of considering 29.07 as resistance, I prefer to buy after a breakout of 26, as this level was previously a pullback zone and had multiple rejections.
Since we have bounced off the 0.382 Fibonacci level, a breakout of the recent high could trigger a new upward move towards the Fibonacci extension targets, which are : 31.24 – 35.10 – 41.44 – 51.19
For buying, I plan to enter a spot position after a 26 breakout with a stop-loss at 15.22, and I will continue holding. I will also look for a futures long position before 26, but for that, I will need momentum confirmation and volume increase!
⏱ 4-Hour Timeframe
On the 4-hour timeframe, a risky long trigger at 24.34 was activated, but there hasn't been much movement yet. A pullback to 24.34 is possible.
📈 Long Position Trigger
the 26.30 trigger is excellent, and I will try to find lower timeframe entries before that. As long as we are above 22.37, my bullish strategy remains intact.
📉 Short Position Trigger
I am not considering any setups unless a clear structure forms. If we see a sharp drop to 22.37 and then break below it, I might consider shorting, but I prefer to focus on more bearish coins instead of LINK.
📝 Final Thoughts
Stay calm, trade wisely, and let's capture the market's best opportunities!
This analysis reflects our opinions and is not financial advice.
Share your thoughts in the comments, and don’t forget to share this analysis with your friends! ❤️
