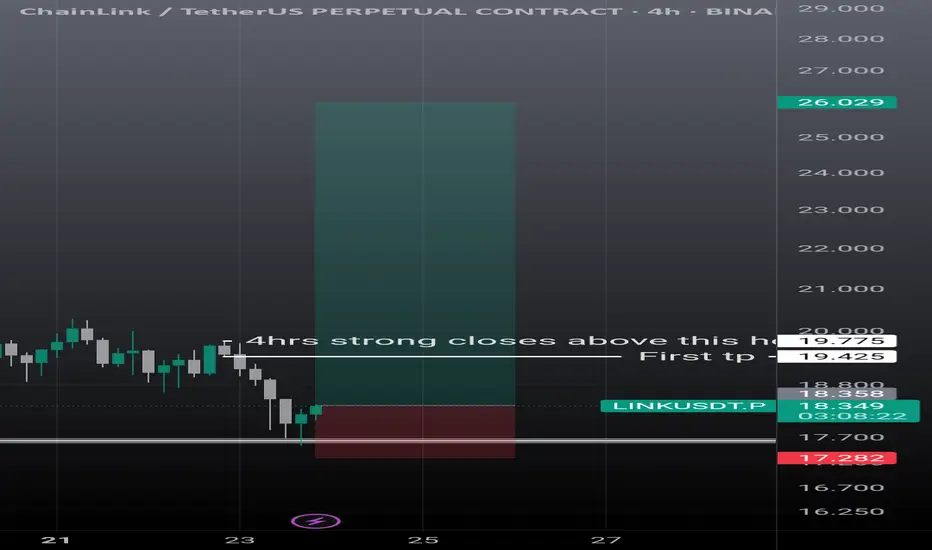
Linkusdt scalp n swing setupLink showing some strong momentum. On 4hrs it can go easily 19.30, then if it breaks strong and closes above the mentioned candle it's next stop is 26$. Must use sl as it can take further correction is it failed to break the mentioned level.
LINKUSDTPERP
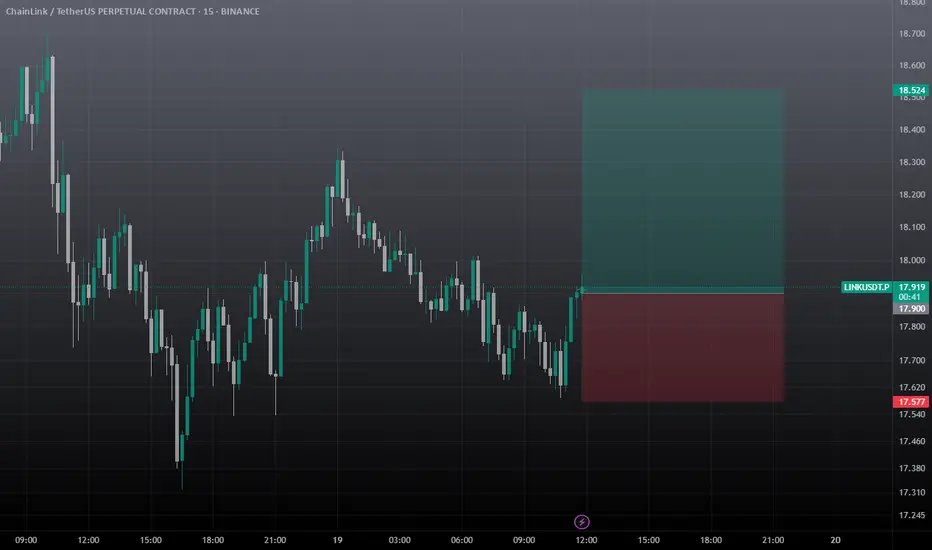
Link Scalp Trade IDEA / Long Scalp Setuplink looking to take out 18.5 area. can take at cmp 17.91, must use sl, it's a scalp trade so don't hold it for long time.
LINKUSDT Forming Falling Wedge LINKUSDT is currently forming a classic falling wedge pattern, a bullish reversal setup that often signals the end of a downtrend and the beginning of a strong upward move. The recent price action within the wedge shows decreasing volatility and tightening price levels, suggesting accumulation is underway. This setup, combined with increasing volume, indicates that a breakout to the upside could be imminent.
Chainlink (LINK) continues to draw investor interest due to its critical role in the decentralized oracle network ecosystem, which bridges blockchain smart contracts with real-world data. The project has maintained relevance in both DeFi and traditional enterprise solutions, and its consistent development activity keeps it on the radar of long-term crypto investors and short-term traders alike. With current market sentiment shifting more favorably toward altcoins, LINK’s technical and fundamental setup makes it a top watch.
The expectation for a 60% to 70% gain is well-supported by previous price performance following similar wedge breakouts. Traders are advised to monitor for a strong volume breakout above resistance lines, as this would confirm the move and likely initiate a new upward trend. If broader market conditions remain positive, LINKUSDT could move swiftly toward higher levels, fueled by both technical momentum and renewed investor confidence.
✅ Show your support by hitting the like button and
✅ Leaving a comment below! (What is You opinion about this Coin)
Your feedback and engagement keep me inspired to share more insightful market analysis with you!

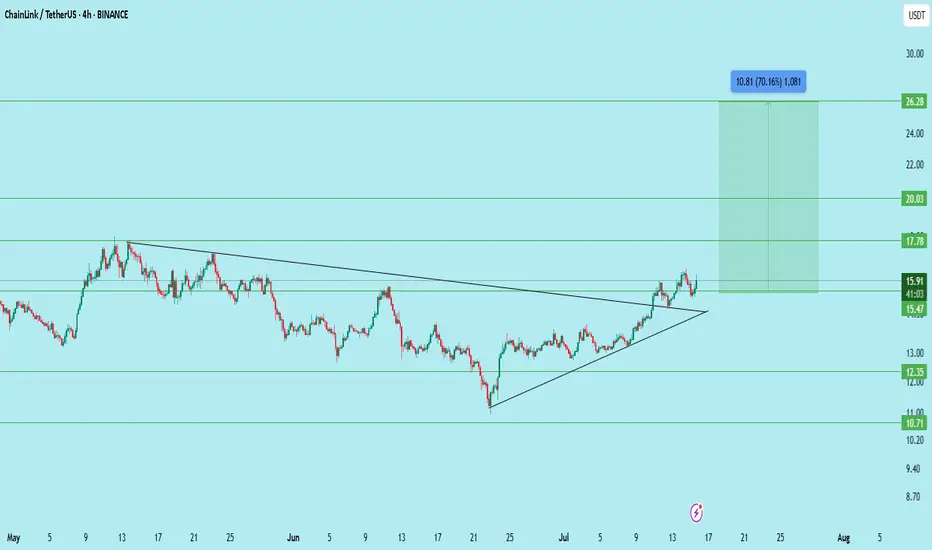
LINKUSDT – Breakout Retest | Ready for 70% Move?LINK has broken out of a long-term descending trendline on the 4H timeframe and retested the breakout zone. Price is holding well above the trendline and support levels, indicating strong momentum and a bullish structure.
Entry: 15.4–15.6
Support: 15.47
Resistance: 17.78
Targets: 17.78 / 20.03 / 26.28
Stoploss: Below 15.00
Structure: Triangle breakout
Potential: +70% upside if all targets are achieved
LINK is looking primed for a strong breakout continuation. Keep it on your radar.
DYOR | Not financial advice
LINK/USDT Chainlink Gearing Up for a Major Breakout?
🧠 Overview:
The LINK/USDT chart is showcasing a high-conviction technical setup — a well-defined Descending Triangle that has been forming for over 6 months. This pattern often acts as a pressure-cooker scenario, building up momentum before a major breakout.
The triangle is composed of consistent lower highs pressing against a strong horizontal support zone at $12.5 – $13.2, which has been tested and held multiple times since February 2025.
Currently, the price is approaching the apex of the triangle, signaling that a breakout is likely imminent.
📐 Pattern Details – Descending Triangle:
🔻 Descending Resistance Line: Connecting lower highs since the January 2025 peak.
🟨 Flat Support Zone: The $12.5 – $13.2 level has served as a strong demand zone.
⏳ Apex Nearing: Price action is compressing, and breakout pressure is building.
📉 Decreasing Volume: Volume is drying up — a classic precursor to a breakout move.
✅ Bullish Scenario (Breakout):
If LINK breaks above the descending trendline and reclaims resistance around $14.00 – $15.44, the chart could ignite a strong upside move.
🚀 Bullish Targets:
1. $15.44 (first key resistance & breakout validation)
2. $17.44 (prior structure resistance)
3. $19.38 (swing high from Q1)
4. $26.58 (major resistance zone)
5. $28.00 – $29.35 (long-term upside target)
📌 Breakout Confirmation: Look for high volume and a successful retest of the breakout level to confirm bullish momentum.
❌ Bearish Scenario (Breakdown):
If LINK fails to hold the $12.5 – $13.2 support zone and breaks below it with strong volume, downside risks increase significantly.
⚠️ Bearish Targets:
$11.00 (minor support)
$9.50 (next demand zone)
$8.00 (macro support from 2023)
A breakdown from this triangle would invalidate the bullish setup and could trigger a broader bearish continuation.
🧩 Conclusion & Strategy:
📊 Pattern: Descending Triangle
🕰️ Formation Duration: 6+ months (strong reliability)
🟨 Critical Zone: $12.5 – $13.2 = Key Support
📍 Breakout Trigger: Above $15.4
🔍 Breakdown Trigger: Below $12.5
📌 Trading Ideas:
🔼 Long Position: Upon breakout above $15.4 with confirmation
🔽 Short Position: Upon breakdown below $12.5 with increased volume
📚 Bonus Insight:
Chainlink remains one of the most widely adopted oracle solutions in DeFi and enterprise blockchain. A technical breakout from a long-term consolidation like this could attract both retail and institutional capital.
#LINKUSDT #Chainlink #CryptoBreakout #DescendingTriangle #Altseason #TechnicalAnalysis #BullishSetup #CryptoSignals #TradingView #AltcoinSetups

LinkEntry price yellow line
Stop loss update from red line to yellow line
We hit first Take profit
I Close full now


LINKUSDT: Inverse Head & Shoulders Breakout! The Reversal BeginsBINANCE:LINKUSDT has broken out of a classic inverse head and shoulders pattern — a well-known bullish reversal formation. After the breakout, price action showed strength by coming back to retest the neckline support and holding it successfully. This confirms the pattern and signals a potential shift in trend.
From a technical perspective, this setup is highly promising. The market structure indicates a likely reversal after an extended downtrend, and the breakout could be the start of a strong bullish phase. With solid fundamentals backing BIST:LINK , the rally could gain serious momentum once it gets going.
This pattern isn’t just any breakout — it’s a reversal of the reversal, a major turning point in trend. If bulls take control, this move has the potential to accelerate rapidly. However, it’s crucial to always manage risk, use a well-placed stop-loss, and avoid overexposure.
Get ready — once the rally starts, it might be unstoppable!
BINANCE:LINKUSDT Currently trading at $15.5
Buy level : Above $15
Stop loss : Below $13
Target 1: $17
Target 2: $1.4
Target 3: $2.1
Max leverage 3x
Always keep stop loss
Follow Our Tradingview Account for More Technical Analysis Updates, | Like, Share and Comment Your thoughts

LINKUSDT 1D AnalysisLINK ~ 1D Analysis
#LINK Buy after successfully breaking through this resistance line with a short-term target of at least 10%++

#LINK/USDT#LINK
The price is moving within a descending channel on the 1-hour frame, adhering well to it, and is heading for a strong breakout and retest.
We are experiencing a rebound from the lower boundary of the descending channel, which is support at 14.50.
We are experiencing a downtrend on the RSI indicator that is about to be broken and retested, supporting the upward trend.
We are looking for stability above the 100 Moving Average.
Entry price: 15.80
First target: 16.45
Second target: 16.90
Third target: 17.56

LINKUSDT 1D Analysis LINK ~ 1D Analysis
#LINK Successfully retested this support block. This would be a very good buy for now, with a short term target of at least 10%+.

Link Long PositionAdded to leveraed longs under 15.050.
Invaladation 14.850
If holds here we can see a push towards 16 and 17.
targeting 16 and 17.
Note: Not a Financial Advice.

#LINK/USDT#LINK
The price is moving within a descending channel on the 1-hour frame, adhering well to it, and is heading towards a strong breakout and retest.
We are seeing a bounce from the lower boundary of the descending channel, which is support at 14.30.
We have a downtrend on the RSI indicator that is about to be broken and retested, supporting the upward trend.
We are looking for stability above the 100 moving average.
Entry price: 15.00
First target: 15.30
Second target: 15.61
Third target: 15.94

#LINK/USDT
#LINK
The price is moving within a descending channel on the 1-hour frame, adhering well to it, and is heading for a strong breakout and retest.
We are seeing a bounce from the lower boundary of the descending channel, which is support at 12.84.
We have a downtrend on the RSI indicator that is about to break and retest, supporting the upward trend.
We are looking for stability above the 100 Moving Average.
Entry price: 13.33
First target: 13.58
Second target: 13.83
Third target: 14.20

LINKUSDT 1D AnalysisLINK ~ 1D Analysis
#LINK Buy after successfully penetrating this resistant line with a short -term target of at least 10%+.


Chainlink LINK price analysisThe 6-year trend line has been keeping the #LINK price “in play” by 4 times
The next is patience and observation.
🆗 As long as the OKX:LINKUSDT price is above the blue trend line, then the medium-term targets of $38 and $53 are still relevant.
_____________________
Did you like our analysis? Leave a comment, like, and follow to get more

LINK/USDT Rebound: Is This the Start of a Bullish Leg?Chainlink is currently respecting a well-established ascending support trendline, which has held firm for several years. The price has recently bounced off this trendline once again, indicating strong buyer interest at this dynamic support level.
The Stochastic RSI is coming out of the oversold region, suggesting a potential bullish reversal is in play.
If this momentum continues, the next key area to watch is the resistance zone near the $30–$35 range. A clean break above this zone could signal a strong continuation of the long-term uptrend.
However, if the trendline breaks, LINK may revisit the key horizontal support zone around $5–$6

LINKUSDT OB+FVG+SSL long trade setupLink is already in a bullish trend, did bullish BOS. We have found OB+FVG+SSL area to enter in long trade. As marked on the chart.

LINKUSDT 1WLINK ~ 1W Analysis
#LINK Buy gradually from here if you still have a Conviction on this coin with a short -term target of at least 20%+.


LINK PREVIOUS CHART UPDATE AND NEXT MOVE.CRYPTOCAP:LINK previous trade idea update.
Here took FVG then went up to 3-4% profit then again went down during CPI news, took the previous day liquidity and went up to almost 8% profit.
In this trade we made some profit on the first 3-4% move.
👉 What’s next:- after taking the previous day's liquidity it did MSS with repainting bullish FVG. Where we can long for other long opportunities.

LINKUSDT 1WLINK ~ 1W Analysis
#LINK If you still have a Conviction on this Coin, Maybe this support you can consider to start buying again, a minimum target of 20%+.
