EUR USD NowCurrently, our focus is on the volume profile's left side, where a single print and volume imbalance are evident. We're maintaining our position behind the daily fractal to avoid altering the market structure. It's our belief that market makers might be targeting the high liquidity zone around 1.0672, but this is just a theory. Furthermore, we find ourselves in a consolidation phase below resistance. This pattern is typically quite bullish. There's no need to rush; we should patiently wait for signs of structural weaknesses on the 4-hour and 1-hour charts before deciding on our next moves.
PS. Indeed, we should exercise patience, especially since there's fundamental noise on the horizon in the coming days.
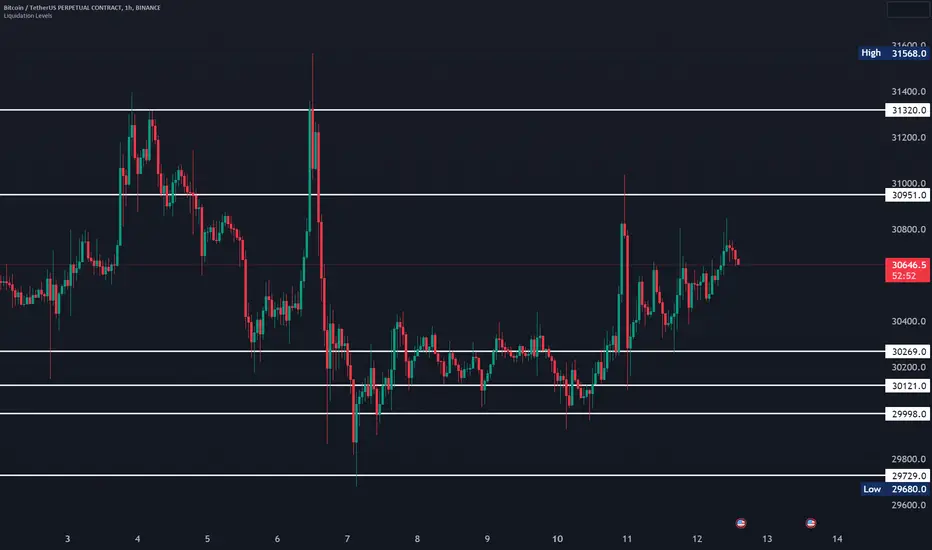
Liquidation


A very nice Bull Trap #bitcoinMany short position liquidations were on 28000 - 28500 area and market makers hit #btc to take that liqs. Now, i turned my eyes to 23500 zone, where the greatest LONG Liquidations waits the butcher to take!..
NOT FINANCIAL ADVICE.

Market Update - September 15 📨
Franklin Templeton enters spot bitcoin ETF race: The asset manager with over a trillion dollars in assets under custody filed an application with the SEC to launch a spot bitcoin ETF, joining Blackrock, ARK Invest, VanEck and others.
Web3 enthusiasts descend on Singapore for Token2049: Some of the largest names in the crypto space spoke at Token2049 this week, in what is set to be the largest Web3 conference this year. At the event, messaging app Telegram and the TON Foundation announced a new self-custodial crypto wallet.
Binance.US executives leave amid regulatory scrutiny: It was reported that the CEO of Binance.US and other executives were leaving and that the company’s workforce would be cut by a third. The moves come as Binance, Binance.US, and founder Changpeng Zhao face suits leveled against them by the SEC and CFTC.
FTX receives court approval to start liquidating crypto assets: FTX was granted permission from a bankruptcy judge to begin liquidating its crypto to start repaying creditors. The bankrupt exchange can sell up to $200 million USD in assets every week, pending creditor approval. FTX’s major crypto holdings include SOL, BTC, and ETH.
Markets muted despite inflation numbers a touch above expectations: CPI was up 3.7% from a year ago (3.6% expected), while core CPI increased 4.3% (4.3% expected). Market expectations changed little as a result, with traders seeing a 97% chance that rates will remain unchanged at next week's September 20 meeting.
➡️ Read More Here

Understanding How Forced Liquidations / Stop Hunts are DesignedIn this write up I will explain how we can extrapolate our knowledge of stop loss orders to understand the automatic execution of what are known as forced liquidations or stop hunts.
We will understand the mechanics of how Bitcoin can achieve such speed of movement and how to predict these events by reading the charts with a unique perspective of pre-design of these events.
Our first goal with viewing the Bitcoin chart is to remain objective and without personal bias. We should have no emotional attachment or opinion when it comes to trading and asset effectively.
Due to the lack of regulations in the crypto market and our knowledge of for-profit ventures benefiting off the liquidations of traders positions, we can strive to align ourselves with these forces so long as we decide to actively trade this market.
We can begin by understanding what drives Bitcoins price up and down. Unlike equities that have relational value to real world output via job creation, product sales, infrastructure, P&L reports, etc - Bitcoin is in a different class of assets lacking intrinsic value and belong to what I like to call “perceived value assets”. This means the evaluation of price is based on an agreed upon value, defined only by liquidity flowing into and out of the asset.
This creates the “volatile” nature you hear about in crypto assets. Prices are very fluid and move up and down extraordinarily fast at specific times that may seem random.
The executable actions that impact the price is the fulfillment of orders; buys and sells. Where things get interesting is in understanding stop loss orders and their accumulation.
Stop losses are effectively limit orders that reverse the position of traders by returning liquidity into the Bitcoin market cap or by pulling it out of the market cap; depending if the stop loss is for a LONG or SHORT. While it may be hard to grasp how the futures market has a direct effect on Bitcoins price, we must understand that in futures we are simply instructing Market Makers what to do with their assets by borrowing the leverage to our margin and in effect they will sell or buy Bitcoin. The stop losses of these trades are the direct opposition and not only is it in the Market Makers interest to ensure you aren’t taking money from them, attacking the stop losses and liquidations of your trades has a factual benefit to both the exchanges and market makers who collect your position margin once liquidation level is hit.
Understanding this we can look at the bitcoin chart and make sense of accumulation of stop loss orders; shown here in my boxes (green are buy orders / short stops, red are sell orders / long stops).
We can gauge for ourselves the amount of stop losses accumulated and predict the speed of bitcoins movement and clear interest in setting up a two way liquidation.
Now why would a two way liquidation of such magnitude occur?
The answer is to do with the US Dollar just underneath a major bearish retest on the 3 month chart. An entry into a bull market is would be a key time to execute a dramatic liquidation on Bitcoins chart, as we see here there is a chain reaction ready to hit both the top and bottom level I have marked.
As the stop loss orders are hit, there is accumulating power sent into the next level, which creates exponential speed of movement and this is what we like to call “stop hunts”.
Hopefully this article is helpful and allows you to understand how we can decipher the chart in a way that allows us to forecast out these movements and ideally prove that these “unpredictable” movements are in fact quite predictable after all.
- Dick Dandy

GBPUSD LONG FOLLOWED BY SHORTS *PREDICTION*As we can see on the charts the current trend is bullish - which in fact is the pullback in the higher TF (HIGHER TF - BEARISH).
We are about to enter a buy zone - only will be confirmed by the reaction off the OB, if we see a solid rejection (which will implicate the confirmation of buys) we shall follow it up to the next OB zone seen on the left hand side.
With this comes pullbacks as it reaches EQH (Equal Highs) - when an equal high occurs it will 9/10 follow with an pull back to an POI.
This will continue to the most probable OB at the top of the zone, it will most probably sweep the liquidity from the top zone also so beware of where you end up leaving your SL.
ENTRIES ONLY TO BE MADE ON LOWER TIME FRAME.
The following after the touch we will also wait again for confirmations of the short position. If achieved we will expect the lows liquidity to be swept, giving us a massive swing opportunity.

Bitcoin and the Engineering of a Mass 2-Way LiquidationBitcoin is set up to perform a two way liquidation any moment now - as it corresponds to DXY.
The chart is loaded with stop orders shown respectively as buy orders in green and sell orders in red.
This is how the chart engineers such moves to perform at such speed without reliance on retail traders at all - the orders are embedded in the chart itself.
Think of lighting the fuse of a chain of explosives that accumulate more and more momentum in a big chain reaction.
Look at my levels shown here for liquidation top and bottom - Bottom is the entry of a bull market to 60,000 or more.
God speed and be safe.