Liquidation

Learn to identify liquidity levels. Before we begin, we need to understand what liquidity is.
A market with high liquidity is one where there is a large number of buyers and sellers willing to trade in that particular asset. This means that there is a high availability of buy and sell orders, allowing transactions to be executed quickly and with minimal impact on prices.
Where are the most liquid points located on a chart?
These points are found at the highs and lows. This is because at these points, many people are waiting for the zone to act as support or resistance, or for the price to break the zone (breakout) to continue its direction. I always use daily, weekly, and monthly timeframes to identify these zones.
Why the liquid points are importante on a chart?
Liquidity is extremely important because it is the direction in which the price moves. The price will always move towards these points to attract liquidity to the market. Without liquidity, financial markets cannot function.
Which indicator can you use to identify liquidity levels?
Previous Days Week Highs & Lows by sbtnc
Certainly, this indicator will facilitate the process of identifying these points, but it will not identify all of them.
-----Remember, like everything in trading, this needs to be combined with other confluences. It won't work by itself.-----
Explanation of the example presented in the chart.
I had some strong confluences indicating that the price was likely to have a bullish move. As seen in the COT report, there was aggressive selling of JPY. One of the things that helped me take this trade with confidence is that, as you can see in the circle, there was a weekly and monthly high together without being cleared. This created a double top pattern. Since this was such a liquid point, it gave me the confidence that the price would move towards this point before changing direction. And it did exactly that after consolidating for several days. These liquidity points can be used as confluence in our analysis, as well as a potential take profit level.

$BTCUSD SOPR, BFX Longs and Shorts, Greed, Liquidations.
This is one of the multi-chart evolving dashboards I use daily for crypto trading. This dashboard attempts to distill a broad scope of data and sentiment into glance value charts. The goal with such dashboards is to seek to stack probabilities to be on the right side of the percentages in every trade.
--
The top panel chart shows the SOPR (Spent Output Profit Ratio, (grey line, using the symbol $BTC_SOPR) overlay vs $BTCUSDT (Binance, in blue). The SOPR is a very simple indicator. It is the spent outputs expressed as a ratio and shown as an oscillator on the chart. The Bitcoin SOPR is the realised dollar value divided by the dollar value at creation of the output. Or simply: price sold divided by price paid.
SOPR showing under value 1 means that the on chain data has recorded a net realised loss for "spent" Bitcoin. SOPR showing over value 1 means net profit. Renato Shirakashi appears to be the inventor of SOPR for BTC, and he writes about SOPR: "In this analysis two important psychological turning points that significantly change the supply of bitcoin are going to be described by introducing a new oscillating indicator that signals when these major supply changes occur, using blockchain data." I interpret this reference to the psychology of "weak hands" getting flushed out of the market by selling at a loss as shown when SOPR sits below 1 for extended periods of time (bear), and when all the weak hands have left the market, we find a bottom.
Because I am an impatient learner, I needed further examples to understand fully. If someone sells you 1 Bitcoin at $50,000USD, that transaction is recorded on the blockchain. If you then sell it for $25,000USD, that is now a spent output which is obviously a negative 0.5 ratio, and would contribute to a SOPR lower than the value 1. Interestingly the SOPR tends to be very close to the value 1 nearly always. Which means that the aggregated data of all spent outputs is nowhere near as extreme as the example I gave (although I'm sure there are plenty of retail traders who bought the high and sold the bottom at a 50% loss).
If we rewind to extended periods of low points in the SOPR ratio, extended negative ratio periods coincide with low points. In the past 5 years the lowest ratio was around 0.88, which was December 2018, when the price of Bitcoin was heading lower than $4k USD. That particularly brutal bear market lasted 18 months and you can see that the SOPR was below value 1 for nearly the entire time, indicating that there was a long tail of weak hands realising losses the entire time.
---
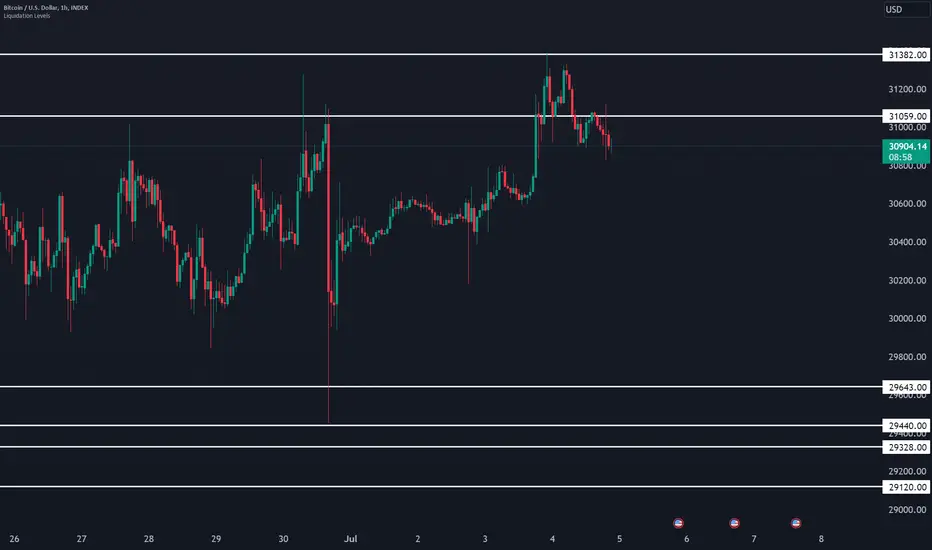
Also present on the top chart is a brilliant little free indicator called Liq.Levels , wtf is all I can say, this a masterpiece of long/short liquidation data based on market maker behaviour in this case Binance's perpetual BTC/USDT leveraged futures (one of the most active retail leverage platforms). On this layout I have hidden all but the 25x liquidation points both short and long as it captures the widest spread and for the simplest visual as this is a glance-dashboard, on a single panel layout you can view the 50x and 100x which are tighter spreads. Liq.Levels also filters for a minimum of one million USD, so this is real value the market makers are getting out of bed for, essentially these levels are where the market maker really wants to push the price to. If you're new to leverage (don't do it! just buy at spot!), the reason they do this is to hunt the longs and the shorts and cause maximum liquidations (are you still trading with leverage?!).
---
The second panel is the famous Bitfinex Longs (green) and Shorts (red) . You can see currently the longs, since around the $39000 level went parabolic. The shorts are just tiny in comparison. The data from Bitfinex seems less erratic than those from other exchanges, so if you find looking at longs and shorts ratios useful, I'd suggest also looking at other websites to see the other major exchange long and short activity, liquidations, and ratios.
This info is used to monitor large moves by leveraged traders. While Bitfinex is not the best measure here (ideally you would want all major exchanges aggregated longs vs shorts, but I have not found such indicators on TV, only Bitfinex), you can check the data by comparing it to another exchange, for example Binance you can see that parabolic move the Longs made from the 11th of July to around the 14th of July (while the BTC price fell off a cliff from $30k to $20k), where the ratio of Longs vs Shorts on Binance also skewed heavily to the Long side.
This is another way to stack a probability. As the Longs level off and get flushed out (usually by mass liquidation!), this is another variable to find support or resistance. For example you can see the levelling off around 12 May 2022, Bitcoin's price found a short term bottom at $29k. Similarly and most recently you can see as the Longs levelled off from a hectic run up in the mid June 2022 selloff, the price found a short term bottom around $20k. You could say that recently or commonly this is a contrarian indicator, assuming that smart money is seeking to liquidate the maximum possible leveraged positions, so we can assume that generally these leveraged retail traders will largely make incorrect bets most of the time, hence historically as soon as Shorts leave the market, the price spikes up, and vice versa. So, another thing to watch.
---
Next we have a Crypto Fear & Greed Index , which as you can see nearly always oscillates in a tight rhythm with Bitcoin's price action. Above 75 (green dotted line) is extreme greed, below 25 (red dotted line) extreme fear. There are quite a few websites that attempt to measure crypto Fear & Greed, and even a variety of different indicators on TradingView, but this was the clearest visually I could find here. The inputs on this version according to the coder are stable coin flows (flight to safety), coin momentum (top 18 coin price relative to 30 day averages), and top 18 coin price high over the previous 90 days. So, it's interesting that despite this being at face value a rather complicated set of data with many inputs, that it just looks like a carbon copy of the Bitcoin chart. Bitcoin has a gravity that is inescapable for all things crypto right now.
The difference between looking at this indicator and simply looking at Bitcoin's chart is that it flattens out the action and has a set floor and a ceiling. You can see historically that the best buy times were when fear was at its "height" (where the yellow line is at its lowest). Another way to stack probabilities. At time of writing, is this a great time to buy? Fear appears to be leaving the market, we haven't had a commensurate price move up, so I'd be cautious. Like all these indicators, you can just overlay Bitcoin's price line and backtest the correlation in a few seconds. Buying when fear is at a maximum is usually easier said than done, though!
---
Lastly we have Liquidations by Volume , as per the coder this "shows actual liquidations on a per-candle basis by using the difference in volume between spot and futures markets." Blue line is futures volumes, yellow are spot volumes. The code for this indicator shows that it is the same BTCUSDT Perpetual Future's contract from Binance that we have in the Liq.Levels indicator, perfect.
Worth noting is that the community of coders at TradingView is a trader's dream. These sorts of customisable dashboards you can build are high value. Having worked for the largest international institutions I find many of these indicators are institutional grade and they have just a few hundred users sometimes, pretty crazy how early in the adoption curve we are with this. If you haven't experienced the "other side" of trading, compared to regular equities forex futures etc the TradingView tools and the crypto data and exchanges are just lightyears ahead.
Back to why look at liquidations? As institutions come into the market, and retail wallets on exchanges like Binance and many others continue to use leverage, the action in the derivative (in this case $BTCUSDTPERP) can and often does drive the price of the underlying. Market makers hunt the maximum liquidations, always. The market context is highly relevant here. During volatile periods it is a swinging contrarian indicator. If there has been massive green bars showing short liquidations pushing the price up, then we could be forming/hitting resistance levels and can see reversal/selloffs, and vice versa if there are massive red bars showing long liquidations pushing the price down, this can be hammering out support levels and we look to bounce. The longs and the shorts really do seem to be taking turns getting liquidated right now.
Also of relevance is the price action relative to the liquidations. Obviously if an institutional candle pushes the price up or down, there will be mass liquidations. But another scenario that occurs is when are light volumes on the derivatives such as $BTCUSDTPERP we have under the microscope here, but we have large Bitcoin price movements, then the reasons for the move can be understood differently, and we can use this and other contexts to draw conclusions such as for example a scenario where price goes up with light liquidations and derivative action, which could be interpreted as much stronger hands holding coins rather than simply margin calls.
---
Good luck!

Interecting POIAs always new week in front of us and new opportunities for us to enter the market. There are twoi main POI where we can go long for new HH on H1. Because market already took interesting liquidity, the buy can happen immediatelly after market open.

EUWe have a nice liquidity bellow current price on EU, price probably should go there to take that. After that we can expect some upmove for new HH on h structure.

GMTUSDT possible breakout to the previous zone with further moveOn the 15-minute timeframe, the instrument shows a halt in the downward local trend, with high volumes at the lows indicating buyer interest. An attempt to set a new low was unsuccessful as the price returned to the old range, gathering liquidity at the previous lows, resulting in multiple touches on the long breakout. The price is now trading below it, creating an entry opportunity for a long position.
We expect an impulse breakout by triggering stop orders above the highs to remove the liquidity

AUDCHF: Bull TrapAfter an aggressive sell-off, price has started to lure in buyers.
This can be seen on the daily time frame with the recent buy inducement candles.
Buyers being lured in means liquidity below the established low.
I believe will price will flow to this low with the help of the news today.
I am really not sure where the sell with take place so for now it's simply an observation.
If something aligns with me and my intuition later in the day, I will enter a sell position and update you.

BITCOIN SHORT ANAYSISWhile Everyone is bullish on bitcoin , I hope bears will get strong on upcoming week

BTC little bit to the upside before major move to downsideHello.
In todays analysis I checked BTC and its liqudiation cluster.talked about SPX and dxy and how they are correlated to btc
I think btc might move a bit higher resulting in a new extreme before comin back down to form lower lows and possibly losing 20k in this week
I am open to suggestions
Thanks for watching

BTC Ranging and my plan of actions (long and short ready)
Keeping this chart and idea pretty simple as those are always the best plans in my opinion. I have been observing the current BTC range which I have shown by purple lines. I am personally not interested in trading within this range, although there are plenty of trades to take, I am choosing to opt out and let this range run its course especially with a lot of major news releases upcoming. My strategy is simply to wait for buyer or seller strength to overcome the other, meaning a strong candle close outside of the range.
When that range is broken (long or short) it will be important to have some altcoins prepared to trade so they should be prepared beforehand. I'll show an example of what I am watching for altcoin trades using this example of YFII-USDT:
This is a chart with a strong and obvious resistance overhead. My strategy here is if BTC breaks it's range higher, then I will go through my flagged charts such as YFII and see if they have also just broken that resistance and use that to time the trades. It's important to have setups prepared for longs and shorts so that we are prepared for BTC to break the range either way.
The only additional note I will make for the BTC range, is that it will be critical to pay attention to the breaks of any support and resistance I have drawn. Particularly regarding liquidity traps, essentially false breakouts. So if BTC makes a break outside of the range and then comes back into the range after a clear breakout it will be crucial to be able to flip your trading bias and recognize this as a fakeout.

Liquidity under on BTCAlmost every time when we build liquidity under us we have sharp move to grab that. Posible similar scenario now, we build trend line liquidity bellow and we have to take it. Liquidity abow curent price is already taken so we can fall down for liquidity under. Price target is the wick of impulsive move up .

US30 Initial Weekly Forecast Last week, US30 was technically and fundamentally driven to the downside. What I wanted to discuss here is the simple concept of a trendline. Now a lot of new traders learn to trade the brake and retest a trendline. Depending on whether they know how to trade it and read the price action correctly is the determinant. What can save you from this type of loss is understanding that even though a trendline is broken, it does not necessarily the trend is broken. What is more important than the trend line is the market structure! If price does not break the previous high or low, then is a high chance for a trader's position to be liquidated by the market. This was the exact case for US30 at the end of last week. Currently, we are presented with 2 strong bullish candles with a decent range. The probability for price action to fully retrace last week's move is pretty high. This week I will be analyzing this in addition to the dollar index and the US 10Y, and hopefully, a great setup come out of it. Key level target has also been noted. :-)

ltf btc long ideaexplanations are indicated on the graph. this is an experimental study. I just tried to read the purpose of the market maker.

BTC short term scenario- 18.5K or 22.5KHi everyone, I'm looking at daily timeframe. To tell the truth I would like to see this scenario to play out. When BTC pullbacks to 20.1-20.3K zone I will try long position with tight stop loss.
When BTC rejected at 21.3-21.5K zone, 90% opened short positions, Will be ideal if BTC pumps to 22.3-22.5K zone and liquidates enormous amount short positions before retrace to 18.5-19K zone.
Let's follow and see how BTC behaves))

BTCUSDT - Who is next to liquidate? Guess or Chess? Hallo to all. Here, we present something we wanted to share publicly, since we started the development of the Liquidations Levels indicator, 1.5 year ago.
We think it is useful, because It has to do with the accuracy of the result and the indicator.
We compare what you might think it happened (when using the indicator) with the reality, what really really happened in the charts.
To be honest: The accuracy of the results was always a question inside our mind. If we couldn't validate the calculations in reality, then the indicator is useless or it might lead to misunderstanding or, worse, misinterpretation.
Some things first:
The indicator is trying to calculate the other traders large over-leveraged positions at the time they opened, plot them in the chart exactly when they opened and to track the pair Price Action (recaction) for these.
The Market Maker, is always, hunting these positions and is trying to create Max Pain for these type of positions, by hitting them, usually in bunches/groups of them, with wicks or aggressive moves.
Liq Levels calculations: In order to do the correct calculations, we were forced to make (like on every algorithm) some mini-assumptions about the calculations.
It's like the Fast Fourier Transform sampling (FTT) coming from the Signal Processing Theory, we have learned in Communications on University, many years ago.
The sampling , the interval , the period are extremely important parameters. Especially here, for each parameter, even a change of 0.01 percent will lead to different results. So we must be accurate.
So... The 1 million dollars question: Does the indicator shows real liquidations? Is the MM actually liquidate trades positions in the indicators levels we have calculate?
Can we trust the indicator in the Trading View?
The answer is YES. It is a 100% validation.
After a long time, we have finally managed to plot all the real time liquidations that happened in Binance Futures pairs, directly in the chart. These data are collected by the official feed from the Binance API.
So, every green "X" you see in the following chart, is a single liquidation of a Long Position and every red "X" is the liquidation of a Short Position. On the same chart there are also plotted the Liquidation levels indicator with their lines. I think the chart speaks for it self.
Where the liquidation levels plot a line, and when the price went there finally, there exactly, the liquidations happened.
The validation of Liquidation Levels with the real liquidations:
If someone asks me, about what will be the next move, I will answer to him/her with something else:
Noone knows (except the MM), but with the use of the liquidation levels indicator, you can help yourself, and transform your trading style, from a Guess game, to a Chess game. Use your mind, evaluate the situation, and think like the MM.
What you will do next?
This will be another story to analyze.
Best regards to all,
the Mobility in Life Applications TEAM
(developers of the Liquidations Levels indicator)

Explaining "Net Net" stocks : ARVL up 100% ,was sub liquidation ARVL stock rocketed 100% today alone. The move might be explained by the fact that the marketcap was trading below "net liquidation value". Net net stocks, or stocks trading below liquidation value, is a strategy used by Benjamin Graham who also taught Warren Buffett how to use the strategy.
Small cap stocks and penny stocks are extremely risky. You can and will lose money investing in Penny stocks. This video explanation discussion is for entertainment and education only.


FTX Hacker now 36th largest holder of ETH EthereumFTX "hacker" has converted 25,000 ETH worth $30 million into Bitcoin , on-chain data reveals. Total ETH stolen is valued $288 Million.
So 3% sell-off for 10% of the stolen value.
Imagine if the hacker sells more!
On the other hand, Grayscale won’t share proof of reserves, citing ‘security concerns’.
Grayscale theoretically owns 3.3% of the Bitcoin market cap. LUNA owned only 80k BTC, while Grayscale owns 640k BTC.
MSTR MicroStrategy gets a liquidation call at $13500K for BTC.
Cryptocurrency lender Genesis was seeking an emergency loan of $1 billion from investors before Monday, Nov 21.
My Price Targets for ETH Ethereum are $1055 and $875.
Looking forward to read your opinion about it.

Hood Buyout Incoming?Sam is gone, forced liquidated and hood made the right shoulder?
Don't think this stock is going to survive on its own, nor if their is going to be a buyout that is going to be higher than $20
Not investment advice, do your own due research.
Look First / Then Leap
Just speculating...

Liqudation Problem and SolvingHello, what I am describing here is definitely not an “Investment Advice”. It is at your own risk, remember that you are responsible for your gains and losses!
Eliminating Liquidation Risk…
I do my transactions on the BINANCE exchange, my samples and recipes are according to the menus of this exchange.
Click on the tab in the Upper Right Corner of your Leveraged Trading Order menu.
Activate by clicking Preference – Position Mode – Hedge Mode.
The menu will change to Open - Close in Two Tabs at the Top
Your Margin Mode must be on "Cross"
Adjust your leverage settings (X) to your liking
OPEN
In this mode, you can only open LONG and SHORT positions, do not confuse them with the other menu in One-Way mode, open the position in LONG or SHORT position at the price and amount you want, paying attention to the support and resistance .
CLOSE
In this mode, you can only CLOSE LONG and SHORT positions, do not confuse them with the other menu in One-Way mode, you can close the positions you have opened in OPEN mode in this mode, the button colors are changing, please read above "CLOSE SHORT (GREEN)-CLOSE LONG (RED) carefully.
Watch more videos about HEDGE Usage and do small experiments….
Let's Come To Eliminate Liquidation Risk…
NOTE: Never Deal With Your Entire Cash!!!!
My recommendation is 10-15% of your maximum safe for leverage over 50X
We all open our positions for profit and enjoy our green USDTs rising in the submenu, but sometimes we wait for more without being ambitious and get stuck…
This is where the HEDGE mode comes to the rescue, you opened the POS and you are in profit, the price has increased or vice versa, you are in profit in the SHORT pose, please manage your psychology well in this profitable moment and move forward with the target, the opposite of the position we have opened and please pay attention here You open the reverse transaction “UP TO AMOUNT” as I described above…
You can use this method when you make a wrong transaction and fix your balance in the same way!
No matter where the price goes, the profit or loss you see is always fixed in your pocket… Our problem with being liquid is eliminated, and we can sleep comfortably.
Yes, but will this process continue forever? When do we take a profit or make a loss?
I have made hundreds of experiments without a stop so far, as a result, a price never falls or rises constantly, patience comes into play here, improve your technical analysis knowledge for direction determination, if you cannot draw graphs, trends, etc., follow many well-intentioned people who give support and resistance on social media! (I'm not talking about PHENOS here, most of them give you gas and sell their goods)
While the two-way trade is open, I sell 50% of the position in the profit, whichever direction I am approaching the support or resistance, and I switch to waiting, I realize my profit by gradually buying or selling in the direction of the reaction. Since it is HEDGE mode, of course, the other direction seems to be in loss, right here, again, I am waiting for the right price to come to support or resistance by reducing my loss percentage with gradual purchases.
I saw that there is a DUMP or PUMP risk, I am insuring myself by opening a reverse trade against my open loss trade, and I follow my trades according to the calming market direction.
I am happy if I could be useful, please do not lose your money, as someone who has been liquid many times, I did not get help from anyone, I found this method with my own research, since then my safe has not written off, I have not rushed and closed any of my positions.
Experiment with small amounts as much as you can, applying it correctly and with a little math, you'll be sure to see the benefits.
Your criticism and advice comments will be useful for us to improve each other.
Respects

AUDCHF showing some bullish patternAUDCHF is in uptrend which have started in july and has mitigated the area of demand after showing more break of structure to the upside and the formation of equal lows (liquidity) which got liquidated and this indicate strength in the pair. from this area we are taking a long position for this pair to capture the opportunity.please dont take this as signal, add your futher confirmations and you use your own strategy to make the decision.

USDCHF: Supply Trap 🚀Don't underestimate the dollar strength, although we are trading at a key supply level, take note of the price delivery and equal high liquidity to the left.
We could either push up aggressively from here or see a lure trap before hunting liquidity.
Either way, my bias is set on buys.
🚀Thanks for your BOOSTS and support🚀
💬Send your comments and questions below, I'll be glad to talk to you💬
