GBPNZD H4 - LONGPrices broke structure, leaving behind an area of demand to get involved. Similarly, look for a 15m shift in structure for buys.
Liquidation

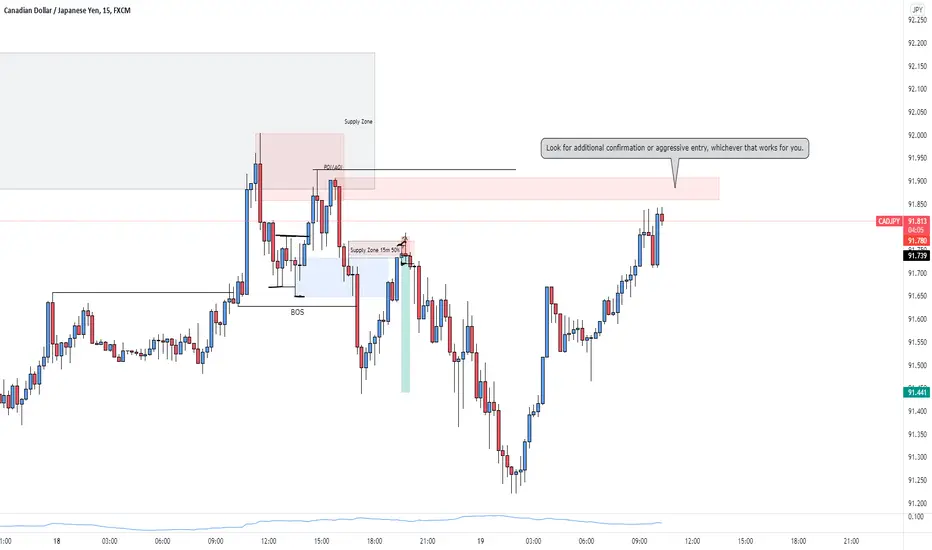
CADJPY 15M - SHORTPrice broke structure on the higher timeframe, looking for a pullback into our supply area before we take sells.
Using the 3-SP method, we are waiting for a structural shift on the LTF before we fire an entry.
EURUSD H4 - LONGAs discussed in the weekly market analysis, we are looking for a pullback onto either of these demand areas to get involved.
As a HTF trader, you can look for an instant execution. Otherwise, look for confirmations on the lowertimeframe for a long position.

Only Strategy You Ever Need! .. Liquidity Build&SweepHello everyone!
Liquidity is the main force that moves all markets, understand it well, and everything becomes clearer...
Liquidity, simply, is "where orders are resting". Sometimes it is clear, other times not. So you have to look really well into where we have relative equal highs (sell-side) or lows (buy-side).Does that mean to jump into buying below relative equal lows/selling above relative equal highs right away? Of course no. As explained above, most of the time we have an indication as to whether the Market is responding as it shouldmd or not. Like a rejection or multiple rejections or a candle pattern or whatever.. you should see and indiction in price action, not indicators. Also pay attention to time frames. Equal highs/lows should not be treated the same way in small and big time frames... At least 15-min timeframe is recommended...
Your comments are highly appreciated...
Please don't forget to ▶️ FOLLOW & ▶️LIKE if you found my tutorial a help to you... Great content is to come yet.. hopefully..
Thanks Guys!

#AUD NZD # LOOKING SELL Iam looking to sell on AUD NZD NYC SESSION . possible sell side liquidation.

BTC, Shaky Market Ahead!@everyone be careful of BTC right now. It will be shaky couple of days. I think we may have a wick to the lower trendline today. Everyone is going long so it's time to liquidate some leverage trades.
Be very careful of alt coins they will get destroyed over these highly volatile moves.

GBPJPY H1 - SELL TO BUY AND BUY TO SELLPrices are trading near weekly highs, looking for a sell to buy and buy to sell move. Wait for the shift in structure on the lower timeframe before taking trades.

EURJPY H4 - SHORTPrices broke H4 structure, gave us a shift on the 15m and now looking for a tap into previous unmitigated areas of supply for sells.

USDCAD LONGWe took profit and previous liquidity high, now become Break of structure. Look for a pullback into unmitigated demand areas for LONG.

GBPJPY H1 - SHORTPrices broke structure on the H4 towards the sell-side, leaving behind 2 areas of supply to get involved.

EURNZD H4 - SHORTLong term projections for EURNZD, swing traders can look to get involved while day traders can look for LTF movements like the 15m to form a temporary short term bias that is in line with the HTF bias for sells.

EURAUD H4 - LONGPrices broke structure, and we can look to get involved if we get a pullback. Look for confirmations if you must!

GBPCHF H4 - LONGPrices broke structure, leaving behind a demand to get involved. Look for LTF confirmations if you want to, to get the best R/R possible.

NZDUSD H1 - SHORTPrices broke out of H4 swing low, leaving behind a supply zone for us to work with. Wait for a distribution or confirmation that prices wants to head lower before taking sells.

GBPJPY 15M - SHORTPrices grabbed liquidity to the top side, followed by a break of structure to the downside, leaving behind supply areas to get involved.
Look for confirmations then again, before taking sells.

AUDUSD H4 - SELL TO BUYWe could look for a SELL if prices broke the immediate H4 swing low, then look for supply areas to get involved for SELLS into the demand area to potentially go higher.
If we expect a move towards Liquidity lows, we need the H4 demand to fail, before prices can head down lower.

NZDCAD H4 - LONGPrices broke structure, leaving behind 2 areas of demand to get involved. Both are valid but of course, buying at discounted prices beneath the entire range would be most ideal. Look for the confirmations you need before taking the entry.

Same investor same move ;)Hello everyone :)
We see that the move we called Liquidity run before ended with an average of 60%. He seems to have started a similar movement now, and the volume at the beginning of the movement is same. Most likely, the smart money in this coin plans to make the same move again. Since this person or community is satisfied with an average of 60% profit, it would be reasonable to take profit from the place shown in the chart or before as a target.
Good luck to everyone. If you have any questions, don't hesitate to ask...
If you like my charts and predictions, please support :) Your motivation gives me strength. Don't forget to follow and like :)

GBPCAD H1 - LONGPrices broke structure, leaving behind 2 ranges to work with. The one above has a smaller range therefore, we could trade the immediate BOS if we see a structural shift onto demand area.
Otherwise, with the context of the entire market structure, we could wait for a deeper pullback > accumulation and the transfer of weak into strong hands for a valid buy.

USDCAD DAILY - SHORTUSDCAD Projections towards the downside. Prices broke the Swing Low that created the Ultimate High, showing us that it wants to go bearish.
We could sell into the immediate demand area created on the daily. Otherwise, wait for the demand to fail and trade the flip zone AKA Supply that cause demand to fail.

NZDCAD 15M - LONGPrices broke H4 structure, leaving behind a 15m demand to get involved. Wait for the shift in structure to take prices towards liquidity highs.

USDJPY 30M - LONGPrices broke structure, leaving behind 2 pois to work with. Look for confirmations onto the demand area to get involved in the market!

AUDUSD 30M - SHORTPrices broke daily structure and is coming back for a test of supply area on the 30m. Look for confirmations for sells.
