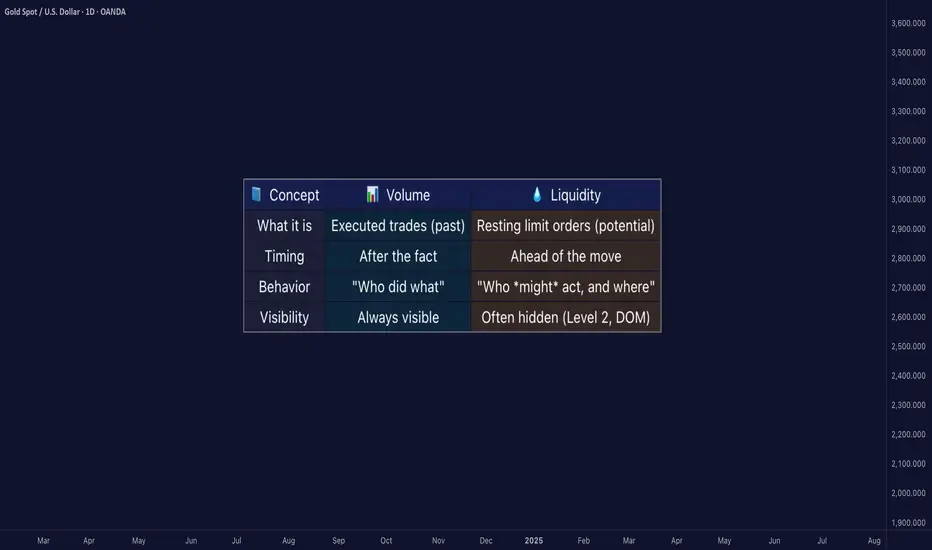
Liquidity ≠ Volume: The Truth Most Traders Never Learn█ Liquidity ≠ Volume: The Truth Most Traders Never Learn
Most traders obsess over volume bars, but volume is the footprint, not the path forward.
If you’ve ever seen price explode with no volume or fail despite strong volume, you’ve witnessed liquidity in action.
█ Here’s what you need to know
⚪ Volume Is Reactive — Liquidity Is Predictive
Volume tells you what happened.
Liquidity tells you what can happen.
█ Scenario 1: Price Jumps on Low Volume
❝ A price can jump on low volume if no liquidity exists above.❞
⚪ What’s happening?
The order book is thin above the current price (i.e., few or no sellers).
Even a small market buy order clears out available asks and pushes price up multiple levels.
Volume is low, but the impact is high because there’s no resistance.
⚪ Implication:
This is called a liquidity vacuum.
It can happen before news, during rebalancing, before session openings, on illiquid instruments, or during off-hours.
Traders often overestimate the strength of the move because they only see the candle, not the absence of offers behind it.
█ Scenario 2: Move Fails on High Volume
❝ A move can fail on high volume if it runs into a wall of offers or bids.❞
⚪ What’s happening?
There’s a strong surge of aggressive buying or selling (high volume).
But the order book has deep liquidity at that level — large resting limit orders.
The aggressive traders can’t chew through the liquidity wall, and price stalls or reverses.
⚪ Implication:
This is called liquidity absorption.
Market makers or institutions may intentionally absorb flow to stop a breakout.
Many retail traders mistake this for “fakeouts,” but it’s really liquidity defending a level.
⚪ What the Research Says
Cont, Stoikov, Talreja (2014): Price responds more to order book imbalance than trade volume.
Bouchaud et al. (2009): Liquidity gaps, not trade size, are what truly move markets.
Hasbrouck (1991): Trades only impact price if they consume liquidity.
Institutions don’t chase candles — they model depth, imbalance, and liquidity resilience.
⚪ Where the Alpha Lives
Liquidity tells you where the market is weak, strong, or vulnerable — before price moves.
Fakeouts happen in thin books.
Reversals occur at hidden walls of liquidity.
Breakouts sustain when liquidity follows the price, not pulls away.
If you understand this, you can:
Enter before volume shows up
Avoid chasing dead breakouts
Fade failed moves into empty space
█ Final Truth
Volume is the echo. Liquidity is the terrain. Alpha is in reading the terrain. You want to study the structure, because price moves toward weakness and away from strength. Learn to see where liquidity is, or where it’s missing, and you’ll see trading with new eyes.
-----------------
Disclaimer
The content provided in my scripts, indicators, ideas, algorithms, and systems is for educational and informational purposes only. It does not constitute financial advice, investment recommendations, or a solicitation to buy or sell any financial instruments. I will not accept liability for any loss or damage, including without limitation any loss of profit, which may arise directly or indirectly from the use of or reliance on such information.
All investments involve risk, and the past performance of a security, industry, sector, market, financial product, trading strategy, backtest, or individual's trading does not guarantee future results or returns. Investors are fully responsible for any investment decisions they make. Such decisions should be based solely on an evaluation of their financial circumstances, investment objectives, risk tolerance, and liquidity needs.
Liquidationlevels
BTCUSD CONSOLIDATES BEFORE NEXT HIKE
BTCUSD CONSOLIDATES BEFORE NEXT HIKE📈
Bitcoin has been under buying pressure since the beginning of July 9. Since July 14 the price has been consolidating. Now the graph represents the bullish pennant.
I expect the price to continue trading sideways for some time, then rebound from the trendline and move towards first major liquidation level at 127,400.00.
What is a liquidation Level?
The price at which a crypto exchange forcibly closes a leveraged position when margin falls below the required level, recovering borrowed funds.

If Trend Reverses, We'll Most likely See 106-109k FirstTrading Fam,
We'll bring our knowledge of liquidity to the chart here today. You guys know that my new indicator utilizes liquidity as a prime factor in helping to alert us when to buy and sell any given asset. In our chart here today, I have also brought over the liquidation map from Glassnode, which will help us gain further insight into what Bitcoin's next move might be.
First, let me explain a few of the drawing here.
For those who may be new, those liquidity blocks are printed by LuxAlgo's "Liquidity Swings" indicator. I have incorporated them into my indicator and have combined it with another to alert me as to exactly when it might become a good time to buy or sell. Typically, I set the blocks to have a 15 day life cycle. When we are overbought and enter into a sell-side liquidity block, my indicator will flash a red dot. When we are oversold and enter into a buy-side liquidity block, my indicator will flash a green dot. These are typically super-accurate signals and are, at least, a good time to start your exits and/or entries but unfortunately, these DOTS DO NOT APPEAR in this chart due to this being a private indicator distributed by invite only.
I use additional indicators for confirmation and to support what my indicator is showing me, such as the VRVP. You can see the VRVP Point of Control (PoC) is at 96,425 in this chart, meaning that most of our recent traded volume is to the underside of us right now. This is positive. However, it is important to recognize that sometimes that PoC can act as sort of a magnet to pull price back to that area before further directional price trend movement. Keep this in mind as we continue to consider price movement here.
Back to the liquidity blocks. I've extended our last big liquidity block from Jan-Feb of this year out past the normal 15 day life cycle that I usually set. I think this is important as it appears to align with the data that I've brought over from Glassnode's Liquidation Map. Notice that on the map you see large liquidity pools both below the current price and also, above it. But the larger liquidity pool remains above us at the time of this post. This aligns with the resistance levels I have drawn on the chart in white which remain above us. And currently, we are also forming a bull flag pattern. So, are greatest probability of price movement right now remains to the upside. I am targeting that 106-108k area. Once hit, trend reversal could occur.
Here's what I expect.
We hit 106-108k. Then, at this point, the market must make a critical decision; do we continue up, beating previous highs, or do we first drop down and liquidate all those late longs from 93-104k?
Now, since we know that big money is in this game and wants as much as they can get at the best price possible, it is easier to determine what might occur. I suggest that once liquidation occurs up to 106-108k, sell-side pressure will be placed on the market in hopes of driving price back down to clean out all of those late long entries. That PoC level at around 96k is a good target here. Once this price has been hit, freeing up hundreds of millions in liquidated Bitcoin, the big buyers (smart money) will step back in to swoop up the loot and Bitcoin will be free to trend back up again.
Now, as always, I could be wrong. Let's talk about what happens if we beat our 106-108k overhead resistance levels. In this case, we could see Bitcoin pump as high as 125k before any local trend reversal begins to occur. I will re-assess at this point.
BLUF: 106-108k is key resistance. Mark your charts and keep your eye on what price does there. It will be key to what happens next.
✌️Stew

Bitcoin LiquidationBitcoin Liquidation
there is Short & Long Liquidation price on binance
I look about the liquidity prices there is a huge liquidity
Long Liquidation red line's
59300
55600
Short Liquidation long line's
73650
67500

Bitcoin LiquidationBitcoin Liquidation
there is Short & Long Liquidation price on binance
I look about the liquidity prices there is a huge liquidity
Long Liquidation red line's
64200
62650
Short Liquidation long line's
71750
67700

Bitcoin LiquidationBitcoin Liquidation
there is Short & Long Liquidation price on binance
I look about the liquidity prices there is a huge liquidity
Long Liquidation red line's
62650
55700
Short Liquidation long line's
71800
70450

Bitcoin LiquidationBitcoin Liquidation
there is Short & Long Liquidation price on binance
I look about the liquidity prices there is a huge liquidity
Long Liquidation red line's
64150
62800
Short Liquidation long line's
73550
70500

Bitcoin LiquidationBitcoin Liquidation
there is Short & Long Liquidation price on binance
I look about the liquidity prices there is a huge liquidity
Long Liquidation red line's
66900
64150
Short Liquidation long line's
72350
70500

Bitcoin LiquidationBitcoin Liquidation
there is Short & Long Liquidation price on binance
I look about the liquidity prices there is a huge liquidity
Long Liquidation red line's
69850
68350
Short Liquidation long line's
77800
73550

Bitcoin LiquidationBitcoin Liquidation
there is Short & Long Liquidation price on binance
I look about the liquidity prices there is a huge liquidity
Long Liquidation red line's
68350
66650
Short Liquidation long line's
81000
74100

Bitcoin LiquidationBitcoin Liquidation
there is Short & Long Liquidation price on binance
I look about the liquidity prices there is a huge liquidity
Long Liquidation red line's
66150
61850
Short Liquidation long line's
74950
70900

Bitcoin LiquidationBitcoin Liquidation
there is Short & Long Liquidation price on binance
I look about the liquidity prices there is a huge liquidity
Long Liquidation red line's
65450
61350
Short Liquidation long line's
81100
74450

Bitcoin LiquidationBitcoin Liquidation
there is Short & Long Liquidation price on binance
I look about the liquidity prices there is a huge liquidity
Long Liquidation red line's
65750
64450
Short Liquidation long line's
73600
72550

Bitcoin LiquidationBitcoin Liquidation
there is Short & Long Liquidation price on binance
I look about the liquidity prices there is a huge liquidity
Long Liquidation red line's
64350
60600
Short Liquidation long line's
80100
72350

#Bitcoin [ Inverted Head And Shoulders - Short Squeeze Combo ] BTCUSD has printed an allbeit slanted yet very nice inverted head and shoulders that has retested and played out perfectly so far. The measured move coincides with multiple high time frame short liquidation levels (Not marked on this chart) with the biggest level being a 6 MONTH high volume liquidation level at $74,045. This strong of a #shortsqueeze could easily amplify the measured move, which I have extended, using the 150%-161.8% fib levels. The extension also lines right up with where all short liquidation levels end on the Coinglass heat map.

Bitcoin LiquidationBitcoin Liquidation
there is Short & Long Liquidation price on binance
I look about the liquidity prices there is a huge liquidity
Long Liquidation red line's
60050
55150
Short Liquidation long line's
66850
63750

Bitcoin LiquidationBitcoin Liquidation
there is Short & Long Liquidation price on binance
I look about the liquidity prices there is a huge liquidity
Long Liquidation red line's
59900
55150
Short Liquidation long line's
66900
64600

Bitcoin LiquidationBitcoin Liquidation
there is Short & Long Liquidation price on binance
I look about the liquidity prices there is a huge liquidity
Long Liquidation red line's
60050
57700
Short Liquidation long line's
66150
64600

Bitcoin LiquidationBitcoin Liquidation
there is Short & Long Liquidation price on binance
I look about the liquidity prices there is a huge liquidity
Long Liquidation red line's
60700
56900
Short Liquidation long line's
69000
66150

Bitcoin LiquidationBitcoin Liquidation
there is Short & Long Liquidation price on binance
I look about the liquidity prices there is a huge liquidity
Long Liquidation red line's
60700
56900
Short Liquidation long line's
69700
66100

Bitcoin LiquidationBitcoin Liquidation
there is Short & Long Liquidation price on binance
I look about the liquidity prices there is a huge liquidity
Long Liquidation red line's
60700
56250
Short Liquidation long line's
69700
65000

Bitcoin LiquidationBitcoin Liquidation
there is Short & Long Liquidation price on binance
I look about the liquidity prices there is a huge liquidity
Long Liquidation red line's
56100
51550
Short Liquidation long line's
68850
65350

Bitcoin LiquidationBitcoin Liquidation
there is Short & Long Liquidation price on binance
I look about the liquidity prices there is a huge liquidity
Long Liquidation red line's
57800
51350
Short Liquidation long line's
69050
65400
