"Gold’s Next Big Move? The Hidden Entry Zone Smart Money "Gold’s Next Big Move? The Hidden Entry Zone Smart Money is Watching!"
Gold (XAUUSD) is currently consolidating after a series of higher lows, signaling sustained bullish momentum from the strong support region around $3,280–$3,300. Price has respected key structural points, forming a clean market structure with:
BOS (Break of Structure) confirming bullish intent after reclaiming prior resistance.
Bullish FVG (Fair Value Gap) acting as a liquidity zone for potential re-entries.
Multiple Higher Lows, highlighting strong buyer defense levels.
The chart indicates a possible short-term retracement into the $3,350–$3,357 entry zone, which aligns with demand structure. From this zone, buyers are expected to push toward the $3,400–$3,415 resistance target.
Key technical levels:
Entry Zone: $3,350–$3,357 (demand area)
Stop Loss: Below $3,340 to protect against deeper pullbacks
Take Profit: $3,400 psychological level and $3,414 structural resistance
Market Sentiment:
The combination of a strong support base, sustained higher lows, and bullish imbalance zones suggests a favorable risk–reward setup for long positions. A clean breakout above $3,415 could trigger a larger bullish leg toward the $3,440 resistance zone.
📈 Bias: Bullish above $3,350
💡 Watch for a reaction at the entry zone before committing to positions.
Liquidity

SUIUSDT BuyPrice has broken structure to the upside (MSS 4H) after an impulsive rally. Liquidity sits above recent highs, with a bullish order block below as a potential retracement zone. Plan is to wait for price to mitigate the OB at price of 3.5249.

NasdaqAs said before, nasdaq going down, can take out highs then plummet, but time will tell. PS: my previous posts got removed. View auto supply and demand zones indicator. Dm me free for a month free. (It draws snd zones).

USDJPY| Bullish Setup After OB MitigationBias: Bullish
Pair: USDJPY
Higher Timeframe Context (4H & 2H)
• Major 4H high at 149.211 was broken, pushing price to a new high at 150.910.
• Expected pullback has played out, with price mitigating a refined 4H internal structure order flow zone between 146.735 – 145.864.
• This refined order flow zone has historical reaction points from previous weeks, indicating strong demand.
Lower Timeframe Context (30M & 5M)
• On the 30M chart, key high at 148.819 preceded a sell-side liquidity sweep at 148.595.
• Following the sweep, price dropped and mitigated the refined 30M order block between 147.893 – 147.812, showing strong reaction.
• Currently awaiting a 5M lower high break as confirmation for bullish continuation.
Execution Plan
• Standby for a confirmed 5M lower high break and a sweep of minor sell-side liquidity into next week.
• Look for entry after mitigation of the refined OB for a bullish continuation.
• Targets: 5M highs and 30M highs, depending on structure delivery.
Key Levels
• 4H High (broken): 149.211
• New High: 150.910
• 4H Refined Order Flow Zone: 146.735 – 145.864
• 30M High: 148.819
• 30M Liquidity Sweep: 148.595
• 30M Refined OB: 147.893 – 147.812
Summary:
USDJPY remains in bullish structure after breaking major highs and pulling back into strong demand. The higher timeframe structure supports continuation, but execution will wait for lower timeframe confirmation — specifically a 5M lower high break and liquidity sweep into refined demand. Patience here sets up a clean, high-probability long entry into next week.

GBPUSD Bullish Setup - Waiting for Courtyard Sweep Bias: Bullish
Pair: GBPUSD
Higher Timeframe Context (4H)
• Major 4H high at 1.37877 remains intact.
• Key high at 1.34474 was broken with strong bullish momentum.
• Price swept sell-side liquidity at 1.33707, then dropped to mitigate a refined 4H order block between 1.31558 – 1.31405.
• This mitigation sparked a strong bullish reaction, aligning with the overall higher timeframe bias.
Lower Timeframe Context (30M & 5M)
• On the 30M chart, price broke a significant lower high at 1.33138, confirming bullish structure.
• Waiting for market open to deliver a deeper pullback.
• Expecting a courtyard liquidity sweep at 1.32602.
• After liquidity is taken, looking for mitigation into the refined order block zone 1.32452 – 1.32158.
Execution Plan
• Standby until liquidity sweep at 1.32602 is complete.
• Watch for 5M confirmations at the refined order block zone 1.32452 – 1.32158 before entering.
• Targets: 5M structural highs and 30M structural highs.
• Preliminary stop loss consideration: around 1.32158 (subject to adjustment based on price action).
Key Levels
• 4H High: 1.37877
• Broken High: 1.34474
• Liquidity Sweep: 1.33707
• 4H Refined OB: 1.31558 – 1.31405
• Courtyard Liquidity: 1.32602
• Refined Entry Zone: 1.32452 – 1.32158
Summary:
GBPUSD remains firmly bullish after breaking key highs and sweeping liquidity on the higher timeframe. A clean sweep of courtyard liquidity at 1.32602 followed by mitigation into the refined demand zone will set up a high-probability long opportunity. Execution will rely on lower timeframe confirmations, with targets set on both 5M and 30M highs.

XAUUSD (Gold) | Bullish Bias
📌 Higher Time Frame (4H/2H) Context
• Overall bias: Bullish after multiple BOS (break of structure) events.
• Key High: 3,366.287 — price broke above, confirming bullish market structure.
• Liquidity sweep at 3,293.327, followed by mitigation of 4H demand zone (3,264.769 – 3,245.643) with strong bullish momentum.
• This continuation follows last week’s uptrend and BOS at the same 3,366 high.
• Early this week: liquidity sweep at 3,309.301 → refined 4H order block (3,284 – 3,282) tapped, strong bullish reaction.
⸻
⏳ Lower Time Frame (30M/5M) Confirmation
• Price currently reacting off last week’s 4H OB.
• Liquidity level to watch: 3,350.000.
• Looking for a pullback into internal structure OB near 3,349.000 for potential long entry.
• Waiting for lower time frame confirmation (5M/1M) before execution.
⸻
🎯 Execution Plan
• Entry: On confirmed mitigation + bullish LTF structure at 3,349 OB.
• Stop-Loss: Below refined OB low.
• TP1: 5M structural highs.
• TP2: 30M structural highs (adjust depending on delivery).
⸻
🧠 Mindset Note
No chasing — wait for price to pull back and confirm at OB. Let liquidity sweep play out first for optimal RR entry.

EURUSD: Bullish Breakout + Pullback to Order Block
Bias: Bullish
Pair: EURUSD
Higher Timeframe Context (4H)
• Price broke the previous high at 1.14941 with strong bullish momentum.
• Major sell-side liquidity located at 1.14463 has been swept.
• After the liquidity sweep, price mitigated a refined order block zone between 1.13992 – 1.13725.
Lower Timeframe Context (30M & 5M)
• On the 30-minute chart, a major lower high at 1.15892 was broken, confirming bullish structure.
• Sell-side liquidity at 1.15271 on the 30M timeframe has been cleared.
• Expecting price to retrace into the refined order flow area between 1.14379 – 1.13924 for a potential long setup.
Execution Plan
• Wait for price to enter the refined order flow zone.
• Drop down to 5M timeframe for entry confirmation (looking for liquidity sweep and bullish shift in structure).
• Target 5M highs and 30M highs for profit-taking.
Key Levels
• 4H High (broken): 1.14941
• 4H Order Block Zone: 1.13992 – 1.13725
• 30M Liquidity: 1.15271
• Refined Entry Zone: 1.14379 – 1.13924
Summary:
Market structure is bullish across the higher timeframes. After the liquidity sweeps and order block mitigations, a retracement into the refined demand zone is expected, providing a favorable setup to join the continuation higher towards 5M and 30M timeframe highs.

NASDAQ-100| Bullish Bias📌 Higher Time Frame (4H/2H) Context
• Market remains bullish, currently in push phase toward 4H highs.
• No sweep or mitigation at the previous 4H order block — price pushed higher with strong momentum.
• 4H Demand Zone: 22,576 – 22,376
• Liquidity at 22,955 cleared → room for continuation to higher targets.
⸻
⏳ Lower Time Frame (30M/5M) Confirmation
• 30M structure refined, bullish order flow intact.
• Current liquidity resting near 23,400.
• Watching 30M OB: 23,322 – 23,222 for a pullback, liquidity sweep & inducement.
⸻
🎯 Execution Plan
• Entry Zone: 23,321 – 23,221 (refined OB)
• Stop-Loss: 23,225
• TP1: 5M + 30M structural highs
• 30M Structural High Target: 23,714
⸻
🧠 Mindset Note
Patience is key — wait for price to pull back into the OB zone and give lower time frame confirmation. No chasing. Let liquidity sweep first, then execute.

This is it - Bitcoin weekly update August 11 - 17thFrom an Elliott Wave perspective, Bitcoin is currently unfolding a Cycle degree Wave C, which at the Primary degree is forming Wave A. At both the Intermediate and Minor degrees, price is also in Wave A. The minimum downside target for this structure lies at the 1.0 Fibonacci extension near $112K. Additional targets include the 1.236 extension at roughly $110K and the 1.618 extension near $106K.
Liquidity mapping reveals notable clusters at key levels. The $115.5K zone, highlighted by the red box on the chart, contains significant liquidity according to the heatmap. Additionally, order book data shows heavy bid accumulation around the $110K level — an area that also coincides with a daily Fair Value Gap (FVG). The Point of Control (POC) from the previous wave lies just below the red box, further reinforcing the bearish confluence.
From a derivatives standpoint, the recent impulsive rally in Wave b appears to have been largely driven by leveraged positions. Funding rates have started to decline from high positive levels, while open interest — after a brief surge — is now dropping, suggesting traders are unwinding positions rather than adding fresh exposure.
Spot ETF flows continue to show net inflows, but closer inspection reveals that these have been more FOMO-driven than strategic accumulation. Outflows were recorded at the local low of Wave a, while inflows spiked during the impulsive rise of Wave b — behaviour that often reverses as the market corrects. This increases the likelihood of inflows slowing or reversing during the expected downward leg.
The primary scenario anticipates that Bitcoin will continue lower. At the Primary degree, Wave A could terminate within the red liquidity box, where the liquidity cluster might act as a temporary buy wall. This could then lead to a corrective Wave B before a final Wave C to complete the larger structure. However, making precise forecasts beyond Wave A would be speculative at this stage.

GJ: Courtyard Sweep Into Bullish ContinuationBias: Bullish
Pair: GBPJPY
Higher Timeframe Context (4H & 2H)
• Significant 4H high at 196.846 was broken, confirming bullish intent and momentum.
• Price had been ranging between 196.784 – 199.975 before breaking sell-side liquidity at 196.797.
• This liquidity sweep led to mitigation of a refined 30M order block between 195.405 – 195.349, sparking strong bullish momentum.
• Note: Unmitigated 4H order block exists between 194.816 – 194.022, but current focus is on capturing the bullish continuation in play.
Lower Timeframe Context (30M & 5M)
• After the 30M order block mitigation, price breached and broke the major lower high, shifting bias fully bullish.
• Now in execution mode, awaiting price to reach refined order block at 197.631 – 197.391.
• A courtyard liquidity sweep at 197.682 will act as the trigger for entry.
Execution Plan
• Enter after liquidity sweep at 197.682 and mitigation of the refined OB at 197.631 – 197.391.
• First TP: 198.842 (5M highs).
• Second TP: 199.979 (30M structural highs).
• Hold toward TP2 depending on price delivery and momentum.
Key Levels
• Broken High: 196.846
• Range: 196.784 – 199.975
• Sell-Side Liquidity: 196.797
• 30M Refined OB: 195.405 – 195.349
• Entry OB: 197.631 – 197.391
• Courtyard Liquidity: 197.682
• TP1: 198.842
• TP2: 199.979
Summary:
GBPJPY shifted from analysis to execution mode after breaking a major lower high and mitigating a refined 30M order block. Price is now approaching a key courtyard liquidity level, which, once swept, sets up a clean long entry toward TP1 and TP2. With bullish structure across the board, the plan is to ride momentum into the highs while managing execution on the lower timeframes.

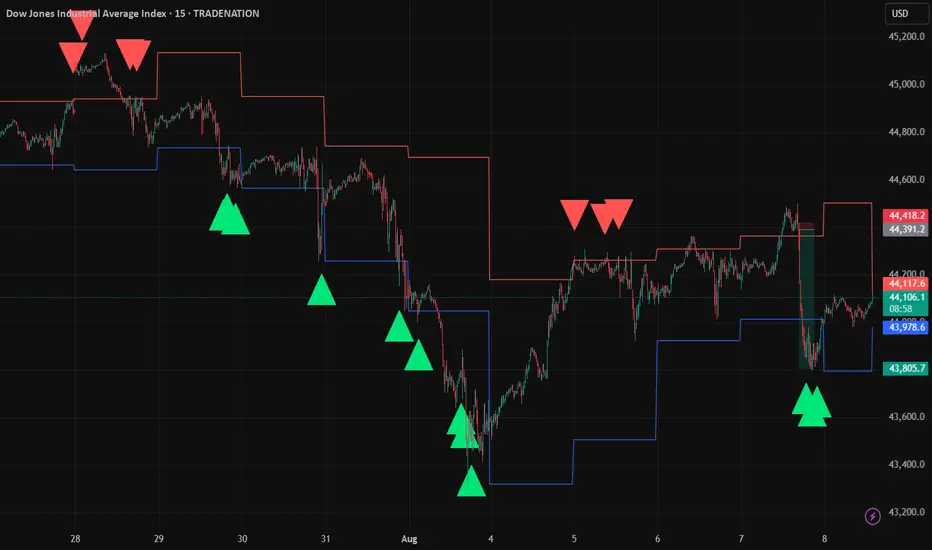
US30 Liquidity Grab Strategy – 15m Chart (1m Precision Entries)Description:
This idea showcases my Liquidity Grab Entry Signals strategy, optimized for US30.
The setup identifies daily high/low liquidity zones with a sensitivity buffer, then confirms reversals using strong engulfing candles.
Key Points:
Daily Liquidity Levels plotted automatically.
Buffer Zone detects price interaction with liquidity.
Engulfing Confirmation for higher probability entries.
Long when price rejects daily low with bullish engulfing.
Short when price rejects daily high with bearish engulfing.
While the precision entries are taken on the 1-minute chart, this 15-minute chart is shown for publication purposes in line with TradingView rules.
Example (Yesterday & Today):
Multiple clean rejections at daily liquidity zones.
Clear 1:15–1:20 R:R potential with minimal drawdown.
Risk Management:
Suggested SL: 10–15 points beyond liquidity zone.
Suggested TP: the next key level.
Precise 1 min entry shown here:
GJ|- Bullish Momentum Setup for Next Week4H – From the top-down, price has been respecting structure and just broke major highs with strong momentum to the upside.
30M – Price pulled back into structure, refined to the cleanest level. Before that, we had the professional sweep I mentioned in my last GJ post.
5M – I’m watching for a sweep of SSL into my refined zone before taking an entry. Once that happens, I’ll look for bullish follow-through.
Buy Zone: 196.264
SL: 195.925
Bias: Bullish continuation into next week — pending liquidity sweep confirmation.

XAUUSD Bearish SMC Analysis – Institutional RejectionXAUUSD Bearish SMC Analysis – Institutional Rejection from Supply Zone
Gold (XAUUSD) is showing a clear bearish structure after rejecting a major supply zone at premium pricing. This setup is aligned with Smart Money Concepts (SMC) and reflects how institutions manipulate liquidity and order flow before major price moves.
🔍 Market Structure Context:
The market had been trending upward with higher highs and higher lows, until it approached a key premium supply zone near $3,420.
At this level, price stalled, creating internal Equal Highs (liquidity) — a common trap used by institutions to grab orders before reversing.
🔄 Change of Character (CHoCH):
A clear CHoCH was printed when price broke below the most recent higher low, signaling a shift from bullish to bearish structure.
This change marked the first early signal that institutional order flow has flipped bearish, and distribution is underway.
📉 Break of Structure (BOS):
Following the CHoCH, the market confirmed intent with a clean BOS to the downside.
This structural break confirms bearish control and validates short bias.
🧲 Liquidity Engineering:
Equal Highs were swept at the top, indicating a liquidity grab before institutions drove price downward.
This move traps breakout buyers and provides large players with sell-side execution at premium pricing.
🧱 Fair Value Gap (FVG) & Supply Zone Mitigation:
After BOS, price retraced into a Bearish Fair Value Gap (FVG) and the origin of the supply zone, offering a high-probability entry.
The rejection from this zone showed imbalance was respected and no bullish continuation existed — further validating the short setup.
🔍 Confluences for the Bearish Bias:
Confluence Confirmation
CHoCH Structure flipped bearish
BOS Bearish continuation confirmed
Liquidity Sweep Equal highs taken
FVG Retest Smart Money re-entry signal
Supply Zone Mitigation Institutional reaction confirmed
📘 Educational Summary:
This setup exemplifies a complete Smart Money bearish reversal model:
Premium pricing ✅
Liquidity taken ✅
Structure flipped (CHoCH + BOS) ✅
Supply & FVG respected ✅
It reflects how institutions build positions quietly, using engineered liquidity to trap retail traders, and then drive price with high-volume imbalance moves.

"BTCUSD Technical Outlook: Support Holds, Bulls Aim for $117K""BTCUSD Technical Outlook: Support Holds, Bulls Aim for $117K"
Market Structure Overview
BOS (Break of Structure): Multiple BOS points indicate strong shifts in market direction, confirming both bullish and bearish trends across different zones.
Bearish Fair Value Gap (FVG): This zone, marked after a BOS on July 23–24, acted as a rejection area, initiating a sharp sell-off — a classic bearish imbalance fill and reversal.
Equal Lows & Sell-side Liquidity: This area attracted liquidity grabs, as smart money hunts resting stop losses below these equal lows before reversing direction.
🔸 Key Supply & Demand Zones
Previous Resistance Zone (~118,000 - 120,000): Price rejected this area after filling the imbalance, confirming it as a strong supply zone.
Support Zone (~112,000 - 113,000): Currently acting as a high-probability demand zone. Liquidity accumulation here suggests a possible bullish reversal.
📉 Liquidity Zones
Sell-side Liquidity Sweep: Price dipped below equal lows to collect liquidity, often a signal of institutional accumulation.
Liquidity/Fair Value Zone (~116,000): Acts as a magnet for price, offering potential retracement targets before any major trend continuation.
📈 Forecast & Target
Current Price: $114,061
Short-term Target: $117,546 — aligning with previous FVG imbalance and liquidity zone.
Bias: Bullish Reversal expected from support zone toward the previous inefficiency and resistance levels.
🎓 Educational Takeaways
BOS Confirmation is critical in validating trend shifts and structure breaks.
FVGs (Fair Value Gaps) highlight inefficiencies and offer high-probability reversal or continuation zones.
Liquidity Sweeps near equal lows/highs often precede smart money moves — useful for spotting entries and exits.
Volume Profile (left side) suggests higher activity zones — these areas often align with major turning points.
✅ Conclusion
BTCUSD has swept liquidity below support and is showing signs of reversal. If the bullish pressure holds above $113,000, a move toward the $117,500 zone is likely, targeting previously unfilled imbalance and trapped liquidity.

EURUSD Bearish Market Structure Unfolding – Liquidity Grab BelowEURUSD Bearish Market Structure Unfolding – Liquidity Grab Below Support Expected"
🔍 Technical Analysis Breakdown:
🔺 Resistance Zone (1.17500 - 1.18500)
Labelled “Strong High”, this is a high-supply zone where price previously reversed.
Multiple Break of Structure (BOS) and Change of Character (CHoCH) confirm this as a strong bearish supply area.
Any retracement toward this level could be ideal for short entries.
🟩 Fair Value Gap (FVG)
This imbalance area previously served as a magnet for price before it broke down.
Price failed to hold inside the FVG, reinforcing bearish sentiment.
🔻 Support Zone (1.13500 - 1.14000)
Marked as a "Weak Low", suggesting this level is likely to be taken out in a liquidity sweep.
Price is expected to retest and potentially break below this zone in the near term.
📉 Current Price Action
Recent CHoCH (Bearish) confirms shift in structure.
Price has made a corrective pullback and seems poised for another leg down.
Highlighted grey zone suggests price may retrace slightly higher before continuing its bearish move.
🎯 Bias: Bearish
Expecting downside continuation toward 1.13500 support, targeting liquidity below.
Traders may wait for rejection signals on lower timeframes around the minor pullback zone before executing shorts.
📚 Educational Notes:
CHoCH indicates a shift in market sentiment (from bullish to bearish).
FVG often acts as a magnet but if not respected, confirms momentum in the opposite direction.
Support/Resistance zones are used to determine institutional activity zones.

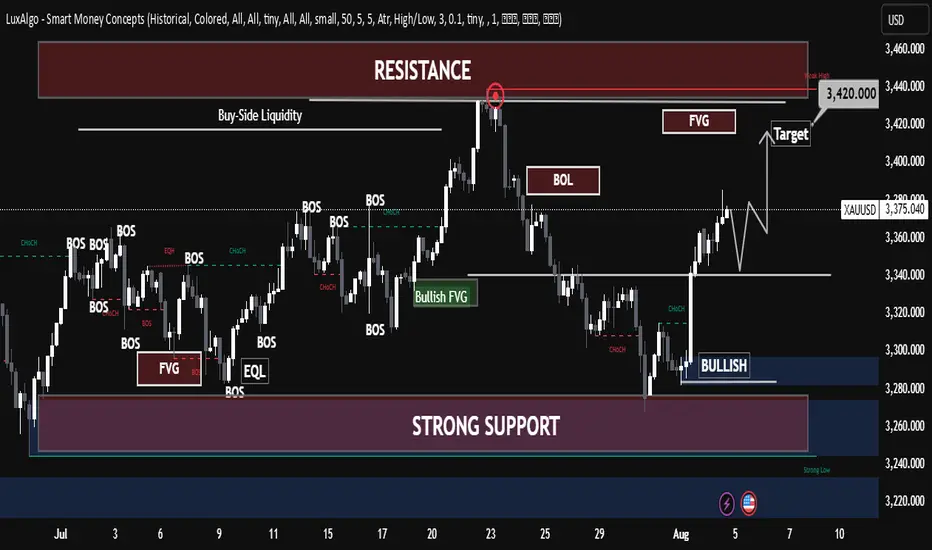
XAUUSD Chart Analysis – Smart Money Concepts (SMC) Based🔍 XAUUSD Chart Analysis – Smart Money Concepts (SMC) Based
1. Market Structure Overview:
The chart clearly shows a bullish market structure forming after a sequence of Breaks of Structure (BOS) and Change of Character (CHoCH) events.
The market has consistently made Higher Lows, indicating strength from the bulls and institutional order flow to the upside.
2. Key Zones Identified:
✅ Strong Support Zone (Demand Area):
Around $3,260–$3,280, this level has been respected multiple times.
It is marked with BOS, CHoCH, and a Bullish Fair Value Gap (FVG) indicating institutional accumulation and unfilled orders.
The area also contains a Weak Low, which gives price a reason to stay above if bullish sentiment continues.
❌ Strong Resistance Zone (Supply Area):
Around $3,420–$3,460, this area shows signs of Level Rejection and is labeled with Buy-Side Liquidity.
This is where price previously reversed after grabbing liquidity—indicating distribution and possible shorting interest from smart money.
3. Liquidity Zones:
Buy-Side Liquidity: Above recent swing highs near $3,420–$3,440. Price tapped this level and sharply rejected.
Sell-Side Liquidity (Target Area): Currently aiming for the zone around $3,350, which aligns with a recent imbalance (FVG) and a clean liquidity pool below short-term higher lows.
4. Fair Value Gaps (FVGs):
A Bullish FVG is seen mid-chart, where price was rapidly driven up, leaving a gap—price later returned to this zone, respected it, and pushed higher again.
This is a strong sign of institutional entry and provides excellent long entries.
5. Trend Confirmation:
BOS + CHoCH + Higher Lows = Bullish Bias.
Each low is forming higher than the previous, with strong rejections from demand zones.
6. Entry & Target Insight:
Entry Point: After price reacted from support and printed another Higher Low.
Target: Currently price is targeting $3,350 (short-term retracement or pullback target).
This target is likely an internal liquidity sweep before potential continuation to retest the resistance zone again.
7. Educational Takeaways:
Market Structure is King: Observe BOS/CHoCH for directional bias.
Liquidity Matters: Understand where liquidity is resting—price seeks it.
FVG as Entry Tool: Fair Value Gaps provide high-probability trade setups when aligned with structure.
Patience at Key Zones: Wait for confirmations at resistance/support rather than impulsive trades.
✅ Summary:
Bias: Bullish, until structure breaks.
Short-Term Target: $3,350 (as per the chart).
Long-Term View: If price maintains higher lows, potential revisit to the resistance zone ($3,420–$3,460) is likely.
Invalidation Level: Break and close below strong support ($3,260) would shift bias.

GBPCADDate:
August 7, 2025
Session:
Tokyo Session
Pair:
GBPCAD
Bias:
Short
Targeting liquid from last Friday and Wednesday
Entry:1.83562
Stop Loss:1.83882
Target:1.82453
RR:3.51

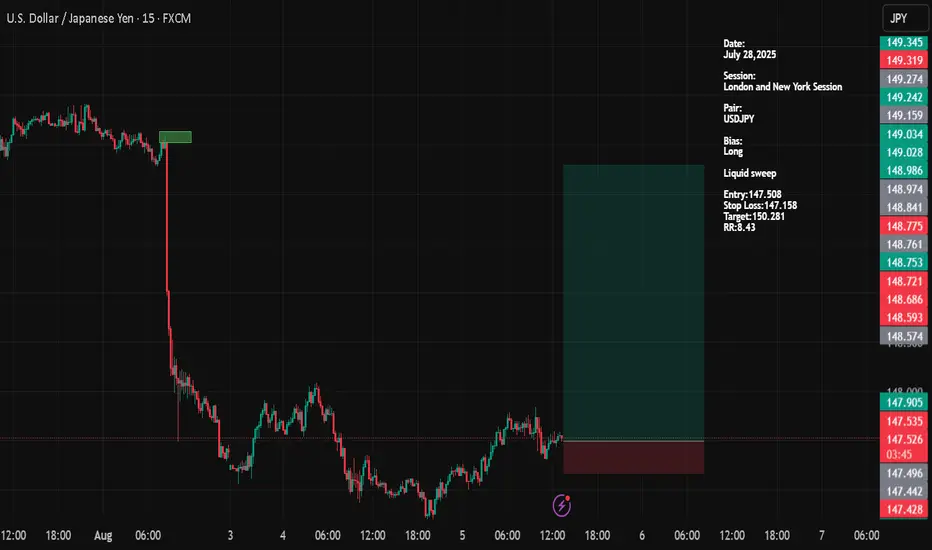
USDJPYDate:
August 05,2025
Session:
New York Session
Pair:
USDJPY
Bias:
Long
Liquid sweep
Entry:147.508
Stop Loss:147.158
Target:150.281
RR:8.43
"Gold on Fire! Smart Money Bulls Aiming for Final Target🟡 "Gold on Fire! Smart Money Bulls Aiming for Final Target
Overview:
The XAUUSD chart presents a clear smart money structure, showing a bullish recovery from a strong demand zone and a current move toward a significant supply (resistance) area.
🔍 Key Technical Highlights:
Strong Support Zone
The price reacted powerfully from the well-marked strong support zone (~3,260), aligned with a previous Bullish Fair Value Gap (FVG) and BOS (Break of Structure), confirming bullish intent.
Bullish Market Structure
A clean CHoCH (Change of Character) confirmed the end of the previous bearish leg.
Multiple BOS followed, solidifying the bullish shift in momentum.
Liquidity Grab & Price Expansion
Price swept equal lows (EQL) and mitigated bullish FVG, collecting sell-side liquidity before reversing.
The breakout pushed toward the current level of ~3,380, targeting the Buy-Side Liquidity zone and resistance.
Resistance & Fair Value Gap
The final target is aligned at 3,427.83, situated inside a high-probability bearish FVG and resistance zone.
This area previously rejected price (noted with the red circle), making it a critical supply zone.
Partial Target Hit
Price has already achieved half of the projected move, indicating bullish strength and proper SMC execution.
The current consolidation near the mid-level suggests accumulation or re-accumulation before a final push toward the target.
📈 Educational Notes:
Fair Value Gaps (FVG) highlight inefficiencies in price delivery. These zones often act as magnets for price and reversal points, as seen here.
Break of Structure (BOS) and Change of Character (CHoCH) are crucial for identifying trend shifts. This chart reflects a textbook bullish transition.
Liquidity concepts (EQL, Buy-Side) emphasize institutional behavior. Price often hunts liquidity before moving to new highs or lows.
✅ Conclusion:
XAUUSD is playing out a well-structured bullish smart money setup, with price currently in mid-path toward the final target. Traders should monitor reactions at the 3,427 resistance zone, which will be critical for potential reversal or continuation scenarios.

Technical Breakdown (Smart Money Concepts-Based)📊 Technical Breakdown (Smart Money Concepts-Based):
🔹 Market Structure:
Multiple Break of Structure (BOS) signals show a bullish shift in momentum, especially after the recent CHoCH followed by BOS at the current price zone.
Strong bullish confirmation after reclaiming previous liquidity zones, indicating institutional interest.
🔹 Liquidity and Zones:
Buy-Side Liquidity above $3,420 is likely the short-term institutional target.
Price has clearly reacted from a strong support block near the $3,260–$3,280 area, confirming demand and institutional accumulation.
The highlighted Bullish FVG (Fair Value Gap) aligns with a mid-level retracement zone—ideal for potential pullbacks before continuation.
🔹 Key Supply & Demand:
Resistance Zone (3,420–3,450): Contains weak highs and unmitigated FVG—prime liquidity zone for a sweep.
Strong Demand Zone: Around $3,260 has shown repeated reaction; the base of bullish moves.
Imbalance Fill & Rejection Expected in FVG near $3,420.
🔮 Projection & Scenario:
Expected pullback toward $3,340–$3,350, followed by bullish continuation.
Targeting liquidity sweep at $3,420, aligned with Smart Money accumulation and distribution logic.
Monitor for reaction at $3,420 for either a rejection or a clean breakout, confirming further upside.
✅ Conclusion:
This setup suggests institutional buy-side pressure with targets on resting liquidity around $3,420. Smart Money is likely driving price toward that level to grab orders before the next big move.
BTCUSD Technical Analysis – Smart Money Concept Based
🔍 BTCUSD Technical Analysis – Smart Money Concept Based
🕒 Timeframe: Intraday (likely 1H or 4H)
📅 Date: August 5, 2025
📉 Price: ~114,445 USD
📌 Key Zones and Observations
🔴 Previous Resistance (117,000–119,000)
This area has a strong high formed after multiple equal highs (EQH), indicating a liquidity pool above.
Price sharply rejected this zone, validating it as a significant supply zone.
🔵 Support Zone & Liquidity Pool (~112,600–113,200)
This is a high-volume node (visible on VRVP) where price consolidated previously.
Market structure suggests liquidity resting below, as indicated by the marked “Target” area at 112,648.
Smart Money may aim to sweep liquidity below this support zone before any meaningful reversal.
🟤 Order Block & Rejection at 115,210–116,065
Price tapped into a bearish order block, creating a minor change of character (ChoCH) and then started to decline.
Rejection from this zone signals distribution by institutions or Smart Money, leading toward bearish continuation.
🟢 Value Gap and Imbalance (Above 115,000)
A visible value gap still remains unfilled; however, current momentum is bearish, and price failed to reclaim it, hinting downside continuation.
🔄 Market Structure
BOS (Break of Structure) to the upside confirmed short-term bullish momentum.
CHoCH back to the downside near current price reflects bearish shift in order flow.
Price is respecting lower highs, and failing to break above 115,210 confirms a bearish bias.
🎯 Target and Outlook
Primary Bearish Target: 112,648 USD
This is a liquidity pool and previous support area where institutions may look to rebalance and accumulate.
Scenario:
If price retests 115,000–115,210 again and fails, expect strong continuation downward toward the 112,648 target.
If price breaks and holds above 116,065, bullish invalidation may occur, and we can look for higher retracement toward 117,000–119,000.
✅ Conclusion
BTCUSD is currently respecting a bearish order block, with Smart Money likely targeting liquidity resting below at 112,648 USD. Unless price breaks above 116,065 with strong volume, the bias remains bearish short-term.

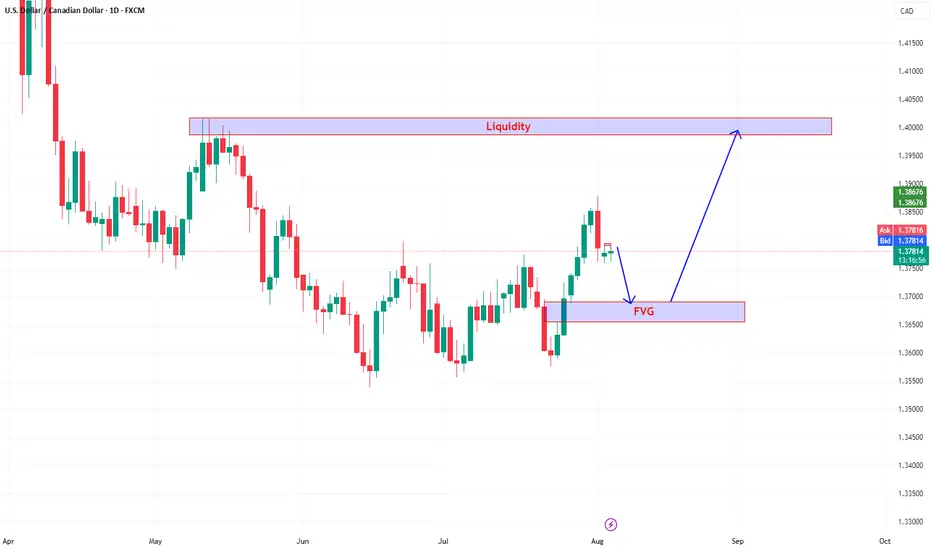
USDCAD is forming a bullish structure.We can a clear bullish structure forming after a series of higher highs and higher lows, indicating bullish momentum building. Recently, price rejected from a key swing high and appears to be pulling back. This pullback is targeting a Fair Value Gap (FVG) marked in the blue zone then bounce from the FVG zone back toward the overhead Liquidity Zone.
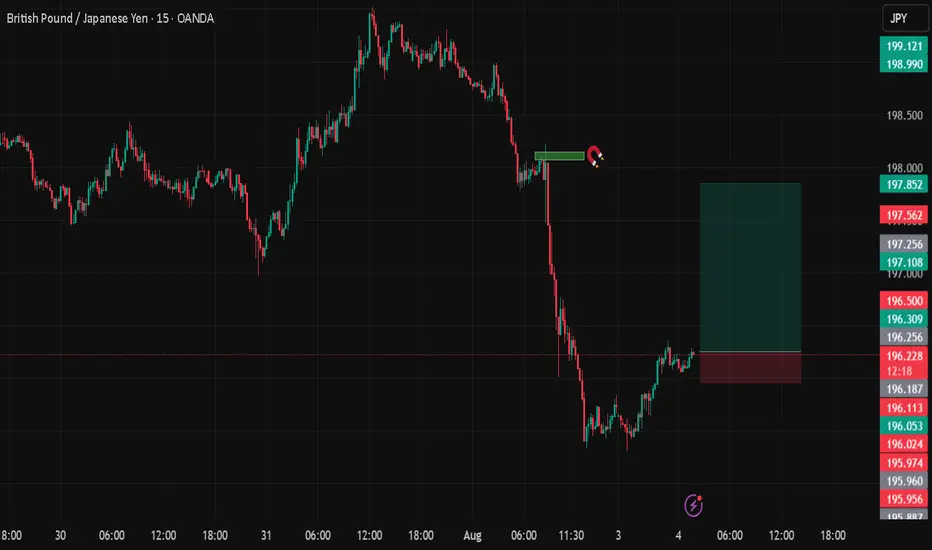
GBPJPYDate:
August 3,2025
Session:
Tokyo Session
Pair:
GBPJPY
Bias:
Long
Fridays New York open left a liquidity pool. I see todays Asia or London session sweeping that area.
Entry:196.254
Stop Loss:195.957
Target:197.847
RR:5.32