#XAUUSD 1H ANALYSISXAUUSD 1H Supply & Demand Analysis
In this analysis we're focusing on 1H time frame, for finding upcoming movement and changes in Gold prices. Price action shows a clear bearish structure following a strong upside move that was met with resistance near the 3370–3380 supply zone. After two Breaks of Structure (BOS), price is retracing toward a premium level where supply is expected to be reactivated.
Marked areas:
🔴 Supply Zone: 3370–3380 (potential short-entry zone)
🔵 Demand Zone: 3260–3290 (reversal or TP zone)
Target 1: 3315
Target 2: 3305
Target 3: 3292
This setup suggests an ideal Sell from Supply once price reacts and confirms bearish intent with internal structure shifts. Patience is key wait for price to tap the zone and show signs of weakness before entering. Confirmation is very important.
Always use stoploss for your trade.
Always use proper money management and proper risk to reward ratio.
This is just my analysis not financial advice.
#GOLD 1H Technical Analysis Expected Move.
Liquidity

EURUSD - Bullish Shift after IFVG? This chart outlines a clean sequence of bullish intent where institutional accumulation is visible through structure, inefficiency, and reactive zones.
---
1. Support Zone Holds — Demand Confirmed
The previous resistance area has now clearly flipped into support , marked by multiple wicks rejecting lower prices.
- This region is a high-probability demand zone engineered through earlier consolidation.
- Price returned to this level, swept minor liquidity, and immediately bounced—confirmation that demand is active.
---
2. Fair Value Gap (FVG) — The Imbalance Magnet
A clean FVG sits above price, created during the prior bearish leg. Now acting as a rebalancing zone.
- Price is pushing into this inefficiency after finding support.
- The gap inversion (price reclaiming and holding above the FVG) would validate bullish continuation.
- Think of this as the mid-point between structure and expansion.
---
3. BSL Above — The Next Liquidity Target
A key Buy Side Liquidity (BSL) level is marked higher, acting as the next logical draw for price.
- Smart money seeks liquidity above recent swing highs.
- If price holds above the FVG, this BSL becomes the magnet for bullish expansion .
---
4. Projected Price Action Flow
The roadmap is clear and logical:
- Step 1: Bounce from support (done)
- Step 2: Push through and hold the FVG
- Step 3: Expand higher toward BSL
Each leg has purpose, and the structure confirms smart money is in accumulation mode.
---
5. Summary:
- Support + FVG + BSL = Structured Bullish Thesis
- As long as price stays above the FVG post-inversion, buyers have control.
- This is a textbook case of price engineering via inefficiency and reactive structure.

Bullish BiasPrice broke above the minor resistance at ~189.50 and appears to pull back to OB for a bullish continuation toward the next significant resistance zone (~195).

FIL RectangleBINANCE:FILUSDT has been trading in a rectangle since August 2022. It recently below the demand zone, swept liquidity to $2 and regained support.
Key Levels to Watch
• $2.4-$3.0: Support and multi-year demand zone, recently tested and regained.
• $10.5-$11.8: Resistance and multi-year supply zone.
Measured Rectangle Targets
• Breakout: $20.0, also a support dating back to December 2020.
• Breakdown: $0.5
Filecoin is still lagging behind other alts, but, if you're looking for something you don't need to chase, it could already offer a nice long entry, with interesting R/R and a clear invalidation (lower low below $2.0).

Ultimate Guide to Liquidity Sweeps: Trading Smart Money MovesIn the world of Crypto and other financial markets, liquidity sweeps are deliberate price moves designed to capture liquidity sitting above or below key price levels. These moves are not random, they are orchestrated by large players who need to fill significant orders efficiently. By pushing price into zones where stop-losses and pending orders accumulate, these entities access the liquidity required to open large positions without causing excessive slippage.
Liquidity sweeps offer sharp insights into market structure and intent. Understanding how they work and recognizing them in real-time can significantly enhance a trader’s edge, especially in environments dominated by algorithmic and smart money behavior.
Defining the Liquidity Sweep
A liquidity sweep is characterized by a quick push through a well-defined support or resistance level, typically a recent high or low, followed by a swift reversal. These zones are hotspots for stop orders placed by retail traders, such as long stop-losses placed under swing lows or short stops above recent highs. When these stops are triggered, they act as liquidity pools.
Large players anticipate these zones and use them to enter positions. The sweep creates an illusion of breakout or breakdown, luring reactive traders in, only for the price to reverse direction once the necessary liquidity is absorbed. This mechanism reveals the strategic manipulation often present in efficient markets.
Structure and Behavior of a Sweep
The process typically starts with the market forming a recognizable range, often between a defined high and low. Price then consolidates or slowly trends toward one edge of the range, building tension. As the market reaches that boundary, a sudden surge beyond the level occurs, this is the sweep. Importantly, price does not sustain above or below the level. Instead, it quickly retraces, printing a rejection wick or reversal pattern.
Following the reversal, the market often resumes its original trend or begins a new leg in the opposite direction of the sweep. For traders, this offers a clear point of entry and invalidation, allowing for precise trade setups.
Bullish Scenario, Sweep of Lows
When Bitcoin approaches a prior low, especially one that marked a swing point or a support level, many traders place their stop-losses just below that low. This creates a pocket of sell-side liquidity.
In a bullish liquidity sweep, price will spike below this prior low, often triggered by a news event, a large market order, or a sudden increase in volatility. The market will quickly wick below the level, triggering stop-losses and perhaps inviting new short positions. However, instead of continuing lower, price snaps back above the broken level and begins to climb.
This reversal indicates that large players were absorbing liquidity at the lows and are now positioned long. Traders can look for bullish confirmation via engulfing candles, reclaim of the low, or a fast return into the previous range.
Bearish Scenario, Sweep of Highs
Conversely, when Bitcoin grinds higher toward a prior swing high or resistance level, traders anticipating a breakout may enter early, while others have stop-losses on short positions resting above the level.
A bearish liquidity sweep occurs when price spikes above the prior high, triggering those buy stops and breakout entries. Almost immediately, the market reverses, showing rejection at the highs. This action signals that buy-side liquidity has been used by larger players to enter short positions.
Once price fails to hold above the breakout level and begins to drop, the sweep is confirmed. Traders aligned with this read may look for bearish structure to form, such as a lower high, and enter short with a defined invalidation above the sweep.
Common Pitfalls and Misinterpretations
One of the most frequent mistakes traders make is confusing a sweep for a breakout. Liquidity sweeps are often mistaken for the beginning of a new trend leg, leading to premature entries that quickly get reversed.
Another pitfall is ignoring the broader market context. Liquidity sweeps are most reliable when they occur at logical levels aligned with higher time frame bias. Without that alignment, the sweep may simply be part of a choppy, indecisive range.
Lack of confirmation is also an issue. Entering trades immediately after a wick without seeing structure reclaim, volume shift, or candle confirmation can lead to unnecessary losses.
Confirming a Valid Sweep
To increase confidence in a sweep setup, traders should watch for several confirming behaviors. Volume often spikes during the sweep itself, followed by a drop in volatility as the market reverses. Divergences on momentum indicators like RSI or OBV can also support the idea of an exhausted move.
Most importantly, the reaction after the sweep matters more than the sweep itself. If price fails to reclaim the swept level or continues trending, the move was likely a true breakout, not a manipulation.
In high-probability sweeps, price often reclaims the level and begins forming structure in the opposite direction. Watching for breaker blocks, fair value gaps, or inefficiencies being respected in this phase can also strengthen the case for entry.
Conclusion
Liquidity sweeps are one of the clearest footprints left behind by smart money. While they can be deceptive in the moment, with enough practice and context awareness, they become one of the most powerful tools in a trader’s arsenal.
The key lies in understanding that these moves are engineered, not accidental. Recognizing where the market is likely hunting liquidity, and how it behaves after collecting it, can dramatically improve your ability to enter trades with precision, confidence, and clear invalidation.
__________________________________________
Thanks for your support!
If you found this guide helpful or learned something new, drop a like 👍 and leave a comment, I’d love to hear your thoughts! 🚀
Make sure to follow me for more price action insights, free indicators, and trading strategies. Let’s grow and trade smarter together! 📈

$RBN | Showing glimpses of lifeAdded to my Altcoin Portfolio:
• COINBASE:RBNUSD @ $0.13876 bringing my average cost from $0.17 -> $0.1511
Notes/Thoughts: Typically I would wait until the Weekly Close for my buys as it’s only Tuesday but I like the market pump currently & perceived momentum plus price is still held in a Weekly Demand area without collapse.

EURNZD LongMy Bais is taking a long around 1.84-1.83 price range after the liquidity has been taken out around 1.88-1.87. Long-term opportunity


GOLD 30M ANALYSISIn this analysis we're focusing on 30m time frame for GOLD. To identify the best buying area and POI for our buy trade setup. In this chart price is creating trendline support and also price break it's previous high. So overall market trend was bullish. According to the market trend my Bias was also bullish. Let's see when price retest and come to our entry zone. Once price comes observe the behavior of price and if price give any bullish confirmation then we'll execute our trade. Let's delve deeper into these levels and potential outcomes.
Always use stoploss for your trade.
Always use proper money management and proper risk to reward ratio.
This is just my analysis.
#XAUUSD 30M Technical Analysis Expected Move.

EURUSD ANALYSISEUR/USD – 2H Bullish Continuation Play
Following a sharp breakout, EUR/USD is gracefully pulling back toward the 1.1095–1.1149 demand zone, now acting as support. This zone holds significance as a potential launchpad for the next bullish wave.
A higher low formation here could ignite continuation toward 1.1471, with extended upside into 1.1605, presenting a clean and favorable risk-to-reward opportunity.
The structure is clear, the momentum is aligned, and the setup reflects a well-composed bullish scenario ideal for patient and precise execution.
▫️ Impulsive breakout
▫️ Retracement to demand zone (1.1095–1.1149)
▫️ Looking for higher low → continuation
🎯 TP1: 1.1471
🎯 TP2: 1.1605
🛡️ Clean R:R, perfect for trend followers.
#EURUSD 2H Technical Analysis Expected Move.

GOLD TODAY OUTLOOKXAU/USD – 30-Minute Technical Setup
Gold has been gliding upward, respecting a clean ascending structure, printing higher highs with strength. But as price taps into the $3,242–$3,267 supply zone, momentum begins to fade.
A potential rejection here signals a structural shift. If the trendline breaks, we could see a clean move down toward the $3,176 demand zone, with $3,203 acting as soft interim support.
This setup reflects precision and patience , anticipating a transition from bullish strength to calculated bearish correction, with a balanced risk-to-reward approach.
Confirmation is very important.
Always use stoploss for your trade.
Always use proper money management and proper risk to reward ratio.
This is just my analysis.
#XAUUSD 30M Technical Analysis Expected Move.

BTC short term Wave countAnalyzing a Bitcoin (BTC) form Wyckoff schema in a 4H chart.
We can’t determine if it’s an accumulation or distribution yet. Based on MACD and Elliott Wave Theory, I believe the chart will follow a similar pattern. However, time will determine the outcome. If BTC declines and accumulates within a shorter time frame of Elliot support levels, it could be a long trade opportunity.
(This analysis is not financial advice. Your actions are solely your responsibility.)

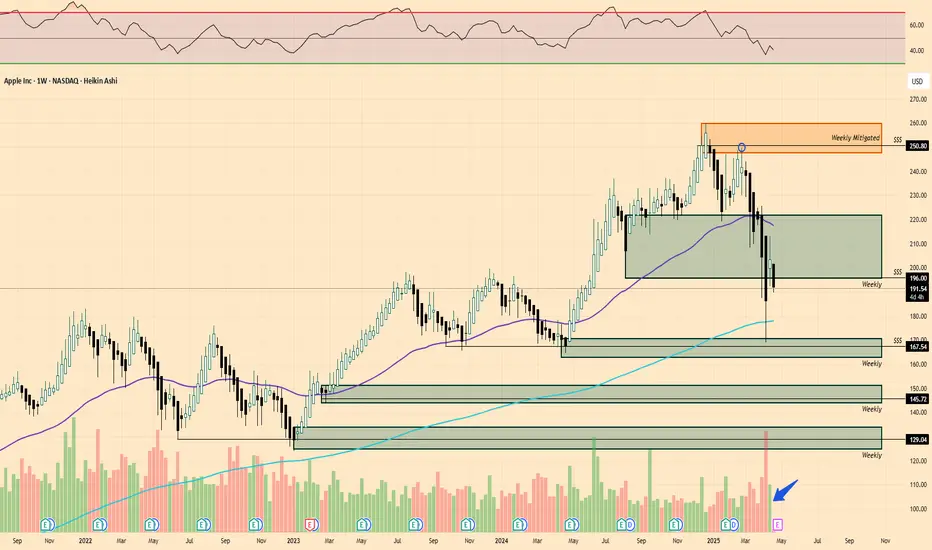
$AAPL | $200 showed lifeThese are my levels I am most concerned with for NASDAQ:AAPL
Last week, $200 level showed life and buyers stepped in but that doesn't mean we are out of the woods and price currently is in semi "no man's land", kind of just hanging around the demand area.
One bright point is bullish price volume last week as well.
I would wait to see how this week turns out before putting money back into the iPhone company.
BTC - The power of fibonacci This is a textbook example of how institutional price delivery often unfolds when targeting liquidity and rebalancing inefficiencies. The current BTC 1H chart displays a high-probability short scenario developing after a liquidity sweep, combined with entry into a fair value gap (FVG) chain and Fibonacci-based premium pricing. Let’s break down the mechanics of this setup layer by layer.
---
1. Liquidity Grab Above Buy-Side Liquidity (BSL)
The first major clue that institutional activity is at play is the clean sweep of Buy-Side Liquidity (BSL) .
- A previous swing high acted as a magnet for liquidity, with stop-loss orders from short sellers and breakout entries from late longs accumulating above this level.
- Price pierced above it, only to immediately reverse—this is what we refer to as a liquidity grab , signaling engineered movement designed to fuel larger orders.
- This behavior often represents the conclusion of a bullish leg and the transition into a distribution phase or a bearish delivery sequence.
This sweep is not random; it's a deliberate market manipulation mechanism—classic of a “trap and reverse” pattern.
---
2. Fair Value Gap (FVG) Chain: Imbalance as a Magnet
After rejecting above the BSL, price began retracing downward, but left behind multiple Fair Value Gaps (FVGs) . These are inefficiencies between price candles where institutional orders did not fully fill.
- These FVGs now form what we call a “chain” or cluster, providing a roadmap for price to return and rebalance.
- The current move upward is revisiting this chain of inefficiencies, offering a potential re-entry zone for institutions to offload positions accumulated earlier.
- FVGs in premium zones (above equilibrium) are particularly potent—they align with institutional interest to sell at value.
This aligns with the concept that price often returns to inefficiencies before continuing its true direction—especially when paired with a prior liquidity grab.
---
3. Golden Pocket and the Premium Zone Confluence
The retracement found a reaction at the Golden Pocket level (0.618–0.65 Fibonacci zone) , which is significant not just for its mathematical roots but for how frequently smart money uses it for mitigation and continuation entries.
- The zone lines up directly with the FVG chain, creating a powerful confluence zone where institutional footprints are likely to reappear.
- This area is within a clear premium pricing territory , above the 0.5 Fibonacci mark—ideal for distribution in bearish re-accumulation setups.
This convergence of technical signals bolsters the case that the current move upward is a mere retracement, not a genuine trend reversal.
---
4. Market Structure Context
From a structural point of view:
- Price has transitioned from a range into a lower high formation after the BSL sweep.
- The series of lower highs and lower lows began forming after the grab, which implies a potential shift in short-term order flow.
Combine this with the FVG chain and the premium pricing—it paints a narrative of bearish continuation rather than trend expansion to the upside.
---
5. Institutional Narrative: Engineering, Repricing, and Continuation
This setup is less about indicators and more about understanding narrative:
- Institutions engineered a liquidity sweep to fill large sell orders at premium pricing.
- The imbalance left behind (FVGs) serves as a “pullback magnet” before full bearish delivery.
- Price is currently delivering into that inefficiency, likely forming a redistribution schematic.
The most probable scenario, given this context, is a rejection within this zone and a continuation to the downside as price seeks to break internal structure and move toward sell-side liquidity (SSL) resting below.
---
Conclusion:
This chart captures the essence of smart money price delivery:
- Sweep → Retrace → Mitigation → Continuation
The rejection from the FVG chain and golden pocket zone will be key to confirming this scenario. If price respects this confluence, expect bearish order flow to dominate the next sessions.
This is a high-quality setup based on narrative, structure, and liquidity—not random confluence, but a storyline of engineered movement and institutional footprints.

Trading AUDUSD | Judas Swing Strategy 15/04/2025Tuesday's price action on FX:AUDUSD , we got a textbook Judas Swing play and for those still getting used to spotting these setups in real-time, let’s break this one down and talk through what happened and more importantly, why it happened.
Going into the session open, we had a relatively tight consolidation, with the 00:00 - 08:30est range acting as a container for liquidity. Price had built up liquidity at the high and low of the zone. Whichever side gets swept first will determine our directional bias for the session
Just after the session began, we saw price aggressively push up taking out the buy side liquidity resting above those early highs. This is what is called the "Judas move", a false breakout meant to trap breakout buyers and entice liquidity into the market. This move is not random. It’s designed to induce traders into the wrong side of the market before the real direction reveals itself
As soon as that liquidity grab was complete, we noticed price begin to stall and form a shift in market structure. This is critical. Once you see a break of structure to the downside, followed by a lower high into a FVG, that’s your confirmation that the real move, the sell-off is in play. We then saw clean displacement to the downside, confirming the manipulation phase was over
Now we wait for a retracement into the Fair Value Gap (FVG). We'll only look to execute a trade once a candle enters the FVG and closes. After a few minutes of waiting, price finally retraced into the FVG, giving us the green light to execute the trade.
Entry: 0.63749
Stop loss: 0.63849
Take profit: 0.63549
This FX:AUDUSD trade gave us a smooth ride with minimal drawdown. Right after entry price moved swiftly into profit. Although there was a brief retrace back to our entry point, it quickly corrected, and we were back in the green. With just a 1% risk, the trade delivered a solid 2% return all within 1 hour and 20 minutes
This setup is an excellent example of why you don’t want to chase early session breakouts blindly. The Judas Swing strategy teaches us to look for the trap, wait for confirmation, and then trade in alignment with the real intention behind price. Beginners often get caught up in the initial move, thinking it’s the real trend. But if you can slow down, understand the time of day, the draw on liquidity, and the reaction around key highs/lows, you’ll start to see how often price manipulates before delivering.

US30 Long 15 & 5 min
BLACKBULL:US30
We can see 2 relatively equal lows, which to my opinion may get swept to fill the fair value gap below, and then react to the point that we sweep the swing high
XAUUSD Long after FVG
Waiting for this FVG to get hit and sweeping the minor liquidity, then putting long. Thoughts?
OANDA:XAUUSD

GBPUSD: Buy Entry Win. HOW LOL
SO I was able to win this. idk how. but..
oh wait I know.
Here's what I did right.
0. I checked the Levels (W>D>HR>KEY LEVELS) of the Forex Market pairs on Saturday.
-I plan to keep re-assessing this every week, as practice, and to see how price is moving.
1. I assessed day bias & market intention. I guess I hit the nail on the head here.
2. Saw price trending up, so I plotted my fib and frvp. Confluenced with FVG.
3. Instead of entering on the OTE Zone, I waited to see if it would be respected. It did.
4. Instead of putting a limit entry, I set an alarm on my intended entry zone. So when it got hit, I setup my buy limit.
-I think I can improve this by putting a buy stop limit on the OTE ZONE as entry trigger, and the actual buy stop at the intended entry zone. So, if OTE is HIT, then activate LIMIT ENTRY @ price breakout(the choch line)
5. I looked farther to the left to see what's a probable target. I found one, so I targeted it. It was the weekly & daily FVGs above.
It's more or less lucky that I hit it? Price really just had a strong momentum... and before the momentum, it hit a bullish fvg below.
What happens after price rebalances an FVG? It seeks liquidity on the opposite side. This is what happened. And I caught it right this time.

SUI: Into the Trap — or Out of It?Looks like smart money just left breadcrumbs. We’ve got a clean structure break followed by a classic Fair Value Gap — price wicked into it and held. This kind of move often signals reaccumulation before expansion.
If this is a trap, it's beautifully laid. If it's a setup — it's surgical.
Expecting a bounce from the FVG zone back toward the recent highs around 2.36.
Entry: $2.21-2.23
Stop-loss: $2.19
Target: $2.36
Risk/Reward: 2.89
More thoughts in my profile @93balaclava
Personally I trade on a platform that offers low fees and strong execution. DM me if you're interested.

possible buyhigher time frame bullish, sitting at strong support and demand we can see a possible retest of highs, after either a London sell side liquidity sweep or both London and Asian low sweep waiting for this to take place in our entry zone new york

CADJPY possible Bullish My analysis for CADJPY expect that price will move down to take liquidity at Point A. Following this liquidity grab, I will be looking for confirmation signals of bullish momentum. If confirmed, the first profit target would be within the Fair Value Gap (FVG) at Point B, second profit target would be the liquidity level at Point C.

BTC - breakout or bull trap in progress?Yesterday, Bitcoin broke out of the descending trendline it had been respecting for several days, forming a clear double bottom in the process — a classic reversal pattern suggesting bullish intent. Since then, price action has shifted into a consolidation phase, hovering just beneath a key liquidity zone filled with stop-loss orders from prior short positions.
This area aligns closely with the previous 4H lower high, above which lies a fair value gap (FVG) that hasn't yet been fully filled. A move into this region seems likely, especially with liquidity resting above the prior high. We could see BTC targeting a partial fill — around the 50% mark — of that 4H FVG before any significant reaction occurs.
On the way up, BTC also created another 4H FVG. It’s likely that price could revisit and partially fill this imbalance before continuing its move higher. This zone could serve as an ideal retracement area for bulls to re-enter, especially if the market seeks to rebalance before making a stronger push.
Looking ahead, the $85.5K level stands out as a highly probable target. It marks a key psychological and technical resistance zone and is a magnet for liquidity. With momentum building and the current structure leaning bullish in the short term, a sweep of that level in the coming days is entirely plausible.
However, it's important to zoom out. Despite this bullish momentum, the broader market structure remains bearish. Unless BTC breaks above and holds above this larger structure convincingly, rallies are more likely to be liquidity grabs rather than true trend reversals. Once $85.5K is tagged, there's a real possibility of a sharp rejection — potentially sending price back toward local lows or even printing new ones.

Mastering Volatile Markets: Liquidity Makes or Breaks Trades█ Mastering Volatile Markets Part 2: Why Liquidity Makes or Breaks Your Trades
If you've read the first part of this four-part series, you know that reducing position size is a key strategy for surviving volatile markets. The second crucial factor that determines success or failure in wild markets is understanding liquidity.
In volatile markets, liquidity is often the real reason behind those massive price spikes — whether 300-500 point moves in the NAS100, violent whipsaws in crypto or stop hunts in forex.
█ Liquidity: The Silent Killer in Wild Markets
In normal market conditions, liquidity is everywhere. You can enter and exit trades with minimal slippage, and everything feels smooth. But in volatile conditions, liquidity can disappear quickly.
Here's why it happens:
Market makers pull back to avoid getting caught in wild moves.
Spreads widen , making execution harder.
Order books thin out , meaning there aren't enough buy or sell orders to absorb aggressive price movements.
Even small orders can cause significant price changes when liquidity is low.
This is what causes those huge candles you often see in volatile markets. It's not just about more buyers or sellers; it's about less liquidity available to absorb those trades.
There’s also a common misunderstanding at play here: High Volume = High Liquidity
Many newer traders see a big volume candle and think, "Oh, high volume means it's safe to trade." But that’s an inaccurate conclusion.
⚪ Volume refers to the number of transactions happening.
⚪ Liquidity refers to how much depth the market has to handle those transactions without causing price instability.
In volatile markets, high volume doesn't mean there's enough liquidity.
And low liquidity causes wild wicks, huge spreads, higher slippage and unstable price action.
█ How to Navigate Low Liquidity in Volatile Markets
So, how can you trade effectively in these conditions?
1) Expect Crazy Moves — Levels Will Get Violated
In high-volatility, low-liquidity markets:
Support and resistance levels won't hold as they usually do.
Price will blow through key levels like they were nothing.
Fakeouts become extremely common.
2) Don't Rely Solely on Support & Resistance
As a newer trader, it's vital not to blindly rely on S/R levels in these markets. Here's why:
Don't expect clean bounces or perfect reactions.
Fakeouts, wicks, and stop hunts are normal.
Tight stops right behind these levels? You'll get stopped out a lot.
Experienced traders know this, which is why we adapt the strategies to handle the market's unpredictability.
3) Split Your Orders Into Smaller Chunks
One of the most effective techniques in volatile markets is order splitting.
Break it into smaller chunks instead of entering your full position at one price. This would help you survive fakeouts, scale in better across larger price moves and avoid becoming liquidity for bigger players.
Example: Let's say you want to go long at support (15,000 on the NAS100), instead of entering all at 15,000. Instead Enter:
25% at 15,000
25% at 14,950
25% at 14,900
25% at 14,850
This way, if the market fakes out below support due to low liquidity, you get filled at better prices without panic.
4) Control Your Emotions — Understand the Environment
This is HUGE in volatile markets.
Many retail traders panic when prices move against them quickly. But if you understand the nature of low liquidity , you can remain calm:
It's normal for the price to move wildly.
Levels will get swept.
Fake moves are common before the market plays out the right way.
█ Summary
Let’s take stock of what we learned today about liquidity in highly volatile markets:
High volatility often equals low liquidity.
High volume does not equal high liquidity.
Expect fakeouts , wild price behavior, and wide spreads.
Don't rely blindly on support/resistance levels.
Split your orders into smaller chunks to manage risk.
Trade smaller position sizes and stay calm.
Remember, you must adapt not only your size but also your execution . Understand liquidity, or it will punish you.
█ What We Covered Already:
Part 1: Reduce Position Size
Part 2: Liquidity Makes or Breaks Trades
█ What's Coming Next in the Series:
Part 3: Patience Over FOMO
Part 4: Trend Is Your Best Friend
-----------------
Disclaimer
The content provided in my scripts, indicators, ideas, algorithms, and systems is for educational and informational purposes only. It does not constitute financial advice, investment recommendations, or a solicitation to buy or sell any financial instruments. I will not accept liability for any loss or damage, including without limitation any loss of profit, which may arise directly or indirectly from the use of or reliance on such information.
All investments involve risk, and the past performance of a security, industry, sector, market, financial product, trading strategy, backtest, or individual's trading does not guarantee future results or returns. Investors are fully responsible for any investment decisions they make. Such decisions should be based solely on an evaluation of their financial circumstances, investment objectives, risk tolerance, and liquidity needs.
