Current GBP/JPY TradeRight now I am in a long GJ trade. The reason for this trade was the liquidity that was created with a bearish push towards a higher time frame demand order block. Additionally, a few more imbalances were created with the same bearish push. Once price reacted from the higher time frame OB i waited for a CHoCH and found my 5M TF OB from which i took longs from. Price hovered above and below entry before finally pushing towards the upside. I have already exited with one trade, and have another running, which i will hold towards the first imbalance.
Liquidity

GBPUSD: Potential Sell Opportunity I am currently observing a potential sell-side draw on GBPUSD , as we've seen an expansion out of accumulation accompanied by the filling of a liquidity void to the downside and the mitigation of an H1 Order Block. This movement also resulted in the absorption of all Engineered Liquidity . Consequently, the draw momentarily appears to be to the upside , aiming to fill the Liquidity Void left behind when price expanded lower.
To confirm sell positions, I will be closely monitoring the filling of the liquidity void and the mitigation of the H1 Order Block. Once these conditions are met, I will look for a confirmation entry point.
Stay tuned for an in-depth video analysis.
Kind Regards,
The_Architect

EURUSD 29 Feb 2024 W9 - Intraday Analysis - US PCE/JoblessThis is my Intraday analysis on EURUSD for 29 Feb 2024 W9 based on Smart Money Concept (SMC) which includes the following Time Frames:
4H
15m
NOTE: Nothing changed again from yesterday, 4H no changes and 15m just created INT to INT Structure.
4H Chart Analysis
1.
Swing Bearish
INT Bullish
Swing Pullback Phase
2.
After a BOS and iBOS we expect a Pullback.
As expected after the Bullish CHoCH and mitigation of 4H/Daily Demand zones, we initiated the INT Structure Pullback.
Price reached the 4H/Daily Supply and from there we could start the bearish continuation.
Price failed to continue the bearish move and as expected it changed bullish and created iBOS confirming Swing Low and Bearish Swing Pullback Phase started.
3.
After Bullish iBOS confirming Swing Pullback Phase started, We are expecting INT Pullback.
Price reached the 4H Supply as expected and showed solid reaction from there. This reaction is starting the Bullish INT Structure Pullback.
We didn't do a Bearish CHoCH to confirm INT High yet. So, there is a probability that price could tap into the CHoCH.
Also we tapped into a Daily Demand (Not a HP zone) which is currently containing price.
As the 4H Swing is bearish, the Swing pullback could be done after reaching the 4H Supply, Bearish CHoCH will be the initial weak conformation and a Bearish iBOS will be the solid confirmation for that scenario.
Other scenario is a deeper Swing Pullback and 4H INT will stay Bullish to facilitate that view.
15m Chart Analysis
1.
Swing Bullish
INT Bullish
INT INT Bearish
INT Continuation Phase
2.
Swing turned bullish to facilitate the 4H Swing Pullback.
After BOS we expect a pullback. Price reached the 4H Supply as expected and from there started the 15m INT Structure Pullback.
With the ranging behavior of price we created INT to INT Structure which turned bearish and currently challenging to maybe targeting the INT Structure Pullback low (ii Low @ 1.0803).
Price is currently bearish within the Bullish INT/Swing structure. Expectations that the INT to INT Structure will continue bearish and target the INT to INT Low.
But be mindful that there is a HP that price can create a bullish iiBOS to continue the Bullish INT Structure.

EURUSD 28 Feb 2024 W9 - Intraday Analysis - US GDPThis is my Intraday analysis on EURUSD for 28 Feb 2024 W9 based on Smart Money Concept (SMC) which includes the following Time Frames:
4H
15m
NOTE: Nothing changed again from yesterday, 4H no changes and 15m just created INT to INT Structure.
4H Chart Analysis
1.
Swing Bearish
INT Bullish
Swing Pullback Phase
2.
After a BOS and iBOS we expect a Pullback.
As expected after the Bullish CHoCH and mitigation of 4H/Daily Demand zones, we initiated the INT Structure Pullback.
Price reached the 4H/Daily Supply and from there we could start the bearish continuation.
Price failed to continue the bearish move and as expected it changed bullish and created iBOS confirming Swing Low and Bearish Swing Pullback Phase started.
3.
After Bullish iBOS confirming Swing Pullback Phase started, We are expecting INT Pullback.
Price reached the 4H Supply as expected and showed solid reaction from there. This reaction is starting the Bullish INT Structure Pullback.
We didn't do a Bearish CHoCH to confirm INT High yet. So, there is a probability that price could tap into the CHoCH.
Also we tapped into a Daily Demand (Not a HP zone) which is currently containing price.
As the 4H Swing is bearish, the Swing pullback could be done after reaching the 4H Supply, Bearish CHoCH will be the initial weak conformation and a Bearish iBOS will be the solid confirmation for that scenario.
Other scenario is a deeper Swing Pullback and 4H INT will stay Bullish to facilitate that view.
15m Chart Analysis
1.
Swing Bullish
INT Bullish
INT INT Bearish
INT Continuation Phase
2.
Swing turned bullish to facilitate the 4H Swing Pullback.
After BOS we expect a pullback. No HTF POI price tapped into yet to start the pullback.
Price reached the 4H Supply as expected and from there started the 15m INT Structure Pullback.
We reached the INT Structure extreme and price started a bounce.
Price created a Bullish CHoCH after ranging which indicates that the INT Pullback is over and expectation is to target the Weak INT High.
With the ranging behavior of price we created INT to INT Structure which turned bearish and currently challenging to maybe targeting the INT Structure Pullback low (ii Low @ 1.0803).

EURUSD 27 Feb 2024 W9 - Intraday Analysis - US Cons. ConfidenceThis is my Intraday analysis on EURUSD for 27 Feb 2024 W9 based on Smart Money Concept (SMC) which includes the following Time Frames:
4H
15m
4H Chart Analysis
1.
Swing Bearish
INT Bullish
Swing Pullback Phase
2.
After a BOS and iBOS we expect a Pullback.
As expected after the Bullish CHoCH and mitigation of 4H/Daily Demand zones, we initiated the INT Structure Pullback.
Price reached the 4H/Daily Supply and from there we could start the bearish continuation.
Price failed to continue the bearish move and as expected it changed bullish and created iBOS confirming Swing Low and Bearish Swing Pullback Phase started.
3.
After Bullish iBOS confirming Swing Pullback Phase started, We are expecting INT Pullback.
Price reached the 4H Supply as expected and showed solid reaction from there. This reaction is starting the Bullish INT Structure Pullback.
We didn't do a Bearish CHoCH to confirm INT High yet. So, there is a probability that price could tap into the CHoCH.
Also we tapped into a Daily Demand (Not a HP zone) which is currently containing price.
As the 4H Swing is bearish, the Swing pullback could be done after reaching the 4H Supply, Bearish CHoCH will be the initial weak conformation and a Bearish iBOS will be the solid confirmation for that scenario.
Other scenario is a deeper Swing Pullback and 4H INT will stay Bullish to facilitate that view.
15m Chart Analysis
1.
Swing Bullish
INT Bullish
INT Continuation Phase
2.
Swing turned bullish to facilitate the 4H Swing Pullback.
After BOS we expect a pullback. No HTF POI price tapped into yet to start the pullback.
Price reached the 4H Supply as expected and from there started the 15m INT Structure Pullback.
We reached the INT Structure extreme and price started a bounce.
Price created a Bullish CHoCH after ranging which indicates that the INT Pullback is over and expectation is to target the Weak INT High.

Potential EURGBP Sell IdeaAmidst the current consolidation of DXY , my focus shifts towards the exotic pair EURGBP. Exotic pairs tend to exhibit heightened volatility during periods of DXY consolidation.
I anticipate EURGBP to fill the Liquidity Void on the H4 Timeframe by mitigating the H4 Order Block. My trading strategy involves waiting for confirmation during the London session to initiate sell trades , with targets set on the Daily Sell Stops and/or the H4 Discount FVG.
It's noteworthy that our approach involves transitioning from External Liquidity to Internal Liquidity . As evidenced on the Daily Timeframe, we've already filled a Daily FVG, prompting our focus on External Liquidity, specifically the Daily Sell Stops.
Kind Regards,
The_Architect

GUMy Zones for GU this week is just some simple supply and demand zones and some liquidity zones. I will be watching orderflow closely when i enter trades since we begin to slow down a bit in price action and are in a range. I will be using the daily and weekly open as extra confluence as usual for my day-to-day setups and the zones for a Wyckoff schematic setup.

NQ going into Monday Mixed Monthly: Price is still above PMH with 3d and 19Hrs left and we are at all time highs therefore price can either continue or start to pull back.
Weekly: price took out previous weeks high and low failed to close above PWH or below PWL, however the candle closed bullish.
Daily: Friday candle swept buy side liquidity or PDH and failed to make a swing high therefore the draw on liquidity was to the previous day low which price has reached during this Sunday open
going into a daily BISI, I will look at NY opening to is this daily BISI is going to be respected on 4hr and 1hr
4hr level broke lower which mean price could be making a pull back as of now I don't have a clear DOL , which gives me mixed feels so we will address more in tomorrows pre market leading into the opening session

EURUSD 26 Feb 2024 W9 - Intraday AnalysisThis is my Intraday analysis on EURUSD for 26 Feb 2024 W9 based on Smart Money Concept (SMC) which includes the following Time Frames:
4H
15m
NOTE: Nothing major changed since last Friday analysis. Price still within a tide range.
4H Chart Analysis
1.
Swing Bearish
INT Bullish
Swing Pullback Phase
2.
After a BOS and iBOS we expect a Pullback.
As expected after the Bullish CHoCH and mitigation of 4H/Daily Demand zones, we initiated the INT Structure Pullback.
Price reached the 4H/Daily Supply and from there we could start the bearish continuation.
Price failed to continue the bearish move and as expected it changed bullish and created iBOS confirming Swing Low and Bearish Swing Pullback Phase started.
3.
After Bullish iBOS confirming Swing Pullback Phase started, We are expecting INT Pullback.
Price reached the 4H Supply as expected and showed solid reaction from there. This reaction is starting the Bullish INT Structure Pullback.
We didn't do a Bearish CHoCH to confirm INT High yet. So, there is a probability that price could tap into the CHoCH.
Also we tapped into a Daily Demand (Not a HP zone) which is currently containing price.
As the 4H Swing is bearish, the Swing pullback could be done after reaching the 4H Supply, Bearish CHoCH will be the initial weak conformation and a Bearish iBOS will be the solid confirmation for that scenario.
Other scenario is a deeper Swing Pullback and 4H INT will stay Bullish to facilitate that view.
15m Chart Analysis
1.
Swing Bullish
INT Bullish
INT Continuation Phase
2.
Swing turned bullish to facilitate the 4H Swing Pullback.
After BOS we expect a pullback. No HTF POI price tapped into yet to start the pullback.
Price reached the 4H Supply as expected and from there started the 15m INT Structure Pullback.
We reached the INT Structure extreme and price started a bounce.
Still we are in Bearish Fractal and the CHoCH is high and this will lead to 2 scenarios,
Scenario 1: Price respecting the 15m INT Structure and continue up.
Scenario 2: Price will target the 4H CHoCH (15m INT Low) initiate a move to the up side from the 4H Demand. (Bearish iBOS, 4H Demand will initiate a Pullback)

EURUSD 26-1 Mar 2024 W9 Weekly Analysis - US PCE/GDP WeekThis is my Weekly analysis on EURUSD for 26-1 Mar 2024 W8 based on Smart Money Concept (SMC) which includes the following Time Frames:
Weekly
Daily
4H
Economic Events
Weekly Chart Analysis
1.
Swing Bearish
Internal Bearish
Reached Swing EQ
(Pro Swing + Pro Internal)
2.
After the Bearish iBOS we expected pullback, price tapped into Liq on the lift and a Weekly demand zone which provided a pullback and formed a bullish CHoCH confirming INT Low.
Price reached the INT Extreme and tapped the Weekly Supply Zone and as expected we are targeting at least the CHoCH and then the Weak INT Low.
Price did the Bearish ChoCH and formed a fresh Supply zone which will be potential for shorts once reached to continue the Bearish INT structure and Swing too.
3.
With the Bearish INT Structure we have the confirmation that the Swing Pullback is over and we are currently in the Swing Continuation Phase.
Price had reached the Bearish INT Structure extreme and showed reaction from which resulted in a Bearish CHoCH.
Expectation now set to see price continuing bearish.
Daily Chart Analysis
1.
Swing Bearish
INT Bearish
Swing Continuation / INT Pullback
2.
Within the Daily Bearish Swing we reached the Swing extreme area and mitigated a Weekly Supply zone and formed a bearish iBOS confirming the Swing Pullback is over and we are Pro Bearish Swing and starting the Continuation Phase targeting the Weak Swing Low.
3.
After the iBOS we expect a Pullback.
After mitigating the Daily Demand zone we formed a Bullish CHoCH which confirmed the INT Structure Pullback Phase started.
Expectations is set now for the INT Structure Pullback Phase to continue to the INT EQ up to the Daily/Weekly Supply. But be mindful that the Swing continuation can continue at any time.
There is no HP POI for Shorts up to the Daily/Weekly Supply Zones.
IMO Price could continue up to sweep LIQ from the INT Momentum Phase that leaded to the iBOS before we continue down.
4.
Daily and Weekly demand zones for reactions once reached.
4H Chart Analysis
1.
Swing Bearish
INT Bullish
Swing Pullback Phase
2.
After a BOS and iBOS we expect a Pullback.
As expected after the Bullish CHoCH and mitigation of 4H/Daily Demand zones, we initiated the INT Structure Pullback.
Price reached the 4H/Daily Supply and from there we could start the bearish continuation.
Price failed to continue the bearish move and as expected it changed bullish and created iBOS confirming Swing Low and Bearish Swing Pullback Phase started.
3.
After Bullish iBOS confirming Swing Pullback Phase started, We are expecting INT Pullback.
Price reached the 4H Supply as expected and showed solid reaction from there. This reaction is starting the Bullish INT Structure Pullback.
We didn't do a Bearish CHoCH to confirm INT High yet. So, there is a probability that price could tap into the CHoCH.
Also we tapped into a Daily Demand (Not a HP zone) which is currently containing price.
As the 4H Swing is bearish, the Swing pullback could be done after reaching the 4H Supply, Bearish CHoCH will be the initial weak conformation and a Bearish iBOS will be the solid confirmation for that scenario.
Other scenario is a deeper Swing Pullback and 4H INT will stay Bullish to facilitate that view.
Economic Events for the Week

Potential Nq Buys after price took out weekly-low/ sell side liquidity we had a reversal from positive reports from big tech companies on NQ followed by a huge rally today, therefore I am anticipating price continuing to previous day high and maybe even previous weeks high.
The 1hr time frame could have a shallow pull back and we run to that level in london , I am looking for a overnight consolidation session between asian and london, with price coming back into 4hr bisi before rallying higher,
From 7:30-10am cst time there will be medium impacting news for the DXY that can affect NQ price action but we will see how the markets look in the AM 20-30 min before the opening bell

EURUSD 23 Feb 2024 W8 - Intraday Analysis - German GDP/IFOThis is my Intraday analysis on EURUSD for 23 Feb 2024 W8 based on Smart Money Concept (SMC) which includes the following Time Frames:
4H
15m
4H Chart Analysis
1.
Swing Bearish
INT Bullish
Swing Pullback Phase
2.
After a BOS and iBOS we expect a Pullback.
As expected after the Bullish CHoCH and mitigation of 4H/Daily Demand zones, we initiated the INT Structure Pullback.
Price reached the 4H/Daily Supply and from there we could start the bearish continuation.
Price failed to continue the bearish move and as expected it changed bullish and created iBOS confirming Swing Low and Bearish Swing Pullback Phase started.
3.
After Bullish iBOS confirming Swing Pullback Phase started, We are expecting INT Pullback.
Price reached the 4H Supply as expected and showed solid reaction from there. This reaction is starting the Bullish INT Structure Pullback.
We didn't do a Bearish CHoCH to confirm INT High yet. So, there is a probability that price could tap into the CHoCH.
Also we tapped into a Daily Demand (Not a HP zone) which is currently containing price.
As the 4H Swing is bearish, the Swing pullback could be done after reaching the 4H Supply, Bearish CHoCH will be the initial weak conformation and a Bearish iBOS will be the solid confirmation for that scenario.
Other scenario is a deeper Swing Pullback and 4H INT will stay Bullish to facilitate that view.
15m Chart Analysis
1.
Swing Bullish
INT Bullish
INT Continuation Phase
2.
Swing turned bullish to facilitate the 4H Swing Pullback.
After BOS we expect a pullback. No HTF POI price tapped into yet to start the pullback.
Price reached the 4H Supply as expected and from there started the 15m INT Structure Pullback.
We reached the INT Structure extreme and price started a bounce.
Still we are in Bearish Fractal and the CHoCH is high and this will lead to 2 scenarios,
Scenario 1: Price respecting the 15m INT Structure and continue up.
Scenario 2: Price will target the 4H CHoCH (15m INT Low) initiate a move to the up side from the 4H Demand. (Bearish iBOS, 4H Demand will initiate a Pullback)
3.
15m/4H Demand to initiate a bullish continuation after sweeping the 4H LIQ (CHoCH) if we didn't confirm Bearish 15m iBOS.
If Bearish iBOS confirmed, it will be risky and the 4H Demand will provide imo a pullback only.
Waiting for more price development.

Ripple flush then reclaim range EQ - Game OnXRP has been ranging, like it or not, for the past few months. Blue range high and low signify the parameters price has respected and I do not expect this to change.
What I would expect, is a potential flush into the deman zone (green) preceeding a push up to the mid-range with a reclaim and push to the range high.
This is contingent on the fact the altcoin market, as a whole, remains steady and relatively strong ie: no BTC/ETH cap events.
Ripple loves flushing the lows before pumping, so this is a cautious play I am watching. The more optimistic scenario is we don't flush into green and simply continue this trend up the the range eq and highs.
Time will tell, price current making a decision on the local S/R in red.
Stay frosty.
Vatsik

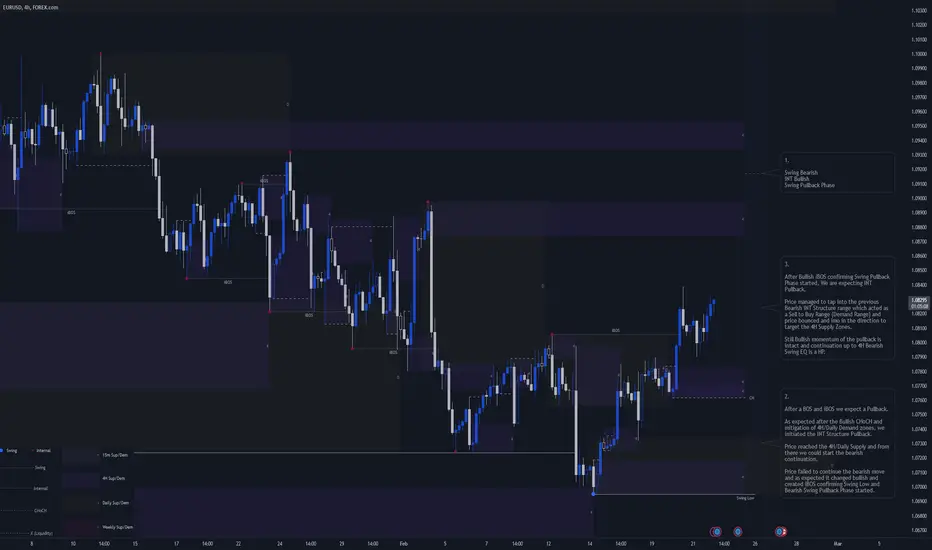
EURUSD 22 Feb 2024 W8 - Intraday Analysis - EU CPI / US JoblessThis is my Intraday analysis on EURUSD for 21 Feb 2024 W8 based on Smart Money Concept (SMC) which includes the following Time Frames:
4H
15m
4H Chart Analysis
1.
Swing Bearish
INT Bullish
Swing Pullback Phase
2.
After a BOS and iBOS we expect a Pullback.
As expected after the Bullish CHoCH and mitigation of 4H/Daily Demand zones, we initiated the INT Structure Pullback.
Price reached the 4H/Daily Supply and from there we could start the bearish continuation.
Price failed to continue the bearish move and as expected it changed bullish and created iBOS confirming Swing Low and Bearish Swing Pullback Phase started.
3.
After Bullish iBOS confirming Swing Pullback Phase started, We are expecting INT Pullback.
Price managed to tap into the previous Bearish INT Structure range which acted as a Sell to Buy Range (Demand Range) and price bounced and imo in the direction to target the 4H Supply Zones.
Still Bullish momentum of the pullback is intact and continuation up to 4H Bearish Swing EQ is a HP.
15m Chart Analysis
1.
Swing Bullish
INT Bullish
INT Continuation Phase
2.
Swing turned bullish to facilitate the 4H Swing Pullback.
After BOS we expect a pullback. No HTF POI price tapped into yet to start the pullback.
Most probably price will continue bullish till the 4H Supply zone.
Bearish iBOS will confirm 15m Swing High and Start of Swing Pullback.
Continuing my bullish Bias on EURUSD till we reach the 4H Swing EQ/HP Supply zones.
USDJPY SHORT SETUPSetting up a short on USDJPY, after a bear trend day market has finally retraced and reached a decent supply a demand zone which based on Price action there are sellers willing to enter the market, I am waiting for price to break previous swing high and tap into liquidity to then go short.

EURUSD 21 Feb 2024 W8 - Intraday Analysis - EU Conf. US FOMCThis is my Intraday analysis on EURUSD for 21 Feb 2024 W8 based on Smart Money Concept (SMC) which includes the following Time Frames:
4H
15m
4H Chart Analysis
1.
Swing Bearish
INT Bullish
Swing Pullback Phase
3.
After Bullish iBOS confirming Swing Pullback Phase started, We are expecting INT Pullback.
We are currently within a previous Daily Supply that is partially mitigated but with the current Bullish momentum an INT Pullback most probably will start from the 4H Supply/Swing EQ based on the LIQ on the left.
2.
After a BOS and iBOS we expect a Pullback.
As expected after the Bullish CHoCH and mitigation of 4H/Daily Demand zones, we initiated the INT Structure Pullback.
Price reached the 4H/Daily Supply and from there we could start the bearish continuation.
Price failed to continue the bearish move and as expected it changed bullish and created iBOS confirming Swing Low and Bearish Swing Pullback Phase started.
15m Chart Analysis
1.
Swing Bullish
INT Bullish
INT Pullback Phase
2.
Swing turned bullish to facilitate the 4H Swing Pullback.
After BOS we expect a pullback. No HTF POI price tapped into yet to start the pullback.
Most probably price will continue bullish till the 4H Supply zone.
Bearish iBOS will confirm 15m Swing High and Start of Swing Pullback.
Continuing my bullish Bias on EURUSD till we reach the 4H Swing EQ/HP Supply zones.

GBPCAD:A LIQUIDITY SWEEP THAN SHORT !WE just hit a daily FVG and took a liquidity sweep.
Waiting for a MSS on the 30 min to go short.

Overnight trade for ADA futures - MMBM 15minPrice had a rally on the PM session today. Im expecting continuation of the move for te LN session.

EURUSD 20 Feb 2024 W8 - Intraday AnalysisThis is my Intraday analysis on EURUSD for 20 Feb 2024 W8 based on Smart Money Concept (SMC) which includes the following Time Frames:
4H
15m - Scenario 1
15m - Scenario 2
4H Chart Analysis
1.
Swing Bearish
INT Bearish
INT Pullback Phase
2.
After a BOS and iBOS we expect a Pullback.
As expected after the Bullish CHoCH and mitigation of 4H/Daily Demand zones, we initiated the INT Structure Pullback.
Price reached the 4H/Daily Supply and from there we could start the bearish continuation.
Also be mindful that there is also a pullback required for the 4H Swing so there is a HP if price going to stay bullish we will take the Strong INT High.
Bullish iBOS will signal a Swing Pullback.
15m Chart Analysis - Scenario 1
1.
Swing Bearish
INT Bearish
Swing Bearish Continuation Phase
2.
Price is at the 15m Swing Extreme, mitigating the 4H Supply.
As the Swing is Bearish, expectations is set to continue Bearish.
Price created a Bearish iBOS signaling that that the Swing Pullback is over and we started the Swing Bearish Continuation Phase to target the Swing Low.
But also be mindful that the 4H Swing Pullback still required so there is a HP that we may take the 15m Swing High.
3.
15m/4H Demand zones that can provide only reaction and not a buy opportunity.
15m Chart Analysis - Scenario 1
1.
Swing Bearish
INT Bullish
INT Pullback Phase
2.
Price is at the 15m Swing Extreme, mitigating the 4H Supply.
As the Swing is Bearish, expectations is set to continue Bearish.
Price created a Bearish INT to INT structure and tuned bearish to facilitate the INT Structure Pullback. As the INT is Bullish there is a HP we are going to target the Swing High.
Bearish iBOS will signal that the Swing Pullback Phase is over and we are starting the Swing Bearish continuation Phase.
But also be mindful that the 4H Swing Pullback still required so there is a HP that we may take the 15m Swing High.
3.
15m/4H Demand zones that can provide only reaction and not a buy opportunity.

Fake ZonesThis indicator is useful for whom trade with "Smart Money Concept (SMC)" strategy.
It helps SMD traders to identify fake or weak zones in the chart, So they can avoid taking position in this zones.
This indicator marks "Asia session" as well as "London and New York's Lunch Time (one hour before London and NY session starts)" zones.
It also marks Inside Bar candles which SMC trades consider as order flow. You can mark every Inside Bar or only those with opposite color via setting options.
*** As we know in SMC rules
1- Supply and Demand zones in "Asia session and Lunch Times" are fake zones for SMC trading and price will engulf them in most of times.
2- "Asia session high and low" has huge liquidity and usually price sweep that in London session.
This indicator will helps traders to visually identify those Fake zones and Asia session liquidity.
* You can change session times based on your time zone in settings.

EURUSD 19 Feb 2024 W8 - Intraday AnalysisThis is my Intraday analysis on EURUSD for 19 Feb 2024 W8 based on Smart Money Concept (SMC) which includes the following Time Frames:
4H
15m
4H Chart Analysis
1.
Swing Bearish
INT Bearish
INT Pullback Phase
2.
After a BOS and iBOS we expect a Pullback.
As expected after the Bullish CHoCH and mitigation of 4H/Daily Demand zones, we initiated the INT Structure Pullback.
Price reached the 4H/Daily Supply and from there we could start the bearish continuation.
Also be mindful that there is also a pullback required for the 4H Swing so there is a HP if price going to stay bullish we will take the Strong INT High.
Bullish iBOS will signal a Swing Pullback.
15m Chart Analysis
15m Chart 1
15m Chart 2
1.
Swing Bearish
INT Bullish
Swing / INT Pullback Phase
Swing Extreme
2.
Price is at the 15m Swing Extreme, mitigating the 4H Supply.
As the Swing is Bearish, expectations is set to continue Bearish. Bearish iBOS will be the signal that the Swing Pullback is over and we may start the Bearish 15m Swing Continuation Phase.
But also be mindful that the 4H Swing Pullback still required so there is a HP that we may take the 15m Swing High.
3.
15m/4H Demand zones that can provide only reaction and not a buy opportunity.

GUThis is my chart for GU! I will continue to trade GU as normal just based of the Daily, and weekly open. Orderflow will give us the opportunities and as for the zones I expect some sort of Wyckoff accumulation or distribution! Time and price will decide if the zones will hold or not!

EURUSD 19-23 Feb 2024 W8 Weekly Analysis - EU CPI/PMI WeekThis is my Weekly analysis on EURUSD for 19-23 Feb 2024 W8 based on Smart Money Concept (SMC) which includes the following Time Frames:
Weekly
Daily
4H
Economic Events
Weekly Chart Analysis
1.
Swing Bearish
Internal Bearish
Reached Swing EQ
(Pro Swing + Pro Internal)
2.
After the Bearish iBOS we expected pullback, price tapped into Liq on the lift and a Weekly demand zone which provided a pullback and formed a bullish CHoCH confirming INT Low.
Price reached the INT Extreme and tapped the Weekly Supply Zone and as expected we are targeting at least the CHoCH and then the Weak INT Low.
Price did the Bearish ChoCH and formed a fresh Supply zone which will be potential for shorts once reached to continue the Bearish INT structure and Swing too.
3.
With the Bearish INT Structure we have the confirmation that the Swing Pullback is over and we are currently in the Swing Continuation Phase.
Price had reached the Bearish INT Structure extreme and showed reaction from which resulted in a Bearish CHoCH.
Expectation now set to see price continuing bearish.
Daily Chart Analysis
1.
Swing Bearish
INT Bearish
Swing Continuation / INT Pullback
2.
Within the Bearish Swing we are currently in the Swing pullback reached the Swing extreme area and mitigated a Weekly Supply zone (But didn't reach the Daily Supply) and started the INT Structure Pullback after the Bullish iBOS.
For the Bearish Swing to continue bearish, we want to see a Bearish iBOS to confirm that the Swing Pullback is over and we are in the Swing Continuation to target the Weak Swing Low.
Price confirmed a Bearish iBOS and this signals the Swing continuation phase.
3.
After the iBOS we expect a Pullback.
Price is currently within the Daily demand on the left which is partially mitigated and approaching a Weekly Demand Zone which could provide reaction to facilitate the Bearish INT Structure Pullback.
Bullish CHoCH will confirm INT Low and INT Structure Pullback maybe starting.
4.
Daily and Weekly demand zones for reactions once reached.
4H Chart Analysis
1.
Swing Bearish
INT Bearish
INT Pullback Phase
2.
After a BOS and iBOS we expect a Pullback.
As expected after the Bullish CHoCH and mitigation of 4H/Daily Demand zones, we initiated the INT Structure Pullback.
Price reached the 4H/Daily Supply and from there we could start the bearish continuation.
Also be mindful that there is also a pullback required for the 4H Swing so there is a HP if price going to stay bullish we will take the Strong INT High.
Bullish iBOS will signal a Swing Pullback.
Economic Events for the Week
