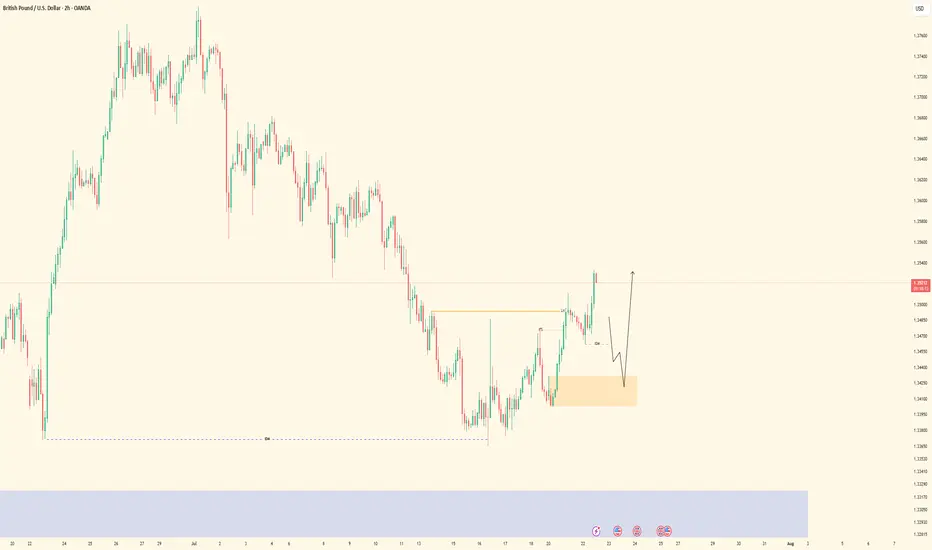
GBPUSD| Bullish Structure Intact - Waiting on BSL SweepPair: GBPUSD
Bias: Bullish
Been following price closely while staying in analysis mode — no rush.
Recent structure remains intact and aligned to the upside. Now waiting for a clean BSL sweep to clear liquidity before looking for LTF confirmations to engage in buys.
Momentum is there, structure is clean — I just need price to do its part.
Staying patient. Still in sync.
#GBPUSD #SMC #bullishstructure #orderflow #inducementking #smartmoneytrader
Bless Trading!
Liquidity
USDJPY| Bullish Bias - Mitigated OB, Waiting for LTF ConfirmsPair: USDJPY
Bias: Bullish
Price swept deeper liquidity and has now mitigated a key 30M bullish order block.
From the 2H bird’s eye view, structure is still aligned to the upside — but I remain in analysis mode until LTF confirms the shift.
No need to force anything — price is doing its job, and I’m waiting for it to speak clearly through confirmation.
Bullish structure still in play, but we wait for the perfect moment.
#USDJPY #SMC #bullishbias #orderblock #structuretrader #inducementking
Bless Trading!

XAUUSD| Still Bullish - Waiting on BSL Sweep for EntryPair: XAUUSD
Bias: Bullish
Price remains bullish and structurally intact. This morning’s updated view confirms the bullish alignment — no change in directional bias.
Currently watching for a clean BSL sweep to clear out early liquidity, followed by LTF confirmations before engaging.
Higher time frame perspective from the 2H chart offers a solid bird’s eye view — staying patient and letting price come to me.
No rush — structure is king.
#XAUUSD #gold #smartmoney #SMC #orderblocks #inducementking #structurefirst
Bless Trading!

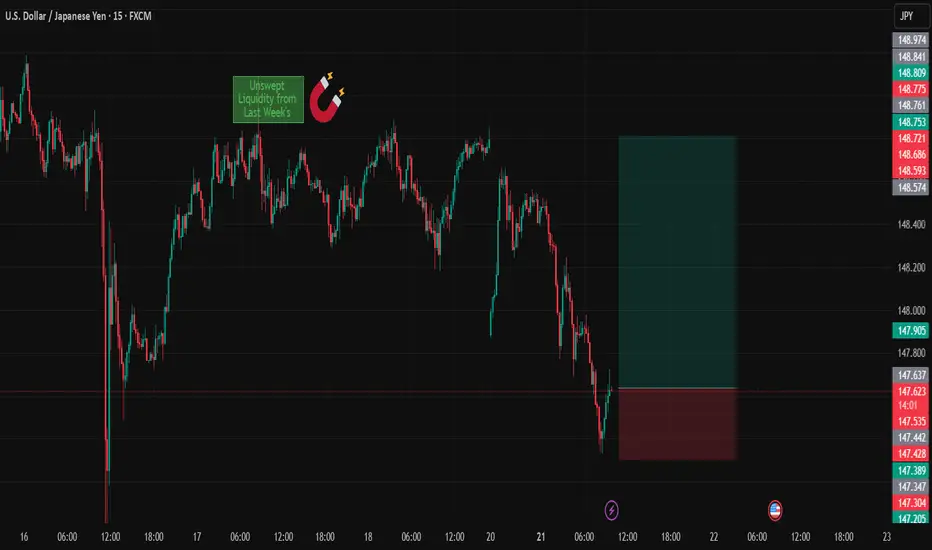
USDJPYDate:
July 22,2025
Session:
Tokyo and London session
Pair:
USDJPY
Bias:
Long
1. Clean liquidity pool left unswept from last week's NYC Open (Thursday).
Took this trade earlier today but looks like price wanted to consolidate in the liquid pool its currently in. I still hold the same idea and think the sweep will definitely take place sometime this week. Now looks like the perfect time to enter. If Asia session cant get it done its up to London and New York session.
Entry:147.534
Stop Loss:147.215
Target:148.768
RR:3.89

EURUSD - Sell Setup in ProgressPair: EURUSD
Bias: Bearish
HTF Overview: Structure leaning bearish — price respecting recent lower highs with room to fall into deeper 4H demand.
Current Zone: Price just mitigated the 30M sell-side OB, showing early signs of reaction.
LTF Confirmation: Still in observation mode — waiting for 5M or 1M confirmation to trigger short entries with confidence.
Entry Zone: Focused on refined LTF shift beneath the 30M OB — ideal setup includes inducement or liquidity run before executing.
Targets: First target is intraday low — ultimate target is the strong 4H demand zone below.
Mindset Note: Let the market bring the entry to you — don’t jump ahead of confirmation. Smart patience wins.
Bless Trading!

GBPUSD| - Bearish Play Setting UpPair: GBPUSD (GU)
Bias: Bearish
HTF Overview: Bearish structure intact — market has been respecting lower highs and pushing into downside pressure.
Current Zone: Price just mitigated the 30M OB, reacting as expected within the supply zone.
LTF Confirmation: Now waiting for clean confirmations on 5M or 1M — not in trader mode yet, analysis still in control.
Entry Zone: Watching for internal liquidity sweep or inducement followed by structure shift to confirm the sell.
Targets: First target is the next 30M low — extended target based on 1H continuation.
Mindset Note: No chasing — let the LTF tell the story before pulling the trigger. Control the urge, trust the system.
Bless Trading!

USDJPY - Bullish Bias, In OB ZonePair: USDJPY (UJ)
Bias: Bullish
HTF Overview: Bullish structure remains intact — price currently pushing upward, respecting higher timeframe flow.
Current Zone: Price is now sitting within the 30M OB, showing potential strength but no LTF confirmation yet.
LTF Confirmation: Still in analysis mode — sitting on hands, waiting for clean reaction on 5M or 1M before considering entries.
Entry Zone: 30M OB being monitored closely — ideal setup would include inducement and clear shift before entry.
Targets: Next 1H high remains the first target — extended targets to be trailed if momentum builds.
Mindset Note: Analysis first, execution second. Discipline is the edge — no rush until LTF gives the green light.
Bless Trading!

XAUUSD - Bullish Bias Holding StrongPair: XAUUSD (Gold)
Bias: Bullish
HTF Overview: Multi-timeframe structure aligned bullish. Market is in a clear uptrend across 4H and 1H, currently retracing toward key OB levels.
LTF Confirmation: Waiting on price to mitigate the 1H OB — once tapped, will drop to 15M and 5M for confirmation before any entries.
Entry Zone: 1H OB marked — setup strengthens if inducement or liquidity sweep occurs just before mitigation.
Targets: Short-term target is the previous high — extended target based on 4H continuation range.
Mindset Note: Alignment is there — now it’s about patience and waiting for execution clarity. Let price deliver the opportunity.
Bless Trading!

GBPJPY| - Bullish Opportunity DevelopingPair: GBPJPY (GJ)
Bias: Bullish
HTF Overview: 1H structure remains bullish with clear higher highs. Market currently pulling back toward a visible 1H Order Block.
LTF Confirmation: Waiting for price to mitigate the 1H OB, then will drop to 15M and 5M for bullish confirmation before entering.
Entry Zone: OB zone marked and active — ideal setup includes liquidity grab or inducement before confirming entry shift.
Targets: First target is recent 1H high — extended targets based on continuation structure above.
Mindset Note: No need to force the trade — the edge comes after the zone is respected and price confirms. Let the setup come to you.
Bless Trading!

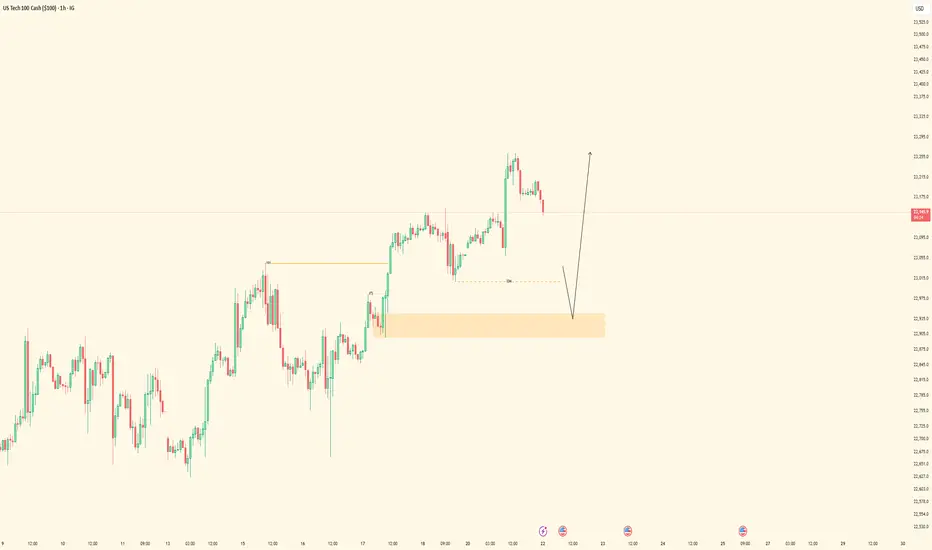
NAS100 - Bullish Setup BuildingPair: NASDAQ (NAS100)
Bias: Bullish
HTF Overview: 1H structure holding bullish after recent break of internal highs. Price pulling back toward a key demand zone.
LTF Confirmation: Waiting for price to mitigate the 1H Order Block, then drop to lower timeframes (15M → 5M) for confirmation entries.
Entry Zone: Watching for bullish reaction within OB, ideally paired with inducement or liquidity sweep before shift.
Targets: Short-term target is the next 1H high — extended targets align with overall bullish momentum continuation.
Mindset Note: Patience over prediction. Let price tap into the zone and confirm — don’t chase, just position smart.
Bless Trading!
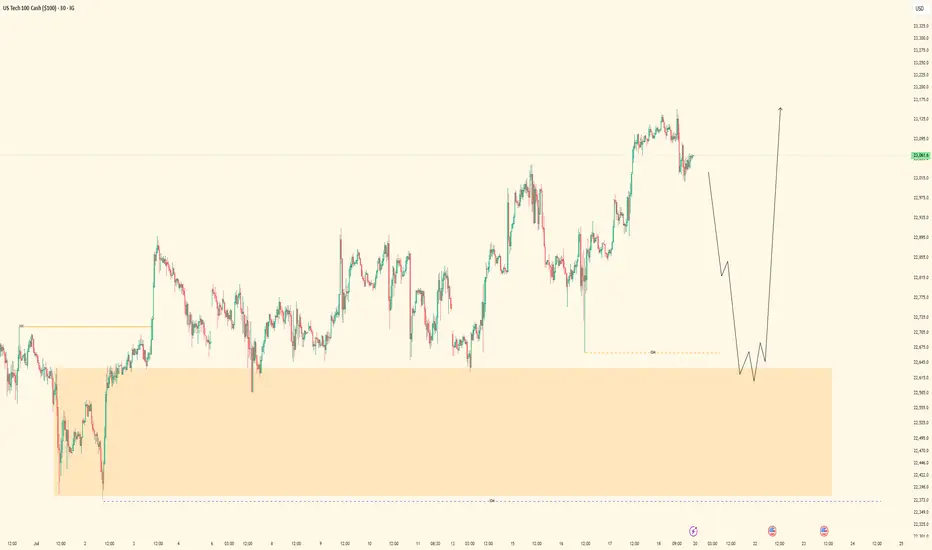
Properly navigating this ATH run in NASDAQ - No supply yetEverything is explained quickly in the video.
Main points:
1) Lows and bullish imbalances respected
2) It's very difficult to short without supply
3) May get cyclical take profit like previous years
Be sure to let me know what you think!

USDJPY
Date:
July 21,2025
Session:
New York Open
Pair:
USDJPY
Bias:
Long
1. Clean liquidity pool left unswept from last week's NYC Open (Thursday).
2. NY session typically retraces or extends from London reversal, giving directional momentum.
Entry:147.544
Stop Loss:147.250
Target:148.794
RR:4.11
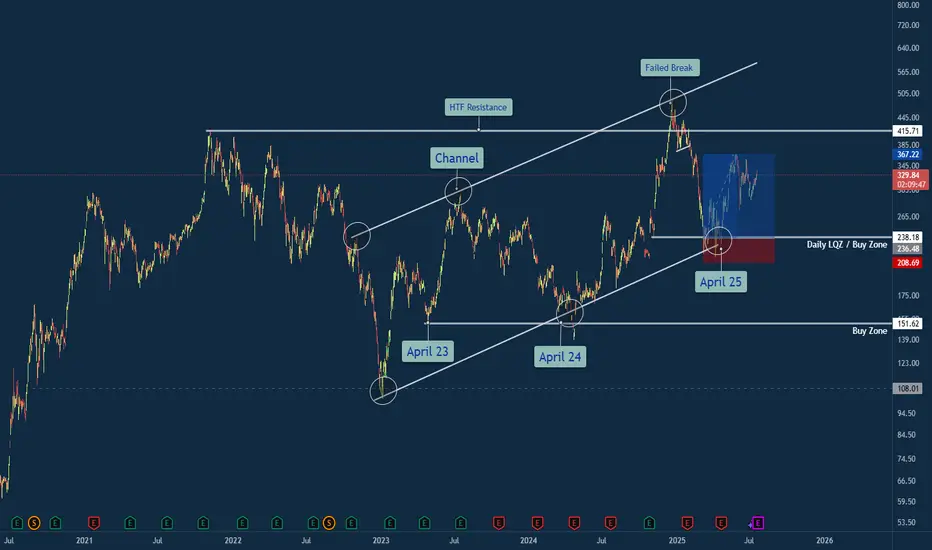
Tesla Trade Breakdown: The Power of Structure, Liquidity & ...🔍 Why This Trade Was Taken
🔹 Channel Structure + Liquidity Trap
Price rejected from a long-standing higher time frame resistance channel, making a false breakout above $500 — a classic sign of exhaustion. What followed was a sharp retracement into the lower bounds of the macro channel, aligning with my Daily LQZ (Liquidity Zone).
🔹 Buy Zone Confidence: April 25
I mapped the April 25th liquidity grab as a high-probability reversal date, especially with price landing in a confluence of:
Demand Zone
Trendline Support (from April 23 & April 24 anchor points)
Volume spike + reclaim of structure
🔹 Risk/Reward Favored Asymmetry
With a clear invalidation below $208 and targets at prior supply around $330+, the R:R on this trade was ideal (over 3:1 potential).
Lessons Reinforced
🎯 Structure Always Tells a Story: The macro channel held strong — even after a failed breakout attempt.
💧 Liquidity Zones Matter: Price gravitated toward where stops live — and then reversed sharply.
🧘♂️ Patience Beats Precision: The best trades don’t chase. They wait. This was one of them.
💬 Your Turn
How did you play TSLA this year? Were you watching the same channel? Drop your insights or charts below — let’s compare notes 👇
#TSLA #Tesla #SwingTrade #PriceAction #LiquidityZone #FailedBreakout #TechnicalAnalysis #TradingView #TradeRecap #ChannelSupport #SmartMoney
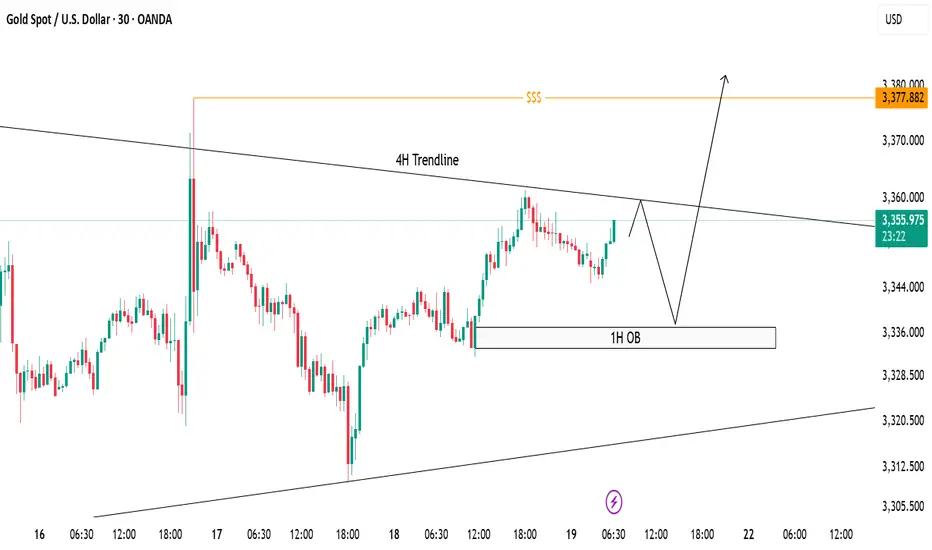
XAUUSD Trade Idea - 30m Structure with 4H ConfluenceCurrently, price is trading below the 4H descending trendline, respecting bearish structure on lower timeframe (30m).
✅ 1H Order Block (OB) marked between 3335-3340 remains a strong demand zone where price can bounce break the trendline to sweep liquidity above around 3377 to form bullish continuation.
📌 Scenarios I'm Watching:
Short-term rejection from the 4H trendline.
Potential reversal towards 1H OB.
Bullish reaction from OB could trigger a breakout above the 4H trendline.
Final upside target remains at the liquidity pool around 3377 zone ($$$).
🟣 Overall Bias: Bullish after liquidity sweep. Watching for bullish confirmation at OB before executing buys.
GBPJPY- UPDATED ANALYSIS GBPJPY Bias: Bullish HTF Overview (4H): Price remains in strong bullish structure, with higher highs continuing to break. No signs of deep pullbacks toward major SSLs, confirming strength in the current leg. LTF Confirmation (30M): Clean refined structure now visible. Market gave a textbook pullback into a fresh demand zone (30M OB) after sweeping minor liquidity. No need to expect a deeper move unless invalidated. Entry Zone: Watching for price reaction from the refined 30M OB. If price respects this level, I’ll drop to 5M for LH break → 1M for entry precision. Targets: Eyes on recent high as first TP, followed by extended targets if momentum continues. Mindset Note: Sometimes the best move is simply refining levels and letting the setup come to you. No rush, just alignment.

GBPJPY - Bullish Continuation Setup• Pair: GBPJPY
• Bias: Bullish (Buy)
• HTF Overview (4H):
• Strong bullish momentum with clear breaks to the upside.
• No signs of price reaching deeper 4H SSL — continuation more likely.
• MTF Refinement (30M):
• Watching for price to mitigate lower 30M OB zone.
• Expecting bullish continuation from that area.
• Entry Zone:
• Wait for LTF confirmation inside 30M OB.
• Switch to trader mode after valid CHoCH / intent confirmation.
• Targets:
• Structure highs / clean extension into the next liquidity pool.
• Mindset Note:
• Be patient, trust bullish structure. Let price come to you.
Bless Trading!

NAS100 - Bullish Trend Continuation Setup• Pair: NAS100 (Nasdaq)
• Bias: Bullish
• HTF Overview (4H):
• Strong bullish structure and momentum from last week.
• Price consistently printing higher highs with no signs of reversal.
• MTF Refinement (30M):
• Waiting for a clean sweep of SSL (sell-side liquidity).
• Looking for price to dip into 30M OB for continuation opportunity.
• Entry Zone:
• Watch 30M OB — once price sweeps liquidity and confirms, execute long.
• Targets:
• Structure highs / previous weekly highs.
• Mindset Note:
• Simple execution plan — ride the trend, trust the structure.
• Wait for confirmation before switching from analyst to trader mode.
Bless Trading!
EURUSD - Bullish Bias with Tactical Short Setup• Pair: EURUSD
• Bias: Bullish overall | Tactical short into demand
• HTF Overview (4H):
• Bullish structure confirmed.
• Price took out SSL liquidity — likely draw is internal structure OB below.
• Expecting deeper pullback before continuation.
• MTF Refinement (30M):
• Looking for price to sell off into 4H OB.
• Price already mitigated 30M OB and rejected — watching for follow-through.
• LTF Confirmation (5M):
• Still in analysis mode — waiting on a CHoCH from 5M OB.
• Green lines on chart reflect 5M internal structure.
• Entry Zone:
• Enter short only after 5M shift confirms.
• Ride short into 4H OB demand zone.
• Targets:
• Short-term: 30M lows.
• Major: 4H OB for bullish reaction.
• Mindset Note:
• No rush to enter — analysis leads, execution follows.
• Let price deliver confirmation before switching to trader mode.
Bless Trading!

GBPUSD - Bullish Bias with Tactical Short Setup• Pair: GBPUSD (GU)
• Bias: Bullish overall | Tactical short for OB mitigation
• HTF Overview (4H):
• Price broke major highs — clear bullish intent.
• Pullback last week suggests price is targeting 4H SSL for liquidity + OB mitigation before further upside.
• MTF Refinement (30M):
• Price structure currently presents a temporary sell bias.
• BSL has been taken — confirming liquidity sweep.
• Eyeing price to run lower into 4H OB zone.
• LTF Confirmation (5M/1M):
• Waiting on LTF confirmation to ride the move down into the 4H OB.
•Only entering after analysis is complete and CHoCH shows cleanly.
• Entry Zone:
• Tactical short after LTF confirms.
• Final long setup expected from 4H OB after mitigation.
• Targets:
• 30M lows as short-term target.
• 4H OB as the major zone for potential bullish reversal.
• Mindset Note:
• It’s analysis before execution.
• Staying in sync with HTF logic while sniping intraday plays for precision entries.
Bless Trading!

USDJPY - Bullish Structure in Play• Pair: USDJPY (UJ) • Bias: Bullish • HTF Overview (4H): • Clean external break to the upside confirms bull control heading into the new week. • Structure shift is undeniable — market bias is now favoring continued strength.
• MTF Refinement (30M): • Zoomed in to the 30M and identified internal liquidity (SSL) taken out. • Strong mitigation of internal OB followed. • Still in analysis mode — no trades taken yet.
• LTF Confirmation (5M): • Waiting on a refined CHoCH (marked by green lines at highs). • Once that prints and rules align, I’ll shift into trader mode for the execution.
• Entry Zone: • 30M OB mitigation + LTF (5M) CHoCH confirmation.
• Mindset Note: • Patience is the play. No guessing, no hesitation — just clean reads and precision strikes. • Analysis first, execution second. That’s the system.
Bless Trading!

XAUUSD - Bullish OutlookPair: XAUUSD (Gold) Bias: Bullish HTF Overview (4H): Price has taken major liquidity and mitigated a strong order block. We’re now seeing internal breaks of structure forming to the upside, indicating momentum toward the next high around 3440.000.
MTF Refinement (30M – 45M): Refined bullish structure is forming on the 30M chart, with clear signs of continuation. I’m watching for a deeper mitigation into the 30M OB where LTF confirmations (5M and below) will validate entry. The 45M helps provide a broader structure perspective and context.
Entry Zone: Pending — awaiting mitigation into the 30M OB + lower timeframe confirmation (i.e., 5M LH break or refined CHoCH).
Mindset Note: Currently in analyst mode — preparing for execution only after structure respects the top-down narrative. No rushing. Let price come to me.
Bless Trading!

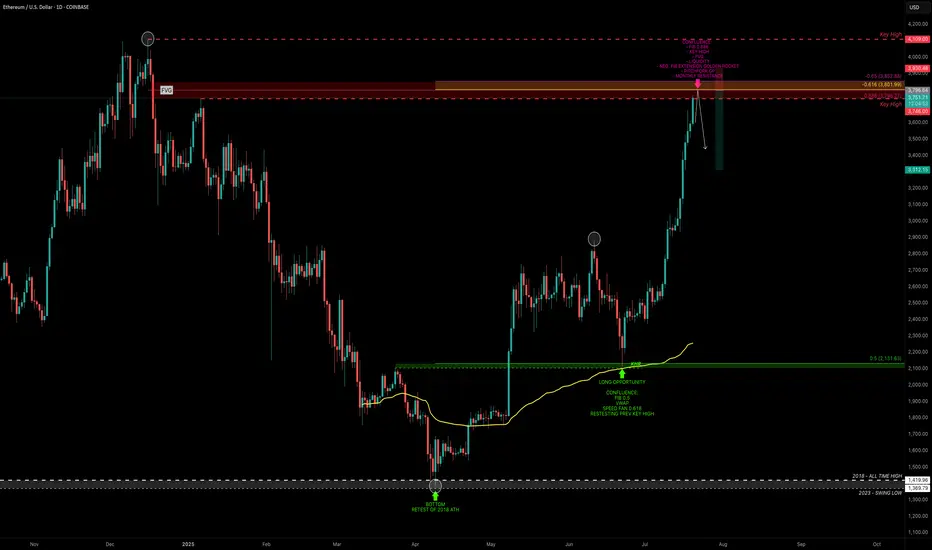
ETH — Rally Exhaustion or More Upside?ETH has been on an absolute tear. After retesting its old 2018 all-time high, it marked a bottom at $1383 — a brutal -66% correction over 114 days from the $4109 top.
From there, ETH ripped +100% in just one month, followed by 40 days of consolidation, and now, over the past 28 days, it’s surged another +76%, currently trading around $3715 — all without any major correction.
So the big question:
What’s next? Are we near a short setup, or is it time to long?
Let’s break it down.
🧩 Key Technicals
➡️ Bounce Zone:
On June 22, ETH retested the 0.5 fib ($2131.63) of the prior 5-wave Elliott impulse, with extra confluence from:
Anchored VWAP
Speed fan 0.618
➡️ Key Highs to Watch:
$3746 → recent local high
$4109 → 2021 all-time high
➡️ Fib Retracement Levels:
ETH has smashed through all major fibs, including the golden pocket (0.618–0.65) and 0.786 fib. The 0.886 fib at $3798.27 is the last major resistance, just above the $3746 key high.
At this zone, we also have:
Fair Value Gap (FVG)
Monthly Resistance
Negative Fib Extension Golden Pocket Target
➡️ Momentum Signal:
ETH is currently on its 8th consecutive bullish daily candle — historically, after 8–13 consecutive candles, price tends to cool off or correct. A sign to be cautious about longing here and consider profit-taking.
🔴 Short Trade Setup
Look for a potential SFP (swing failure pattern) at the key high $3746 to initiate a short trade.
This offers a low-risk setup with:
Entry: around $3746 (if SFP confirms)
Target (TP): ~$3300
Stop-loss: above SFP
R:R ≈ 1:4+
💡 Educational Insight: Why You Don’t Want to Long the Top
Markets often trap late longers near key highs or resistance zones — this is where smart money distributes while retail piles in emotionally.
Lesson: Look for zones of confluence (fib, VWAP, liquidity, FVG) and avoid chasing extended moves after multiple bullish candles.
Patience and confirmation at reversal points lead to higher-probability setups — you don’t need to catch every pump.
Final Thoughts
We’re approaching major highs, so this is a time for caution, not FOMO. Watch for reaction and potential reversals near $3750–$3850.
Stay sharp, manage risk — and remember, tops are where longs get trapped.
_________________________________
💬 If you found this helpful, drop a like and comment!
Want breakdowns of other charts? Leave your requests below.
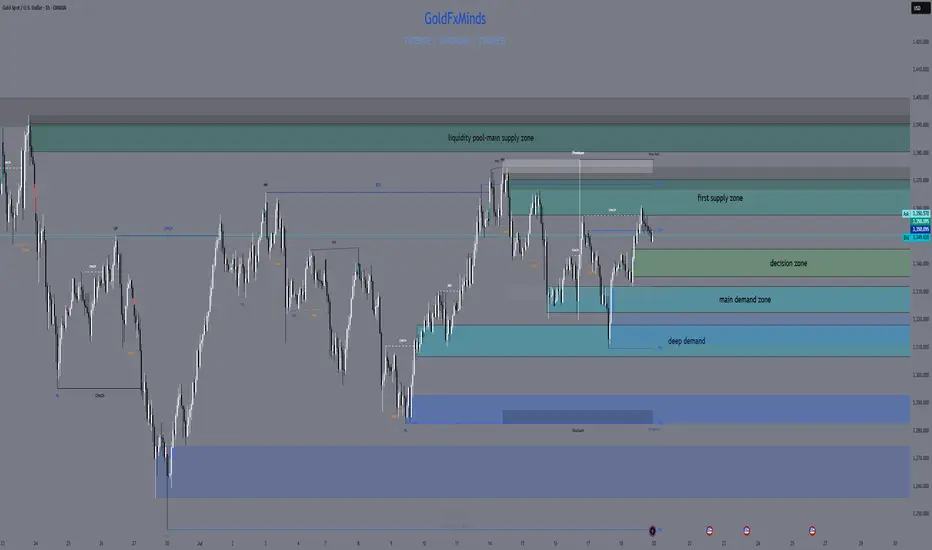
GOLD SNIPER PLAN – July 21, 2025Hey, GoldMinds! 🔥
This isn’t just another range day — it’s the type of market that separates disciplined snipers from impulsive chasers. If you want an edge, you need a plan that’s both sharper and more refined than what most see on their charts.
After a week full of fake breakouts, confusing swings, and whipsaw price action, gold is giving us the gift of clarity — but only for those patient enough to let the market reveal itself. Here’s how you cut through the noise and focus on the only zones that actually pay.
🚩 SELL ZONES
1. Primary Supply: 3358–3370
This is the fortress where real sellers pushed back hard. The structure here is crystal clear: last week’s failed breakout, sharp rejection, and a textbook H1/M30 order block. You want the sniper entry? Wait for price to tap here and only short if you see an instant, aggressive bearish response on M15/M5 — not just a slow drift.
2. Upper Liquidity Trap: 3380–3395
Classic trap for late buyers. This is where price loves to sweep stops and trigger emotional FOMO — but the real professionals are only interested if the move fails hard. Watch for a fake breakout and sudden reversal; this is the sniper zone for “fade and run” shorts.
⚪ DECISION ZONE (Neutral / Pivot)
Pivot Range: 3335–3345
Forget this level — it’s where amateurs get chopped up. There’s no order block, no real fair value gap, just confusion and false hope. A true sniper waits here, watching, not acting.
🟢 BUY ZONES
1. Main Demand: 3326–3332
This is the engine room for bulls: a refined order block, evidence of real absorption, and a history of sharp reversals. Don’t try to anticipate — let price come here and look for a snapback move on M15/M5. This is where patient buyers take their shot.
2. Deep Demand: 3311–3320
Where the fear turns to opportunity. This zone sits under recent lows, home to panic sweeps and emotional selling. Only consider a long if you see a powerful, impulsive bounce. The risk is high, but the reward for perfect timing is even higher.
BIAS & EXECUTION
Bias: Neutral, but watch for range expansion — the market is coiling for a bigger move.
Execution:
– Only act at the true edges, never in the middle.
– Let M5/M15 price action prove your setup — the market owes you nothing.
– If a zone breaks with momentum, do not fight the flow; stand aside or prepare for the next edge.
FINAL SHOT
This is where discipline pays.
Sniper trading is about letting the market come to you and striking only when your zone lights up with confirmation. Every other move is just noise, meant to shake out the impatient. Drop a comment below with the zone you’re watching most , follow and🚀🚀🚀 GoldFxMinds for daily sniper maps, and remember: in gold, only real structure pays.
Disclosure: Charts powered by Trade Nation. Educational content only.