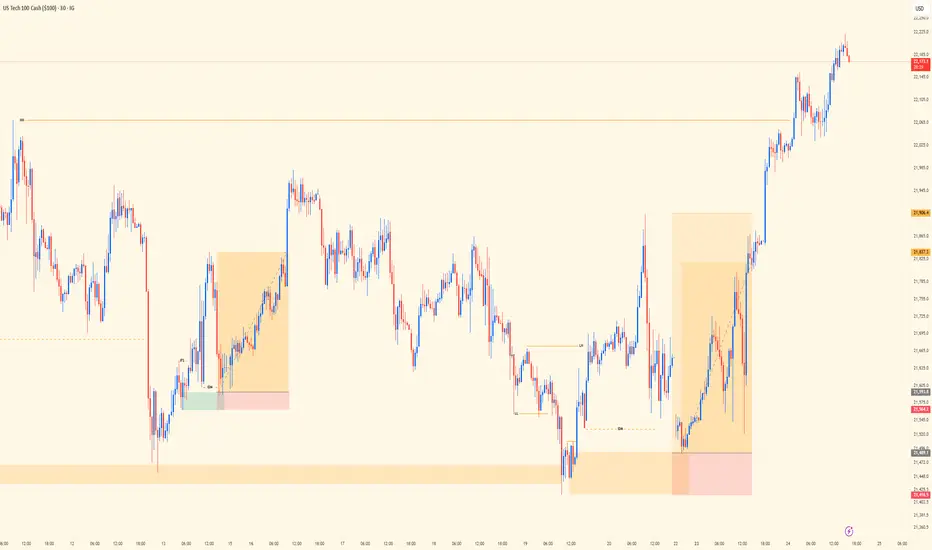
NASDAQ Midweek Review | Trend, Liquidity, PrecisionSingle-chart post today showing the execution trail behind two solid wins on NASDAQ.
Top-down bias was aligned — bulls clearly in control, so I stuck with trend direction. No need to fight momentum. As a trend trader, I don’t counter — that mindset shift alone is what keeps me consistent and clean with entries.
Chart shows the 30M view — where structure, liquidity, and timing came together. Both setups were built off elite structure reads. Liquidity played its part: manipulation, sweep, confirmation, and execution.
Bias: Bullish
HTF Alignment: Bullish trend continuation
Entry Frame: 30M precision
Key Insight: Liquidity isn’t noise — it’s narrative.
Mindset Note: Counter-trading is a shortcut to inconsistency. Stay with flow, respect structure.
Bless Trading!
Liquidity
EURUSD Midweek Outlook | 3H - 15M Dual ViewLeft side chart shows the 3H Bird’s Eye structure — price swept the recent highs but failed to follow through, signaling external bull weakness. That shift in narrative tells me price may be prepping to drop, potentially targeting the SSL below before gathering fuel to attack major highs.
Right side zooms in on the 15M — I’m patiently watching for a clean lower high to break (CHoCH) followed by a pullback to confirm a sell entry. Until I get that proper LTF trigger, I stay on the sidelines. Execution always follows alignment.
Bias: Short
HTF Structure: 3H sweep of highs, showing weakness
LTF View: Waiting for 15M confirmation (break + retest)
Target: SSL below
Mindset Note: Trade what’s shown, not what’s felt. Stay sharp, stay patient.
Bless Trading!

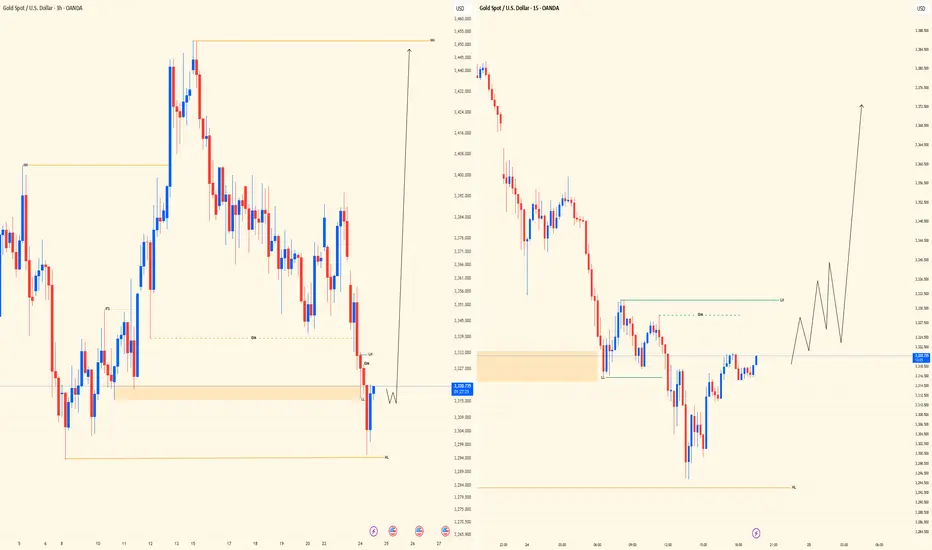
Midweek XAUUSD Insight | Dual View SetupPair: XAUUSD
Bias: Bullish
HTF Overview (Left Panel – 3H): Price action has been moving within bullish structure, with a major higher low currently holding strong. This HL is the key pivot I’m watching for continuation.
Refinement Zone (Middle – 30M): We’ve tapped into a 30M OB and are now sitting in mitigation territory. No signs of reversal yet, but the setup is maturing.
Entry Technique (Right Panel – 15M View): Just waiting for that classic Smart Money confirmation — LTF CHoCH, liquidity sweep, then return into OB. Will refine down to 5M for precise entry if price plays out clean.
Entry Zone: Waiting on confirmation around the OB zone
Target Zones: Based on HTF structure continuation
🧠 Mindset Note: Setup is solid, but patience wins. Let the story unfold — we only strike with clarity and precision.
Bless Trading!
GBPJPY| Midweek OutlookEven though it’s midweek, I wanted to share an update on GBPJPY and walk you through the process so far.
Price has been showing clear bullish structure from the 4H down to the 30M, so I remained patient and waited for price to revisit and mitigate a bullish order block — and that’s exactly what we got.
Now that mitigation has played out, I’m watching closely for LTF confirmations to line up. Ideally looking for entry opportunities around 196.006 – 195.922, depending on how the lower timeframes react and confirm.
Not rushing anything — just executing based on structure, mitigation, and confirmation. I’ll continue updating as price develops.
#GBPJPY #SMC #OrderBlock #SmartMoneyConcepts #PriceAction #ForexTrading #GJSetup #MidweekOutlook #InducementKing #DayTrader
Bless Trading!

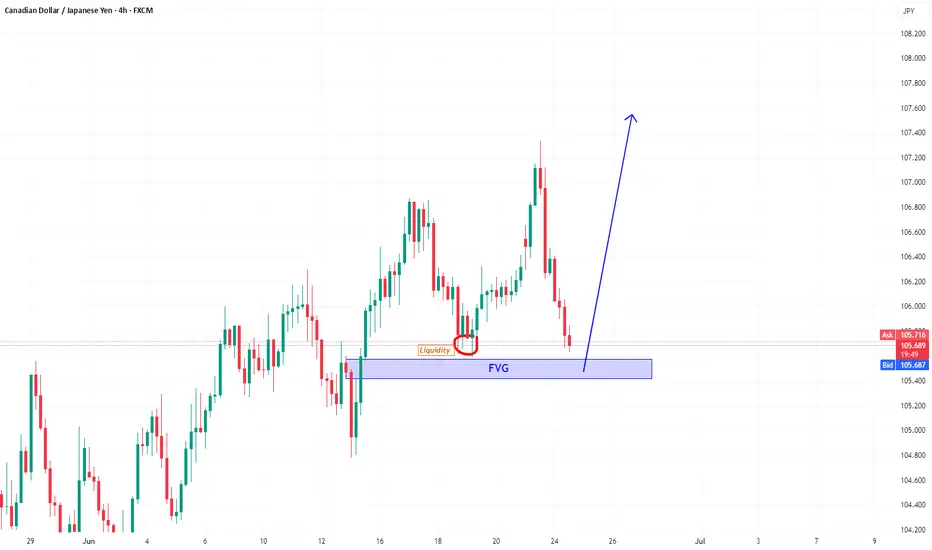
CADJPYHaigh Bullish opportunity.
Price will rebound from FVG area which never touch before ,Also will sweep the previous liquidity which not taken before
CADCHF bullish Price will rebound from FVG area which never touch before , Target next liquidity area.

Buying the Top Was the TrapEURGBP has just broken structure on the 1H chart and is showing strong momentum to the downside. After taking out a key low, price is now sitting in a vulnerable spot, with a potential push even lower on the table .
A fair value gap sits just above, and price might return there before continuing its move down. If that happens, it could set up a clean lower high and another leg into the previous low.
This setup looks promising, but as always, wait for a shift in character on the lower timeframe before making any decisions . If that shift doesn't happen, price could still run deeper before any reaction.

The Trap Has Been Set. Will Price Take the Bait?EURNZD just broke structure on the 4H chart and is now pulling back into a zone where things could get interesting. After the initial drop, price is retracing into an area filled with imbalance and liquidity.
This looks like a setup where the market may lure in buyers before making its next move lower. If sellers step in where expected, we could see a clean continuation to the downside.
As long as price remains beneath that reaction zone, the bearish narrative stays intact. One to keep an eye on in the coming sessions.
Just a word of caution : Always wait for a clear change of character on the 15-minute timeframe before considering any entry. If that confirmation doesn’t show up, price can easily break through the zone and continue climbing.

US30 - Intraday long scalp then short Looking for that intraday scalp on the long around 120 points can hold potentially further up to our higher supply level. If bearish PA is confirmed around the 43,000 level can look to take this short. All dependent on PA.

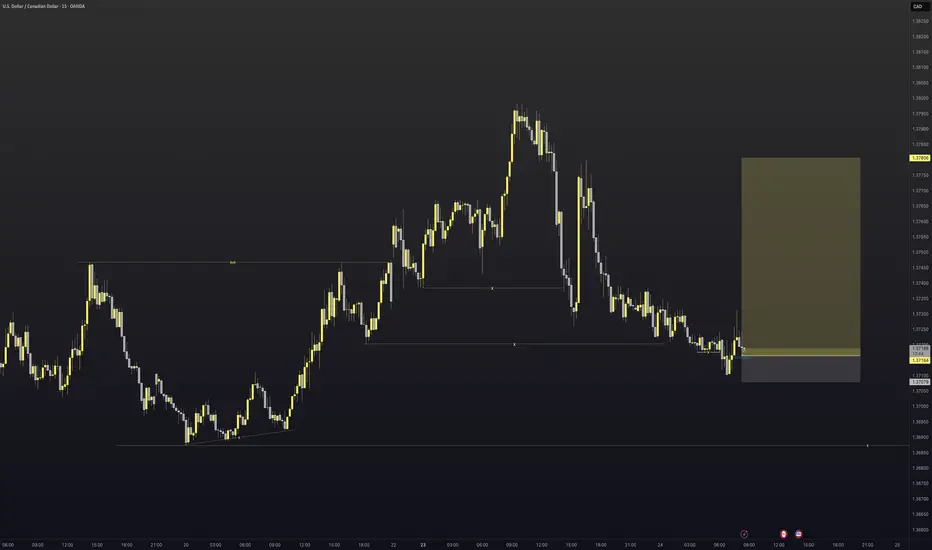
USDCAD - Long triggered We have entered into the discount area of the most recent swing point on USDCAD. With doing this we have taken out all the areas of liquidity within the trading range so it was time to look for potential long moves.
Now at current price we have had a great example of AMD where by we
Accumulate
Manipulate
and then the hope is that we begin to distribute higher.
There was also a nice fair value gap that was left behind on the 5min
So all that was left to do was execute.
Let us see how it plays out.
Win or lose great entry super happy with the trade. Lets see how it goes
AUDJPY - Potential Short at the upper supply liquidity levelLooking for the potential short, only valid with bearish PA around the upper supply level, ideally sweeping the upper level of liquidity around 94.400-94.405. Bearish PA then bring this trade down.

XAUUSD Daily Sniper Plan – Monday, June 23, 2025Current Price: 3368.76
Trend: Bearish on H4 | Corrective on H1 | Weak Bullish Attempt on M15
Market Context: Gold is consolidating under EMA pressure after FOMC. Price is pinned inside a key flip zone, awaiting Monday’s fundamental triggers.
🔸 HTF Overview (D1, H4, H1)
📰 Macro + Economic Context – Week of June 23–28:
This is a high-impact week for USD with Fed speeches, inflation, and growth data. Monday opens with caution:
Monday, June 23
🟠 FOMC Member Waller Speaks
🔴 Flash Manufacturing & Services PMI
🟠 Existing Home Sales
Tuesday, June 24
🔴 Fed Chair Powell Testifies
🟠 CB Consumer Confidence
🟠 Richmond Manufacturing Index
Wednesday, June 25
🔴 Powell Testimony (Day 2)
🟠 New Home Sales
Thursday, June 26
🔴 Final GDP q/q
🔴 Unemployment Claims
🟠 Durable Goods Orders
🟠 Pending Home Sales
Friday, June 27
🔴 Core PCE Price Index
🟠 Revised UoM Consumer Sentiment
📌 Monday is lighter in impact, but PMI data and Waller’s speech may spark the week’s directional bias. Avoid trading blindly into PMI spikes.
H4 Structure & Bias:
Bearish trend intact: Lower High = 3418, Lower Low = 3311
EMAs (21/50/100) aligned downward — price capped below 3380
RSI still under 60 = no bullish momentum
Rejection zone remains valid at 3406–3420 (H4 OB)
Strong demand expected at 3340–3352 and extreme at 3310–3288
🔸 LTF Precision (M30, M15)
Price compressing around 3365–3372
RSI around 56 → indecision
No bullish HH above 3380 = still within bearish control
EMA flattening → prepare for trap setups around NY open
🧭 Trade Scenarios
🔻 Sell Zone – 3406–3420
H4 OB, FVG top, liquidity above 3405
Entry: 3412
SL: 3426
TP1: 3312
TP2: 3288
TP3: 3265
🧠 Wait for sweep or strong bearish reaction — no early entries.
⚠️ Flip Zone – 3360–3380
No-trade zone: EMA cluster + mid-FVG
Only use for confirmations, not entries
🟢 Buy Zone – 3340–3352
OB + demand + Fib retracement
Entry: 3348
SL: 3334
TP1: 3448
TP2: 3472
TP3: 3490
🟢 Buy Zone – 3310–3288
Below LL sweep (3311)
Deep liquidity + OB demand
Entry: 3298
SL: 3280
TP1: 3365
TP2: 3405
TP3: 3440
📍 Key Structural Levels – June 23
Level Type Role
3460 Bull Trap Limit Irrational spike area
3445 FOMC Unfilled wick – trap zone
3426 Sell Zone Risk protection above OB
3418 H4 LH Confirmed bearish structure
3410 OB Midpoint Micro-rejection inside OB
3395 Previous HH Inducement target
3384 FVG Top Minor LTF rejection
3360–3380 ⚠️ Flip Zone MA/FVG compression – avoid entries
3352 OB entry edge Buy Zone 1 upper limit
3340 OB base Buy Zone 1 key level
3311 H4 LL Confirms bear structure
3300 Round Level Psychological + liquidity
3288 OB base Final demand structure zone
3265 Final TP Bearish extension only
✅ Final Action Plan
📉 Stay bearish below 3380 unless a clean HH + OB support forms
⚠️ Avoid trading inside 3360–3380 flip zone during NY PMI data
🛒 Longs valid only from 3340 or 3310 with confirmation (RSI, PA, OB)
🧠 Focus on structure integrity and clean OB rejections only
💬 Will you fade the 3412 OB or wait for the sniper bounce at 3348?
🔔 Follow and 🚀@GoldFxMinds for premium breakdowns, macro updates, and real-time sniper execution guidance.
🔹 Disclosure: As part of Trade Nation’s Influencer Program, we receive monthly compensation for using their charts.
GoldFxMinds

Bitcoin's Failed 60-Day Cycle: Relief Rally Before More DownsideBitcoin has officially failed its current 60-day cycle by breaking below the previous cycle low on June 5th, touching $100,000. This marks a key structural shift that traders should not ignore.
📉 What’s Next? Likely Scenario:
The highest probability setup now is a relief rally toward the Stoch RSI highs on the 1-Day and 3-Day timeframes, followed by a move downward into the 60-day cycle low, projected to form between late July and early August. This aligns with a potential retest of the Value Area Low from April, a key support zone to watch.
📈 Upside Target:
If we do see bullish continuation in the short term, the main upside target is $105,000. This level is significant as it clusters three Weekly Point of Control (POC) levels from May and June, making it a high-liquidity magnet for price. Historically, Bitcoin tends to gravitate toward these levels when several align closely.
💼 Current Positioning:
I’m currently long BTC and ETH, and I’m watching closely for Stoch RSI to top out on the 1-Day and 3-Day timeframes. I’ll look to reduce or exit those positions as we approach those cycle peaks.
🔔 Pro Tip: Price often seeks out stacked POC levels. If you’re a volume profile trader, keep $105K on your radar.
📌 P.S. For access to my custom indicators and deeper cycle analysis, check the description in my profile.

XAUUSD| Weekly OutlookStill holding the same idea going into this week — waiting on that 30-minute mitigation to confirm bullish intent.
Until price delivers that, I’m staying patient and letting the market open up. No need to force anything. Let structure lead.
Bless Trading!

EURUSD| Weekly OutlookSame story as last week — still patiently waiting for the major engineered liquidity above to get cleared before considering any meaningful longs.
That said, EU is currently offering a clean structure for short setups into the downside order block. Everything is lining up technically, but it’s important to note this is a counter-trend move — and personally, I’m not taking it.
It’s tempting when structure looks this clean, but I know it’s not my proper approach. For me, the real play is still higher — waiting on that bull-side OB mitigation to align with the bigger picture narrative. Until then, I’ll let others chase while I sit on my hands. Pure discipline only.
Bless Trading!

AUDUSD Potential Long - Dependent on PA Market openAUD/USD Long Setup – 15M Chart Analysis
Looking at a potential long on AUD/USD after price tapped into demand and swept liquidity. The area aligns with a fair value gap and previous order block, suggesting interest from larger players.
Two Entry Options:
1. Aggressive: Buy limit at the order block (riskier, no confirmation).
2. Conservative: Wait for break of structure, then retest into FVG with bullish price action for confirmation.
Targets:
Target 1: 0.6470
Target 2: 0.6480
Target 3: 0.6490
Extended Target: 0.6530 (only if 0.6490 is breached and price holds above)
Important Notes:
This setup is forecast-based and depends on how price opens and reacts.
Entry should follow a clear confirmation, especially after a liquidity sweep.
Ideal confirmation: Break of structure followed by a retest with bullish PA on lower timeframes (M5/M1).
Invalidation: A clean break and close below 0.6430 would invalidate this idea.
Stay disciplined. Trade the plan, not the prediction.

EURUSD to Retest 1.16 regionWatching the 1.1490–1.1450 zone for a potential bullish reaction. This area includes a 4H Fair Value Gap and Order Block. If price gives a 15M CoCH within this range, I’ll look to enter long.
Targets: 1.1540, 1.1570, and 1.1610
Invalidation below 1.1440
Patience until price delivers a clear setup.

Bitcoin - Will it explode up or down?Introduction
Bitcoin (BTC) is currently trading within a symmetrical triangle pattern, forming a series of higher lows and lower highs. This price action indicates a tightening range as the market approaches the apex of the triangle. A breakout is becoming increasingly likely in the coming days, and traders are now watching closely to see which direction BTC will choose. Will it break to the upside or the downside?
Pattern Trading
The symmetrical triangle has been a consistent feature of BTC’s recent price action. Price has been oscillating between the descending resistance and ascending support trendlines, gradually compressing the range. Based on the current structure, Bitcoin could continue moving within this pattern until around June 26th, when the triangle becomes extremely narrow and a breakout becomes imminent. Historically, such setups can produce false breakouts or “fake-outs,” where the price temporarily moves in one direction before sharply reversing and breaking out in the opposite direction. These moves often trap traders who enter too early, so caution is advised. Market manipulation is not uncommon in these tight formations, making it essential to wait for confirmation before entering a position.
4H Fair Value Gap (FVG)
Bitcoin has recently filled a 4-hour Fair Value Gap (FVG), a zone that often attracts price due to inefficiencies in the market. Now that this gap has been filled, there could be increased selling pressure, potentially pushing BTC back down toward the lower boundary of the triangle. If BTC is unable to break through the resistance created by this FVG, we may see more bearish momentum. However, should BTC manage to break and hold above this imbalance zone, it would be a strong sign of bullish intent and could open the door for a move to the upside. For now, though, this area remains a significant resistance level.
Upside Target
If BTC manages to break out of the triangle to the upside with strong volume and confirmation, the first major resistance level is around $109,000. This would be a logical target for bulls, as it represents a key zone of liquidity and previous interest. A successful move toward this level would confirm the bullish breakout and could set the stage for further gains, depending on broader market sentiment.
Downside Targets
Conversely, if BTC breaks below the lower trendline of the triangle, the first area to watch is around $103,500. This level is where a significant amount of liquidity has built up, and it could act as initial support. However, if that level fails to hold, the next key psychological level to watch would be $100,000. A drop below this milestone could trigger panic selling and further downside, especially if market sentiment turns negative.
Conclusion
At this point, BTC is at a critical juncture, and traders should remain patient as the market decides its next direction. While the current rejection from the 4H FVG suggests some short-term bearish pressure, the overall pattern remains neutral until a confirmed breakout occurs. Trading within the triangle can be risky due to the possibility of fake-outs, so it’s best to wait for clear confirmation before committing to a trade. Stay cautious, manage your risk carefully, and prepare for volatility as Bitcoin approaches a decisive move.
Disclosure: I am part of Trade Nation's Influencer program and receive a monthly fee for using their TradingView charts in my analysis.
Thanks for your support.
- Make sure to follow me so you don't miss out on the next analysis!
- Drop a like and leave a comment!

*USDJPY| Weekly Breakdown - Bulls Took OverUJ was all bullish this week, no question about it. The chart made it clear—30M structure stayed intact, and market flow shifted heavily in favor of the buyers.
Liquidity was taken along the way, with higher lows stacking up clean, setting the stage for further continuation to the upside.
Not overcomplicating this one—bulls won the battle, and structure confirmed it. Now we look for smart ways to join that strength as price builds momentum into next week.
Stay with the flow, not against it.
Bless Trading!

*NAS100| Weekly Breakdown - Structure Is PriceWhew—Nasdaq was a wild one this week, but once you master structure, liquidity, and OBs, the chaos turns into clarity.
Price held my 30M demand zone, even after a sketchy wick-based reaction early on. First long position? Quick scalp to the highs—in and out, no burger 🍔.
Didn’t wait for a full mitigation at first—anticipated the bullish momentum by staying aligned with structure. Later, price came back and mitigated the zone with body closes, confirming the intent for another long setup into next week.
Yes, I hold trades over weekends—because here’s what I’ve figured out:
“Price is structure. Structure is price. Master that, and it flows exactly how it should.”
This week was just another example of that.
Bless Trading!

*GBPUSD | Weekly Breakdown - Patience Over PressureThis week, GU didn’t follow the original script, and that’s perfectly fine. No forced trades, no ego—we sat back and let price do what it needed to do.
Price broke straight through the 30M demand zone, showing clear bearish intent. That shift redirected my focus to the 4H demand, which held strong and gave us the real story.
Now the play is simple: I’m waiting for price to retrace back to mitigate the 30M zone, then I’ll look for continuation sales aligned with that new HTF momentum.
No stress—just adjusted bias, preserved capital, and waited for the next clean setup.
We don’t chase—we position. 😉
Bless Trading!

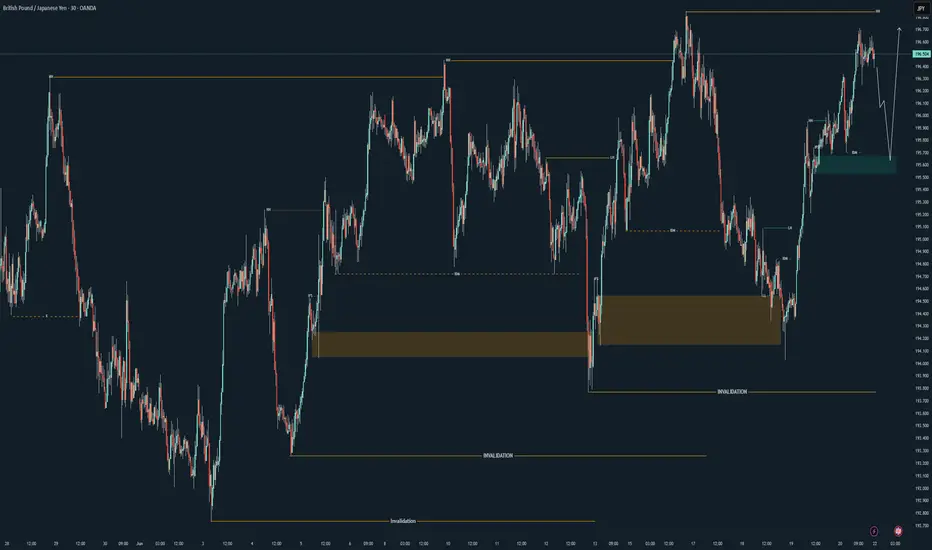
*GBPJPY Weekly Breakdown - Structure + PrecisionThis week, GJ moved exactly how it was supposed to—clean structure, proper mitigation, and follow-through.
Price respected the bullish flow all week, tapping into a refined 30M order block (green zone) before lifting off. That zone did its job—mitigated, held, and set the tone for the next leg up. No need to force anything here—just fundamentals and execution.
We’re still holding higher lows, and unless structure says otherwise, I’m expecting continuation next week with a clean break of those highs.
Simple reads. Clean execution.
This is how we do it. 😉
Bless Trading!
EURUSD - 2nd potential entryEvening all
Here is a still screenshot of what I am looking for the market open on EURUSD come Sunday night after the spreads have died down on the pair.
My pending order will go directly on the FVG with my stops below the manipulation of the range.
If I get tagged in great. If I don't also great if we continue to move high I mill just manage the one position.
If I am tagged in I will give you and update with a new idea and then depending on how that idea plays out win or lose I will come back and re-visit it and break it down some more.
However I have high hopes for this trade to make it up to 1.16300
Have a great weekend
and I will speak to you all soon
