Battle Plan – 30 JuneHey, Snipers! It’s Sunday night, the real ones are back on the charts and the tourists are out of the game.
Last week, gold tried every trick in the book: fake bounces, liquidity sweeps, endless bearish grind. Every move up got sold. If you traded like a sniper, you’re still standing. If you chased dips blindly, you’re probably licking your wounds.
🌍Macro snapshot:
Dollar’s holding firm — no rescue from US news, just choppy reactions.
War headlines are everywhere, but structure is king: EMAs are stacked, every rally is just bait for liquidity.
Market’s running on fear and patience. Fast money gets chopped, disciplined money survives.
Sniper Mindset:
⛔No bias, no forced trades. The real win is in the waiting.
Structure will show you who’s in control — your job is to react, not predict.
🥷 GoldFxMinds Battle Plan – 30 June (Trade Nation Feed)
Demand (Buy) Zones:
3265–3245: The “half-mitigated” trap. Most buyers are already underwater — we wait for a real PA shift. First green candle? Ignore it. Let them get trapped.
3215–3200: This is the sniper zone for real discount hunters. If price freefalls, we watch for exhaustion, divergence, and a proper story. One clean engulfing here and the bounce can be massive.
3180–3160: Only for flash crash days — this is where pain turns into opportunity. But you wait for panic, not “hope trades.”
Supply (Sell) Zones:
3287–3300: First sell window — if price spikes, watch for that classic NY liquidity grab and an instant rejection.
3320–3335: The “don’t even try to buy here” zone. OB, FVG, and every EMA lines up — if the market gets here, expect a brutal fade.
3345–3360: Premium fantasy land for sellers. If bulls get cocky, this is where the big shorts reload for the next leg down.
🧠Sniper Mindset:
EMAs stacked above? No dreams, only discipline.
No confirmation in your zone? Stand down — the market isn’t your friend.
Most traders buy “cheap” — we buy right.
If the story’s not clear, patience pays. The first bounce is a trap, the second is the setup.
📝June’s about to end. Let’s close it out with surgical entries and sniper exits.
Stay sharp, stay humble, and let the crowd chase while we collect.
🧠Remember: green candles aren’t invitations, they’re traps for the impatient.
Wait for confluence, act on logic, and journal every single lesson.
Gold rewards discipline — not luck.
If you’re serious about gold, learn this:
Zone + confluence + confirmation = sniper entry.
Anything else is just gambling with a nice chart.
Review your trades, journal your mistakes, and stop blaming the market for your impatience.
Hit like🚀, follow, and drop your trading question if you want the next level.
See you on the Trade Nation feed.
Liquidityhunt

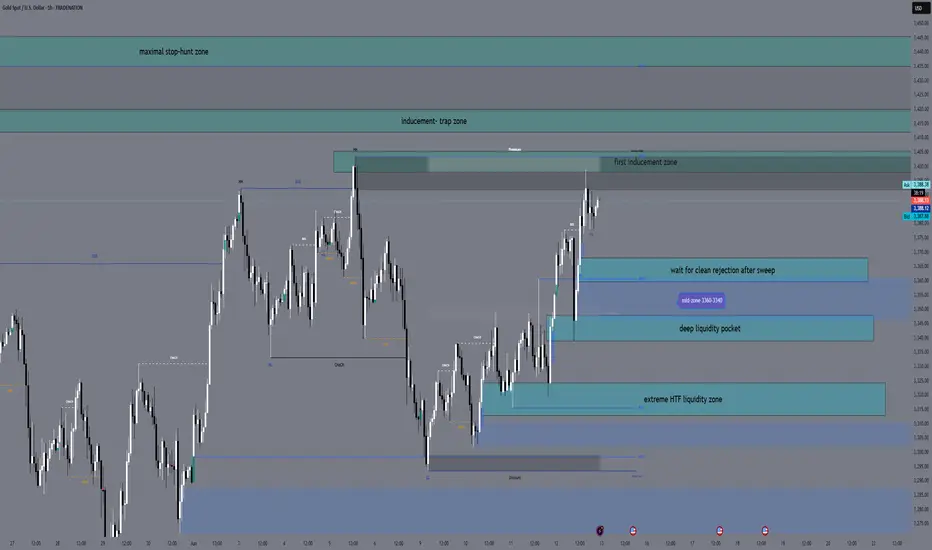
XAUUSD Daily Plan — June 13, 2025 By GoldFxMinds👋 Hello traders, and welcome to your full preparation for tomorrow’s gold session.
Gold continues to respect its structural map while liquidity traps remain active on both sides of the range. We’ve seen clean sweeps and fast reactions this week, but tomorrow brings a new catalyst: key U.S. data combined with fresh geopolitical tensions that may fuel additional volatility before the weekly close.
🌐 MACRO & GEOPOLITICAL OUTLOOK:
📊 Prelim UoM Consumer Sentiment & Inflation Expectations are scheduled tomorrow:
Consumer Sentiment ➔ 52.2
Inflation Expectations ➔ 6.6%
These data points often trigger sharp USD moves and liquidity grabs.
🌍 Geopolitical tension has increased as President Trump authorized the evacuation of U.S. personnel from several Middle East locations due to rising threats in the region, particularly concerning the Iran nuclear situation.
This development triggered sharp moves across commodities, with oil rallying strongly.
Gold remains well-supported in this environment as global risk sentiment deteriorates.
Traders should expect elevated intraday volatility and potential liquidity sweeps on both sides as markets digest these developments.
🔎 The combination of macro data and geopolitical risk creates highly reactive conditions where liquidity hunts may precede any clear directional moves.
🔎 STRUCTURE OVERVIEW:
Price remains inside premium territory after recent bullish expansions.
Liquidity has already been taken above and below earlier this week, but additional traps may unfold before Friday’s close.
Larger structure remains bullish while short-term supply zones may attract quick inducements.
Tomorrow's flow will likely begin with manipulation during or after news, before real momentum develops.
🎯 BIAS
Main bias: Controlled bullish, but highly reactive inside premium.
As long as price holds above 3340, bulls remain in control on higher timeframe.
However, premium zones above 3395 may act as liquidity traps, inviting fast selloffs after inducements.
Best opportunities likely to come from either:
Controlled retracement into buy zones for continuation higher.
Fast spikes into premium traps for short-term sell opportunities.
Patience will be critical as both news and geopolitical headlines may trigger manipulations before real trend unfolds.
🔑 KEY ZONES TO WATCH:
BUY ZONES
🔵 3368 - 3360
Intraday pullback zone.
Look for minor liquidity dips followed by bullish rejection.
Targets: 3390 → 3405.
🔵 3348 - 3340
Deeper liquidity pocket into H4 imbalance and OB.
Engage only after strong downside sweep with sharp bullish reaction.
Targets: 3380 → 3396.
🔵 3325 - 3312
Extreme HTF liquidity zone.
Valid only if aggressive liquidation occurs into deeper discount.
Targets: 3360 → 3380.
SELL ZONES
🔴 3398 - 3405
First premium inducement area.
Look for fast spikes with M15 bearish rejection candles.
Targets: 3370 → 3348.
🔴 3412 - 3420
Secondary premium trap zone.
Valid only after upside wick rejection.
Targets: 3385 → 3355.
🔴 3435 - 3445
Maximum stop-hunt exhaustion zone.
Only valid if price aggressively squeezes into final liquidity.
Targets: 3390 → 3360.
⚠ TRADING REMINDER:
Friday’s session will likely be driven by both news and geopolitical headlines. Let liquidity play out inside the zones, wait for clear rejection signals, and execute with full confirmation. No chasing — sniper discipline only. 🎯
💎 Hit that 🚀 if you found this plan helpful.
👉 Feel free to follow for daily gold plans and share your thoughts in the comments.
We remain disciplined. We trade structure.
🌙 Rest well tonight — tomorrow we execute with precision and control.
— GoldFxMinds
Mastering Liquidity Dynamics: Understand the Dynamic True ValueDear Reader,
Thank you for reading—your time is valuable.
Use the chart's zoom-in/out (-/+) function for better visibility. This chart captures a large sample for your evaluation.
Below is the manual detailing the Smart Farmer System —a Dynamic True Value framework derived from real-time data to anticipate market intent and liquidity behavior .
If this resonates with you, drop a comment below— constructive insights are always welcome .
The Dynamic True Value - a Smart Farmer System: Terminology and Mechanics
: For now, I have firmed up POC - Price of Control, VAP - Value Average Pricing, SULB - Sell Upper Limit Bound, BLLB - Buy Lower Limit Bound.
Mechanic:
POC - Where fair value price dynamic is read.
VAP - Trading above indicates bullish sentiment of the cycle, and the opposite for bearish sentiment.
A crossed over of:
Grey POC above Green VAP - Signaling distribution, accumulation, consolidation, build-ups, correction, retracement .
Green VAP above Grey POC - Bullish strength and momentum consistency .
Pink VAP above Black POC - Bearish strength and momentum consistency .
Flip of Pink VAP to Green VAP - Sentiment flips from bear to bull, and the same goes for green flip to pink showing bull to bear.
Validation of entry signals requires:
Signal's candle must close past the opposite side of POC – flip sentiment .
The confirmation candle (is the closed next candle immediately after entry signal candle) must continue closed past the POC – maintain sentiment .
The progress candle (is the next candle closed right after the Confirmation Candle) shows traction, momentum build-up, and volume consistency .
Hint of invalidation:
Signal's candle is considered void if the next candle prints a new entry signal in the opposite direction. This often signals accumulation, sideways movement, build-up, uncertainty, or swings in range .
The immediate next candle closed past POC to the opposite side.
What to understand about Liquidity Trap, SULB, and BLLB:
Liquidity traps
Often occur at the recent/previous flatlines of Dynamic True Value (POC, VAP, SULB, BLLB) .
It is worth paying attention to the market’s intent and institutional positioning.
Signs of exhaustion, absorption, inducement, offloading, and accumulation are visible in the M1 (one-minute) TF, with significant confluence near the previous/recent flatlines of Dynamic True Value in the higher/macro-TFs.
An Anchored VWAP tool can be helpful for filtering noise in the market. This tool can be found in the drawing tab in the TradingView platform.
SULB
Details the dynamic of upper resistance where Bears remain in control below the dynamic level.
Below this limit bound (LB) , bears show strength – bear sentiment .
A converging price toward this LB indicates bulls are present.
Moving past this LB (a candle closed above) and successfully RETESTING newly formed support indicates a confirmed directional shift . Followed by printing a new BLLB in the next following candles with price continuing to rise above this failed SULB.
A rejection below LB (a rejection/exhausted candle closed below LB) and successful RETEST reaffirms the resistance holds , indicating downside continuation .
BLLB
Details the dynamic of lower support where Bulls remain in control above the dynamic level.
Above this LB, bulls show strength – bull sentiment .
A converging price toward this LB signifies bears are present.
Moving past this LB (a candle closed below) and successfully RETESTING newly formed resistance indicates a confirmed directional shift . Followed by printing a new SULB in the next following candles with price continuing to push lower below this failed BLLB.
A rejection above LB (a rejection/exhausted candle closed above LB) and successful RETEST reaffirms the support holds , indicating upward continuation .
Important Notes:
Select preferred Entry’s Signal TF (ex. M3 TF, M5 TF for scalping strategy, M15 for intraday/daily strategy, 4H TF for day-to-weekly strategy, etc.).
Always refer to the selected Entry’s TF for trading progress. Anticipate TP and SL by watching the range in this TF.
Non-entry TFs are not for entry purposes. These multi-TFs are used for measuring strength, momentum, liquidity, positioning, structure – The market intends . The Non-entry TF is used to anticipate institutional executions and liquidity pools.
These criteria MUST BE MET. A failed criterion suggests vague execution. Be patient and wait for clear validations.
Institutions excel in creating illusions.
SFS is designed to stand ready, calm, and execute with Clarity.
SFS cuts through noise, distraction, and stays independent of NEWS, GEOPOLITIC, RUMORS, and herd mentality because all these are designed to mislead retail traders into institutional traps.
When we see such ambiguity against the criteria, we know not to fall into the TRAP and become the liquidity FUEL.
Stay sharp, only respond when signals are firmed. SFS is designed to counter Smart Money capitalism. It is about time to level the playing field.

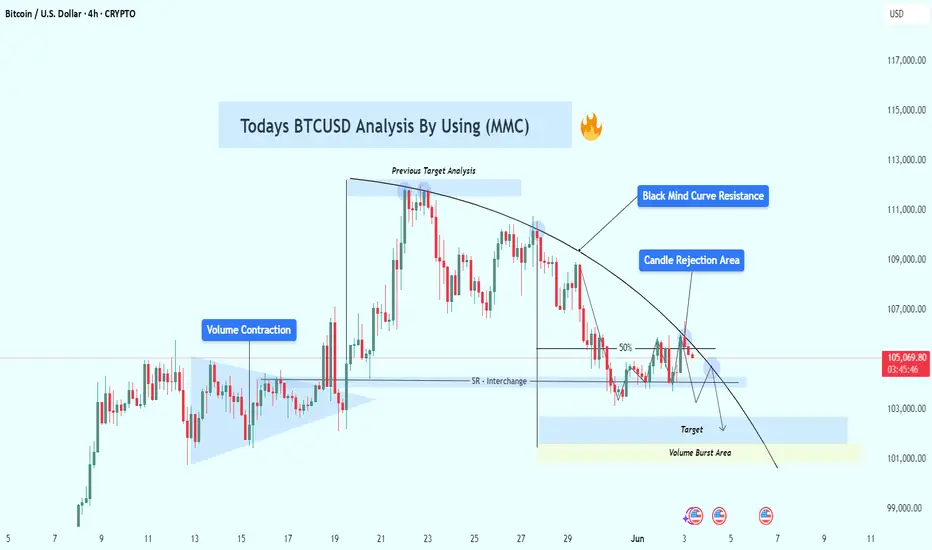
BTCUSD Analysis Using MMC – Bearish Rejection & Target🔷 Introduction:
Bitcoin is showing classic Market Maker manipulation at work—volume compression, false breakouts, support-resistance flips, and a fading rally under a well-defined descending curve.
This post offers a deep dive into the true intentions of smart money behind recent price actions, helping traders avoid traps and align with institutional moves.
🔎 Detailed Breakdown of Chart Structure:
🧱 1. Volume Contraction Zone – The Calm Before the Storm
📅 Period: May 13–18
Price consolidates within a symmetrical triangle pattern.
Volume steadily decreases as price tightens – a sign that market makers are accumulating positions while keeping volatility low.
This low-volume phase creates uncertainty for retail traders, shaking out weak hands and building a base for a deceptive breakout.
🔍 MMC Insight: Market Makers reduce volatility to absorb liquidity without alerting the market to their accumulation. This builds energy for a manipulated move.
📌 2. False Breakout to Previous Target Zone (~$110,000)
📅 May 20–23
A sudden bullish impulse takes price to the previous target zone, marked as a key area of historical liquidity.
Retail traders enter late long positions at this stage, anticipating further breakout.
🎯 But instead:
Price swiftly rejects from this level, forming long upper wicks and bearish engulfing candles.
This move is a liquidity sweep, where smart money offloads positions to late buyers.
🔍 MMC Insight: Institutions engineer a breakout to bait traders, only to dump into the momentum they create.
🔁 3. SR Interchange (Support Flips to Resistance)
📅 May 27–June 2
Former support around $104,000 – $105,000 is broken and then retested from below.
Price attempts to reclaim it, but fails—each touch results in rejection.
This confirms the area has flipped to resistance, aligning with MMC’s SR Interchange Rule.
📉 Significance: This zone now acts as a control point where market makers defend short positions.
🚫 4. Candle Rejection Area – Curved Trendline Resistance
A visually defined curved resistance line caps each rally, suggesting consistent seller presence.
Recent candles show clear rejection wicks and small-bodied candles at this level—classic distribution behavior.
Market is compressing under this trendline, hinting at an imminent breakdown.
🔍 MMC Insight: Curved trendlines show passive sell pressure where institutions repeatedly cap price in preparation for a drive lower.
📉 5. Next Target & Volume Burst Area: $101,000 – $102,000
This zone is crucial due to:
Presence of imbalance (inefficiency) left from previous bullish moves.
Likely stop loss clusters from retail long traders.
Historical high-volume node suggesting pending revisit for order rebalancing.
🟨 Yellow Zone = Volume Burst Area: Expected to act as a magnet for price due to liquidity concentration.
🧠 Psychology of the Trap:
📈 Retail Bias: “Bullish triangle breakout means more upside.”
🧠 Institutional Plan: “Use that belief to create exit liquidity, then reverse.”
This is textbook MMC manipulation:
Contract volume to build positions.
Break out to bait liquidity.
Reverse at supply.
Sell into rejection zones.
Trap traders at SR flips.
Drive price to reclaim liquidity at lower targets.
📊 Strategy Plan:
🔻 Bearish Bias Setup:
Entry Zone: $105,200 – $106,000 (candle rejection area)
SL: Above $106,800 (above supply curve)
TP1: $103,000
TP2: $101,000
TP3 (optional): $99,000 for deeper flush
🔁 Flip Bullish if:
Price reclaims $107,000 with momentum and closes above the curve.
Watch for volume confirmation and bullish SMC patterns (e.g., BOS + FVG fill).
⚠️ Risk Management & Notes:
Trade with 1–2% max risk per position.
Let confirmations play out (don't preempt rejection).
Watch U.S. data releases this week (highlighted on chart) – potential volatility triggers.
📌 Conclusion:
Bitcoin’s current behavior is a masterclass in market structure manipulation. Understanding MMC lets us:
Avoid false breakouts
Align with institutional intentions
Trade with probability, not emotion
Expect lower prices unless $106,800 is cleanly broken. The path of least resistance currently points downward toward liquidity zones.
EURUSD Structural Analysis | Curve Breakout to Key Reversal Zone🔍 Structure Analysis:
The EURUSD pair has been exhibiting classic smart money behavior following a reaccumulation phase beneath a curved resistance structure. This curve acted as a dynamic liquidity ceiling, engineered to trap breakout traders during early sessions and encourage early shorts — only to be invalidated later by institutional momentum.
What we now see is a clean structural breakout, a shift in market sentiment, and a precision drive toward premium liquidity zones, where we expect reactions from institutional orders or profit-taking.
📐 Technical Breakdown:
🔹 1. Curved Resistance Breakout (Trend Manipulation Layer)
The curve represents a multi-touch descending resistance line that was gradually compressing price.
Multiple rejections created a false sense of bearish continuation, but in reality, smart money was accumulating positions under the curve.
The final breakout was impulsive and occurred on elevated volume, breaking both the curve and a short-term bearish structure.
🔹 2. Bullish Market Structure Confirmation
Higher highs and higher lows are now clearly established.
After the curve break, the price pulled back slightly, respecting the new trendline support — a sign of retest behavior and continuation.
The previous internal structure break was confirmed after a key swing high was violated, flipping the order flow to bullish.
🔹 3. SR Interchange + QFL Demand Zone
The 1.11800–1.12200 zone held firm during the retracement, previously acting as a strong resistance and now a support flip.
This zone coincides with a QFL-style accumulation base — a concept based on sudden dips into support where big orders are filled before sharp reversals.
Wick rejections and candle closes show strong interest by buyers.
🔹 4. Trendline & Structure Alignment
A clean ascending trendline is acting as dynamic support.
Each touch on the trendline has been followed by bullish expansion — another indication of institutional order flow support.
This trendline also aligns with internal FVGs (Fair Value Gaps), offering more confluence.
🔹 5. Liquidity Magnet: Next Major Zone
The next key area is marked around 1.15500–1.15750, which is a previous structural high, order block, and likely liquidity pool for pending sell-side orders.
This area is expected to act as a magnet, pulling price toward it before a potential reversal or redistribution phase begins.
📊 Trade Management Plan:
Parameter Details
Bias Bullish (Short-Term to Mid-Term)
Entry Zones Retest of trendline or minor FVGs
TP1 1.14500 (interim supply)
TP2 (Main) 1.15500–1.15750 (major liquidity zone)
SL Below 1.11800 (invalidates bullish idea)
RR Target 1:2.5 to 1:3 depending on entry precision
🧠 Concepts Applied:
Smart Money Concepts (SMC)
Break of Structure (BOS) & Change of Character (CHOCH)
Curve Manipulation / Compression
SR Flip (Support-Resistance Interchange)
QFL (Quasimodo Failure Level)
Trendline + FVG Confluence
Liquidity Pool Targeting
Volume Expansion Breakout Confirmation
🛎️ Watchlist Notes & Trade Expectations:
Expect short-term pullbacks into the 1.13000–1.13200 zone for liquidity re-tests.
Watch for reaction or sweep near 1.15500 — this is where short-term sellers may enter, and institutions may offload.
If price holds above the trendline and consolidates near the high, a continuation leg to even higher targets (1.16500) is possible — depending on macro conditions.
✅ Conclusion:
This EURUSD setup is a high-probability opportunity shaped by smart money behavior and deep structural context. The combination of the curve breakout, trendline strength, and liquidity targeting provides a clear roadmap for execution and management.
Use this analysis as a framework — always confirm with price action and risk management aligned with your personal strategy.

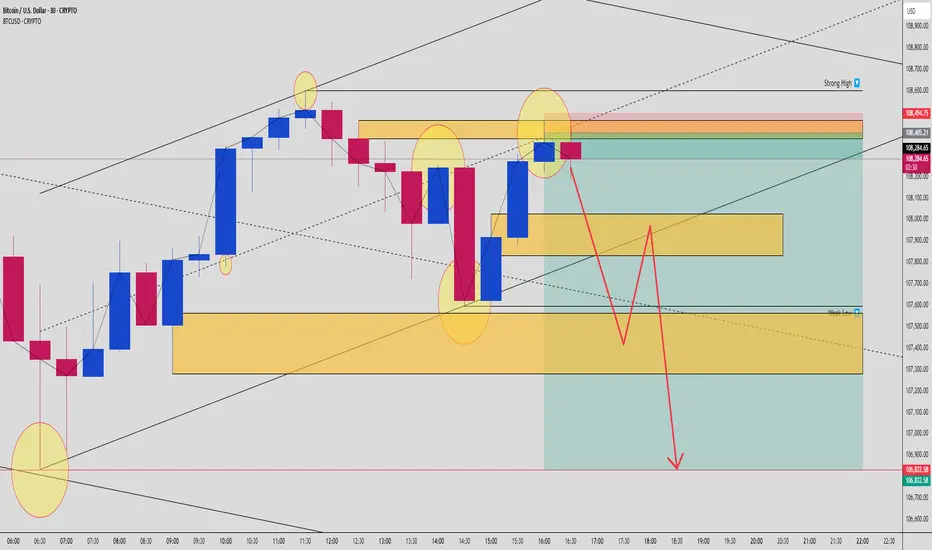
BTCUSD Smart Money Reversal: OB + FVG Trap Targets Weak Lows🚨 BTCUSD Smart Money Concept Alert (30-Min Timeframe)
A classic bearish setup is unfolding on Bitcoin, and it’s screaming trap + reversal for anyone watching closely. Here’s why this could be your high-probability short of the week… 👇
🔍 1. Liquidity Sweep at Key High
We just saw a clean sweep of prior swing highs near 108,400 – a clear signal that Smart Money has hunted liquidity above weak retail stops. That big push into the premium zone? Not real demand. It’s engineered manipulation. 🔧
📉 2. Premium OB + FVG Confluence
Price has just tapped into a juicy confluence zone:
🔲 Order Block @ ~108,400–108,494
🟦 Fair Value Gap (FVG) imbalance sits right below
🎯 All aligning with 61.8–79% Fib retracement from the prior bearish leg
This is where Smart Money institutions enter the party. Look left: it’s the same game played again and again. Trap the highs, fill the imbalance, then dump.
🔄 3. Reversal Evidence Already In Play
A bearish reaction candle confirms rejection from this OB zone. The wick shows aggression – a clear sign of selling pressure stepping in at the premium.
Expectations now shift from retracement to trend continuation toward unmitigated demand zones below.
🧠 4. Weak Low & Liquidity Engineering
Below current price lies a weak low around 107,300 – that’s your magnet. Price needs to sweep that inefficiency, and the structure suggests liquidity vacuum mode is active.
Key zone targets:
🟨 First TP: 107,800 (FVG base)
🟨 Second TP: 107,300 (weak low sweep)
🔻 Final TP: 106,832 (full mitigation zone = 1400+ pip potential)
🎯 5. Execution Plan
💼 Smart Entry:
Entry zone is anywhere from 108,250 to 108,490 (OB + FVG overlap)
SL above 108,600 (structure invalidation)
📊 Targets:
TP1 – 107,800
TP2 – 107,300
TP3 – 106,832
⚖️ RR: ~1:3 or better if executed precisely
🧩 Market Psychology:
This isn’t just technicals. It’s narrative vs. reality.
Retail sees breakout → Long
Smart Money sees sweep → Sell
Retail buys late → Fuel for Smart Money exits
🛡️ Risk Reminder:
Trade the setup, not emotions. Let price come to your zones. Stay mechanical, not emotional. Partial out and trail stops once TP1 hits. Never chase.
✅ Summary:
BTCUSD is showing a perfect bearish Smart Money setup. OB + FVG confluence, strong premium reaction, engineered weak low, and liquidity zones below. Textbook SMC pattern. Play it right, and this setup could deliver clean, high-RR profits.
⚡ Drop a “BTC READY” in the comments if you're watching this one with sniper focus.
🧠 Tag a trading buddy who still thinks we’re in a breakout!
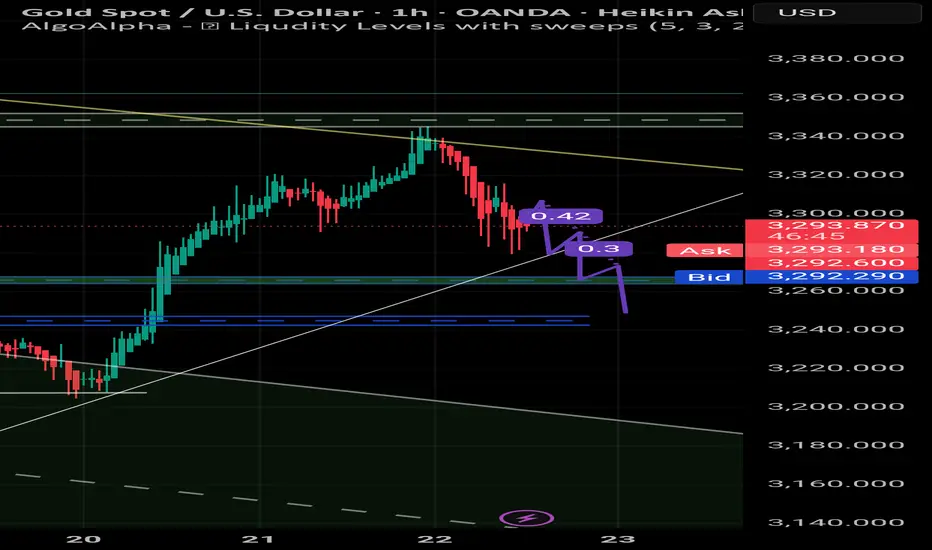
Gold Analysis – Key Sell Opportunity After Trendline Break | XAUGold has shown a significant rejection from the 3340–3350 resistance zone and broke below the ascending trendline. The price is currently retesting the breakout area around 3294, which may act as a new supply zone. Based on current market structure and liquidity behavior, a short position is now favorable.
Trade Plan:
Entry Zone: 3294 – 3300
Stop Loss: Above 3310
Take Profit 1: 3260
Take Profit 2: 3240
Market volatility remains high, and price may hunt liquidity toward the 3240 zone before a potential bounce. Monitor U.S. session volume and possible news catalysts.
Gold Just Tapped the Trap – Ready to Bleed?🧱 Key Smart Money Zones:
Fair Value Gap (FVG) marked in the red zone between 61.8% – 70.5% fib retracement → textbook premium pricing 🧠
Price taps this FVG + OB zone, reacts bearishly → rejection candle confirms Smart Money filled up
📉 Fib Confluence Levels:
100% ➝ Swing High: ~3,234
0% ➝ Swing Low: ~3,204
Entry rejection zone was 3,217 – 3,224 → perfectly aligns with premium range
Price now returning back to equilibrium (50%) and heading toward discount levels (below 0%)
🔻 Bias: Strongly Bearish
Break of structure confirmed (from previous lows)
Rejection from FVG → confirms supply zone held
Large bearish imbalance below → price likely to seek that liquidity
⚔️ Entry Idea:
Entry: After price tapped FVG and printed bearish confirmation
SL: Just above 3,224.37 (FVG top)
TP1: 0% level @ 3,204
TP2: -27% @ ~3,192
TP3 (extended): -50% @ 3,191.25
RRR: 🔥 Easily 1:3+ if managed right
📢 Pro Tip for Ninja Traders:
Don’t chase the first candle — wait for the retrace into imbalance, look for rejection, and ride the wave back into discount zones. It’s all about flowing with Smart Money.
🧘♂️ Psychology Reminder:
"Liquidity creates opportunity. Rejection confirms intent."
Let them buy into premium → we sell with precision 🧠📉

"BTCUSD Smart Money Setup: Fair Value Gap + Weak Highs🚨 Bitcoin (BTCUSD) Smart Money Play Unfolding!
Let’s break down what’s happening on this 15-minute BTCUSD chart and why we could be gearing up for a powerful bullish reversal:
📍 Liquidity Sweep + Market Structure Shift
Price aggressively pushed into a weak low, grabbing liquidity from late sellers and stop orders. Smart Money behavior detected as price forms a potential Change of Character (ChoCH) at a discount zone.
This shift signals a transition from bearish pressure to potential bullish intent.
📍 Fair Value Gap (FVG) as Re-entry Zone
We’ve marked a clean Fair Value Gap (pink box) just below current price action, aligning with the 78–79% retracement zone. Smart Money loves these inefficiencies — they act as magnets for price to rebalance before strong directional moves.
🟣 This FVG is your 1st key zone for entries. If price respects this, we could see an explosive move toward the buy-side liquidity.
📍 Confluence: Fibonacci + Imbalance
Notice how this FVG perfectly aligns with the Fibonacci Golden Zone (70.50–79.00%). This adds extra confluence that this area could act as a powerful springboard for long positions.
📍 Buy-Side Liquidity & Weak Highs Targeted
Above current price lies a Buy Side Liquidity pool and a marked Weak High, signaling that Smart Money may be targeting these inefficiencies next.
🎯 These are the obvious targets if price reacts from the FVG:
First TP at 104,680
Second TP at 104,887
Optional continuation beyond if price grabs liquidity and breaks structure
📊 Risk-to-Reward (R:R) Play
Entry near FVG with stop just below the Strong Low offers an attractive R:R setup. Targeting the weak high gives a multi-R potential.
🟢 High probability setup if price shows bullish reaction (engulfing, BOS) in the FVG zone.
🧠 Smart Money Logic:
Manipulation ✅
Imbalance/FVG ✅
Liquidity Grab ✅
Structure Shift ✅
Clean Targeting of Buy Side Liquidity ✅
This is a textbook SMC long setup in development.
⚡ Game Plan:
Wait for confirmation in the FVG zone (e.g., bullish engulfing or BOS on lower TF).
Set longs with tight stop below 103,535 (Strong Low).
Secure partials at first TP and trail for extended target.
🚨 Risk Management Reminder:
Stick to your trading plan.
Let price come to you.
Never risk more than you can afford to lose.
✍️ In summary:
BTC is sitting at a beautiful discount level with a clear inefficiency to fill. If Smart Money reacts here, we’re looking at a smooth climb into higher liquidity zones. This could be the cleanest setup of the day — if you know how to play it right.
💬 Comment “BTC READY” if you’re planning to enter this setup!
👥 Tag a crypto buddy who needs to see this!

"XAUUSD Double Setup After Massive Manipulation! 200+ Pips"🚨 Gold (XAUUSD) Smart Money Play Unfolding!
Here's a clean breakdown of the current structure and why this could be a high probability setup:
🔥 First, notice the manipulation zone — classic Smart Money move where liquidity was grabbed aggressively before a shift in market structure. This sets the stage for a bigger play.
📉 Change of Character (ChoCh) confirmed after the sweep, showing clear intent for price to reverse. This is the first signal that buyers are losing control and sellers are stepping in.
📍 First Key Area: Fair Value Gap (FVG)
Price is now retracing into the FVG.
This is our 1st Entry Setup opportunity.
High R/R setup if rejection happens around this level.
📍 Second Key Area: Order Block (OB)
A stronger zone for deeper mitigation.
If price pushes through the FVG, this OB becomes a prime entry spot.
This is the 2nd Setup for another potential short entry.
🏹 Targets and Pip Count:
Immediate target zone offers around 211 pips from the first setup.
Deeper target from second setup offers up to 253 pips move.
🧠 Market Structure & Psychology:
After manipulation, Smart Money always seeks to rebalance inefficiencies (FVG) and mitigate institutional orders (OB).
Weak lows created will likely be swept to fuel the bigger move down.
Multiple liquidity pools above and below current price hint at another round of liquidity hunting.
⚡ Game Plan:
Monitor price action reaction around FVG for short triggers.
If broken, reposition entries at the OB zone.
🚀 Risk Management Reminder:
Always use calculated risk per trade.
Don't chase; let price come to your zone.
Protect capital first, then maximize profits.
✍️ In summary:
This setup shows classic Smart Money Concepts in action: manipulation, structure shift, FVG, OB mitigation — all aligning for a clean bearish move. If executed with patience, this could be one of the smoothest setups of the week!
➡️ Comment "GOLD READY" if you’re stalking this setup with me!
➡️ Tag your trading buddy who needs to see this!

Long AUDUSDCurrently bullish on AUDUSD, I have 2 TP points in mind. I'm seeking liquidity above 0.67300 and 0.68800. We've swept the buy stop liquidity levels below 0.64500 and now I'm expecting price to target sell stop liquidity levels. Currently 40 pips in profit with a total profit take of 256, SL set to breakeven, risk free trade. Let's see how this plays out over the coming weeks. Good luck Traders, if you see something similar or different feel free to share!

Liquidity Hunt PatternLiquidity Hunt Pattern
Uncover Hidden Opportunities in the Market
Introduction:
The Liquidity Hunt Pattern is a powerful technical analysis tool that helps traders identify potential turning points in the market. By understanding how this pattern forms and its implications, traders can gain an edge in uncovering hidden opportunities and making informed trading decisions.
What is the Liquidity Hunt Pattern?
The Liquidity Hunt Pattern is characterized by a series of price movements that create a distinct "W" or "M" shape on the chart. This pattern forms when large institutional players, known as "liquidity providers" enter the market to buy or sell large quantities of assets. Their actions create temporary imbalances in supply and demand, leading to price swings that can be exploited by astute traders.
Identifying the Pattern:
The Liquidity Hunt Pattern consists of three key elements:
The "W" or "M" shape: This is the most recognizable feature of the pattern and is formed by a series of price swings that create the distinctive letter shape.
Volume spikes: The pattern is often accompanied by significant volume spikes, indicating the presence of large institutional activity.
Breakout or breakdown: The pattern typically resolves with a breakout or breakdown, signaling a potential change in the market direction.
Trading the Liquidity Hunt Pattern:
Traders can use the Liquidity Hunt Pattern to identify potential entry and exit points for their trades. By understanding the dynamics of the pattern, traders can:
Anticipate potential turning points: The pattern can signal potential reversals or continuations in the market trend.
Identify high-probability trading setups: The pattern can be used to identify areas where the risk-reward ratio is favorable.
Manage risk effectively: The pattern can help traders set stop-loss and take-profit levels to manage their risk exposure.
Conclusion:
The Liquidity Hunt Pattern is a valuable tool for traders of all levels. By understanding its formation and implications, traders can gain an edge in the market and uncover hidden opportunities for profitable trades.

BTC: Short-Term Liquidity Hunt Before Bear Trap and DropBitcoin (BTC) is currently positioned for a short-term move targeting liquidity above the current highs, potentially luring in bears. This setup suggests a liquidity hunt, followed by a rebound from the heavily traded area, and then a push towards higher liquidity zones beyond the recent highs. It appears to be a tactical move to trap bears before a significant downturn. While the short-term outlook hints at a bullish trap, my global perspective remains bearish, anticipating a more substantial short position post-liquidity grab around the $44K level, possibly even higher. www.coinglass.com

BTC/USD where is the moneh?The moneh (moneh = $ = liquidity = equal highs and lows)
Use the moneh to find
- Entry positions (expected stop hunt)
- Exit positions (equal highs and lows)

Stop hunt. Bulls dead?Maybe, let's see how H4 and D1 plays out
I wouldn't wanna see an H4 close above 44.5k

Liquidity - How to easily spot it!Here's how you can easily use liquidity to create wealth 🤑
Knowing how to identify liquidity is an important aspect of trading that shouldn't be overlooked, BUT contrary to popular belief, it's not the greatest thing since sliced bread...
It does have its significance and it's place, but understanding WHY "liquidity" is formed is more important than the WHERE ...
Once you know why, you can slay hard every single day!
Follow me for more educational posts and market analysis:)
Anyway, that's all for now,
Hope this post helps and as usual...
Happy Hunting Predators
🦁🐯🦈

EUR/USD Buy Limit - London OpenWe have a liquidity hunt on London Open with price confirming a bullish reaction. Buy Limit set on the imbalance of the bullish engulfing candle for a potential 1 to 3 risk-reward ratio. Let's see if we get filled. If price hits target without getting us filled I'll remove the limit order

🤓 🤓 DON'T TRADE FROM THIS ZONE!I have tried to make this example as simple as possible to understand for anyone that are not too familiar with liquidity hunts.
Always look for were the most liquidity is accumulating then place your trade above or below were there has been a liquidity swoop, as long as it lines up correctly with what strategy you are using.
If you add this to your trading tool belt this will improve your overall results.

BTCUSDT wants liquidity from 23k
The price is testing the monthly support on the 0.618 Fibonacci level.
The Market has two demand zones.
The first one between 30k and 20k, and the price could grab the new liquidity around the 23k for the reverse trade.
The second one is between 16000$ and 12000$.
How approach on it?
If the price is going to grab the new liquidity from the 23k demand zone, we could see a new pullback after a new breakout of 30k. According to Plancton's strategy , we can set a nice order
–––––
Keep in mind.
🟣 Purple structure -> Monthly structure.
🔴 Red structure -> Weekly structure.
🔵 Blue structure -> Daily structure.
🟡 Yellow structure -> 4h structure.
–––––
Follow the Shrimp 🦐

BTC Daily, The Next Plan of Attack!BTC Daily looking really good, We put in a new high and filled in the imbalance on the 1h/4h chart. So I am expecting BTC to make another small move higher before retracing back to an old low, clearing out some Stop Losses and then moving higher. There is a strong area of buyside liquidity above the equal highs as shown in chart, so that is too good of an opportunity for the MM's to miss.
The daily Imbalance needs filling too, so I think there is a high chance we have another leg up before a retracement.
But... be aware that we may not get the retracment and we could continue to push through and attack all the old highs heading up to 69k. There is very nice daily trading volume which is a solid indication of the demand to buy and sell BTC. These are all healthy signs to me along side the healthy move higher we just had before the Imbalance occured.
I think that's enough said.

Potential Schematic Almost Complete!Gold - Potential Distribution Schematic almost complete,
I'm waiting for NYSE open for price to maybe have one more upthrust into the LTF imbalance (Zone marked on chart) before quickly dropping below the BC and then breaking to the downside, this could be a very nice trade, let's keep an eye on it and see!
Let me know your thoughts!
* Disclaimer **
These ideas I never trade until the end target with my initial lots, I focused on high probable entries with higher lots and use a specific partial taking strategy giving me a very high win rate and take most of my profits very early, I only leave a small % of my capital to run the entire trade. On the flip side im constantly monitoring LTF momentum and will close early if things change, these analysis's are for research purposes only.

Shark Almost Complete x2 Potential entries for Gold when price comes back down, price missed the first shark D leg by 7 pips and reacted from the OB slightly above,
I'm now predicting either a bounce from the .886 or the 1.13..... Because price came so close to the .886 I'm predicting a liquidity hunt now from gold and the 1.13 shark D point to be tapped before continuing upward.
Whats your thoughts?

$BTC - Smart Money Technique- Long at Bullish Order Block ***Smart Money vocabulary used so if you are not familiar with Smart Money Technique and you must understand that there is no Supply and Demand, the chart is controlled by an algorithm. Period. If you do not believe that or have an open mind into believing that, you will have a hard time understanding Smart Money Technique. This is what the Big guys with the money don't want you to know that it's an Algorithm****
-SHORT TERM TRADE
53093 IS WHERE THE BULLISH ORDER BLOCK BEGINS, STOP LOSS JUST BELOW THE CANDLE. It could possibly reach to the bottom of the fair value gap at 52844 before moving higher. So if you want to put a s/l there use lower risk, higher risk at the closer stop loss. and then if it hits the stop loss wait until it gets to the bottom of the 15 min fair value gap. It's going to attack the liquidity resting above the short swing highs at 54750. Then it may bounce back from a bearish order block notated by the redlines above (55,100 or 55220) But there are equal highs as well at 55,220 where liquidity maybe resting and there is a redeliver-rebalance candle, tht is the current high skinny candle which creates sort of a incognito gap for the algorithm, th fat bullish candle next to it is that gap and that's where price wants to go first. Once it gets there it may consolidate, retrace even, or just shoot straight up to the top of the 4 hour fair value gap notated by the green box at the top 56011.0,
so thats my short term trade
from 53093
to 56011.0
P.S. It could appear as if it is going up off the the top of the fair value gap, it may hit a bearish order block first then come back down to the 53093. If it goes up and does come back to the bullish order block, well then I missed out on the trade, but I'm waiting specifically for it to come back to the bullish order block
Please forgive my chart, I know it's not the cleanest thing in the world, but you have to keep track of al the little nuances in Smart Money Technique to get it right
