NAS100USD: Bearish Confluence Builds as Market WeakensGreetings Traders,
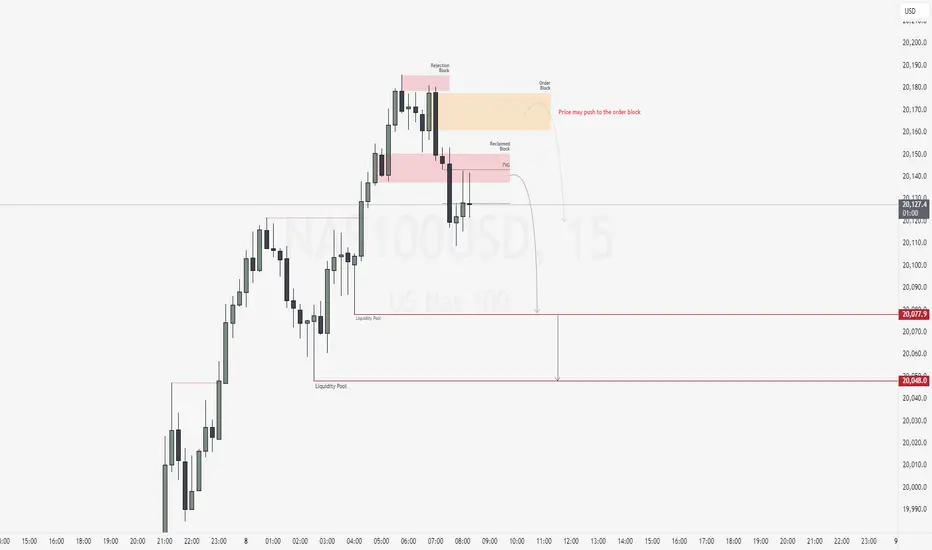
Despite the broader bullish context on NAS100USD, current confluences suggest a potential short-term move to the downside. As we enter the New York session—with a key news release on the horizon—we anticipate heightened volatility. The critical question now becomes: where is price most likely to draw?
Key Observations:
1. Shift in Market Structure:
Price failed to break above the previous high and instead formed a lower high, signaling weakness and suggesting a possible reversal. This lower high, marked by multiple rejection wicks, forms what we identify as a rejection block—a zone often used by institutions to initiate sell orders.
2. Displacement and Bearish Arrays:
Following this rejection, the market displayed strong displacement to the downside, confirming a market structure shift. This supports the likelihood of bearish continuation and increases the validity of bearish institutional arrays holding as resistance.
3. Current Zone of Interest:
Price is now trading within a fair value gap (FVG) aligned with a reclaimed order block—a strong confluence area for potential bearish continuation. Just above this zone lies a bearish order block and another FVG, which may act as a secondary resistance should price wick higher before moving down.
Trading Plan:
Wait for confirmation at the current resistance zones before considering entries. If validated, look to target the liquidity pools resting at lower, discount price levels.
Stay patient, trade with precision, and let the market confirm your idea.
Kind Regards,
The Architect
Liquiditypool
NAS100USD: Bearish Setup Builds as Price Retests Key Supply ZoneGreetings Traders,
In today’s analysis on NAS100USD, we continue to observe bearish institutional order flow, and as such, our objective is to align our trading opportunities with this directional bias.
Key Observations:
1. Bearish Break of Structure and Retracement:
Following a clear bearish break of structure, price has retraced into a mitigation block. This zone represents an area where institutional buying previously occurred. As price trades back into it, institutions often mitigate those earlier positions and reintroduce sell-side interest—offering us an opportunity to follow their lead.
2. Confluence at the Mitigation Block:
The mitigation block is further reinforced by the presence of a bearish order block, adding strength to the resistance zone. This alignment suggests the area may serve as a high-probability reversal point for bearish continuation.
Liquidity Sweep Scenario:
There remains a possibility that price may take out nearby buy-side liquidity (buy stops) before continuing downward. If this occurs, we will wait for confirmation before entering short positions, maintaining alignment with the overall bearish narrative.
Trading Plan:
Upon confirmation of rejection at the mitigation zone, we will seek to engage in short setups targeting liquidity pools in discount pricing zones.
Remain patient, disciplined, and ensure each trade aligns with your strategy.
Kind Regards,
The Architect

NAS100USD: Bullish Scalping Opportunity from SupportGreetings Traders,
In today’s analysis of NAS100USD, we identify bullish institutional order flow, and as such, we aim to align with this narrative by seeking buying opportunities.
This setup presents a scalping opportunity on the lower timeframes, with price currently reacting to a bullish order block serving as a key institutional support zone. Upon confirmation, we anticipate a move toward the liquidity pool in premium pricing, which will serve as our target zone for profit-taking.
As always, remain disciplined, wait for clear confirmation, and manage risk accordingly.
Kind Regards,
The Architect

XUAUSD SETUP: Long position I'm looking forward for the market to grab Liquidity below the Low Of The Week .After the market grabs the liquidity below , I'm anticipating a long position to break the high of the previous week.

NAS100USD: Bullish Continuation from Reclaimed SupportGreetings Traders,
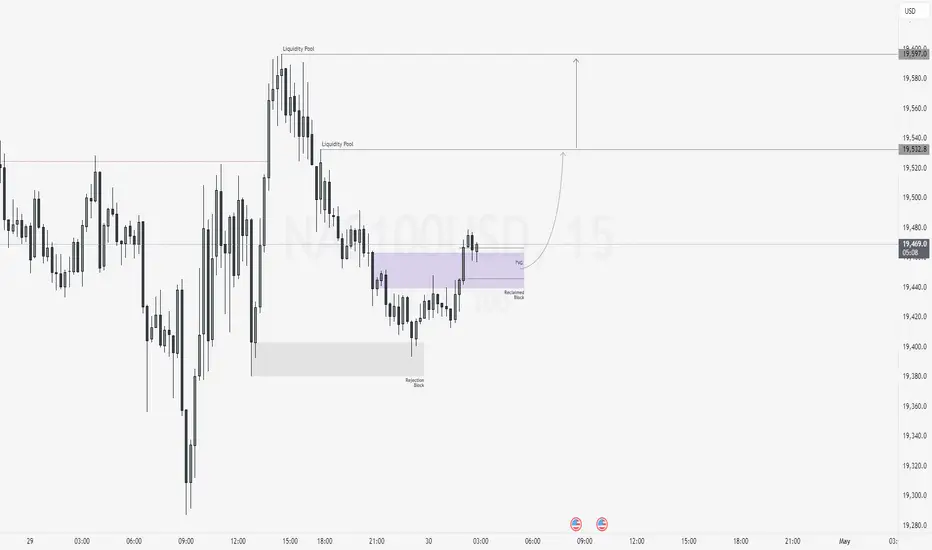
In today’s analysis on NAS100USD, we identify ongoing bullish institutional order flow, and as such, we aim to align our trading opportunities with this upward bias.
Key Observations:
1. Retracement and Institutional Support:
Recent price action shows a healthy retracement, with price finding institutional support at the rejection block. This was followed by strong displacement to the upside, resulting in a bullish market structure shift. This suggests the retracement may be complete, with further bullish continuation likely.
2. Reclaimed Order Block as Key Support Zone:
Currently, price is approaching a reclaimed order block—a zone where institutions previously initiated buying before price traded higher. When price returns to this area, institutions often reclaim the zone to initiate new long positions. This reclaimed block is further strengthened by the alignment with a fair value gap (FVG), enhancing the zone’s validity as institutional support.
Trading Plan:
We will monitor this reclaimed FVG zone for confirmation of bullish intent. Upon confirmation, we will look to enter long positions targeting liquidity pools in premium pricing zones, where buy-side liquidity is likely to reside.
Stay disciplined, wait for confirmation, and ensure the idea aligns with your broader strategy.
Kind Regards,
The Architect
NAS100USD: Institutional Selling Initiated at Premium LevelsGreetings Traders,
Today on NAS100USD, the market is currently operating within a clear bearish institutional order flow. In alignment with this directional bias, we are seeking selling opportunities supported by several key confluences.
Key Observations:
1. Liquidity Sweep at Premium Pricing:
Price has retraced deeply into a premium zone, sweeping the buy stops above a recent swing high. This suggests smart money is executing sell-side order pairing at extreme premium levels, utilizing retail liquidity for institutional distribution. When this occurs, price typically seeks rebalancing at fair value zones and continues toward discount levels.
2. Resistance at Fair Value Gap:
Following the liquidity sweep, price encountered resistance at a previously identified fair value gap (FVG). This FVG has held effectively, reinforcing the bearish outlook and acting as a high-probability rejection zone.
3. Market Structure Shift (MSS):
The market has now confirmed a bearish market structure shift, further validating the downside bias. This shift positions us to anticipate a continuation move.
4. Mitigation Block as Entry Zone:
We are currently watching a mitigation block for potential re-entries. These blocks represent zones where smart money mitigates previous long positions and introduces new short positions in alignment with the prevailing trend. If confirmed, they offer a strategic point to enter short trades.
Trading Plan:
Monitor the mitigation block for confirmation and look to enter with the broader institutional trend. Targets will include fair value regions and deeper liquidity pools at discount prices.
Remain patient and disciplined, and always ensure your analysis aligns with your trading plan.
Kind Regards,
The Architect

NAS100USD: Reclaimed Order Block Signals Further DownsideGreetings Traders!
In today’s analysis of NAS100USD, we observe a momentary shift into bearish institutional order flow, confirmed by the formation of successive lower lows. This structural development signals the potential for continued downside movement.
Key Observations:
Bearish Institutional Order Flow:
The consistent break of lows supports a bearish bias, providing a framework for seeking short opportunities in alignment with institutional intent.
Confluent Bearish Arrays:
Key bearish arrays—including the mitigation block and a reclaimed order block—are currently aligned. These zones, if respected, could serve as strong resistance and provide high-probability entry areas for short positions.
Trading Strategy:
Should price retrace into these arrays and provide confirmation, we can look to enter sell positions with the expectation of further downside aligned with the prevailing order flow.
Stay disciplined, remain patient, and trade only with confirmation.
Kind Regards,
The Architect

LINK’s Swing Setup Could Push Past $15LINK bounced right off the $10 mark, charging upward toward the monthly open before slamming into resistance around $13.25. But now what?
Let’s break it down — because the next high-probability setup is taking shape, and it’s one you don’t want to miss.
The Current Situation:
LINK is:
Below the Point of Control (POC) of this trading range (~$11.35).
Below the monthly open at $13.5.
Still in a bearish trend on the 4H, showing lower highs.
Facing decent rejection from the monthly level.
We’re currently trading below the weekly open at $12.62, now sitting right on the Value Area Low (VAL) at $12.36. That puts us in a precarious spot and sets the stage for the next move.
Bearish, bearish, bearish. When bullish sir? Staying patient and waiting for a real shift in market structure is key.
The Bearish Play: Liquidity Grab Incoming?
There’s a liquidity pocket waiting below at $11.68, the most recent swing low. If LINK loses VAL and bearish pressure kicks in, this becomes the next logical target.
But here's where things get interesting...
The Bullish Setup: Confluence-Backed Long Opportunity
This isn’t just any random support zone — there’s a perfect confluence stack forming:
Swing low: $11.68
Daily support level: $11.45
Weekly support level: $11.28
POC of trading range: ~$11.35
0.618 Fibonacci retracement lands in this zone as well
That’s four layers of support in one tight cluster. This is where we want to scale into longs.
The Play: Scaling In
Entry: Ladder long positions from $11.68 down to the 0.786 fib (near $11.2)
Stop Loss: Below $10.35 for invalidation
Target: 0.786 fib retracement of the previous downward wave at ~$14.5
R:R: Approx. 3:1, with a potential +30% gain
The trend remains bearish but the chart is setting up a prime reversal zone. Patience is key here.
🔔 Set alerts. Watch for volume spikes. Look for SFPs or bullish engulfing candles etc.
The next move on LINK could offer one of the best swing setups especially since this trade could extend past the $15 mark, putting you ahead of the curve.
💬 Found this helpful? Drop a like and comment below. Want TA on another coin? Let me know and I’ll break it down for you.
Happy trading everyone! 💪

NAS100USD: Will Price Fill the Gap?Greetings Traders!
In today’s analysis of NAS100USD, we observe that the market is currently operating within a broader bullish institutional order flow. However, recent price action has left behind an inefficiency—a gap that may serve as a short-term draw on liquidity.
KEY OBSERVATIONS:
1. Gap in Price – Inefficiency Identified:
Price has created an imbalance that is yet to be filled. Typically, such inefficiencies act as magnets for price, drawing it back before resuming its primary trend. In this case, the gap may be partially filled as the market seeks equilibrium.
2. Draw on Liquidity – Last Point of Efficiency:
The last point of efficiency below current price levels may serve as the draw on liquidity. This level could attract price action as institutions look to rebalance orders and facilitate continuation.
3. Active Order Block – Potential Entry Zone:
Price is currently testing a bearish order block. Upon confirmation, this area may offer a short-term selling opportunity with the objective of targeting the liquidity pool and the inefficiency below.
TRADING PLAN:
Entry Consideration:
Look for bearish confirmation within the current order block zone before entering. The goal is to trade the short-term retracement within a bullish environment.
Profit Targets:
Target the liquidity pool and the unfilled gap near the last point of efficiency as short-term objectives.
Remain diligent, patient, and aligned with your trading plan. Always conduct your own analysis to ensure any setup is in harmony with your strategy and risk tolerance.
Kind Regards,
The Architect

NAS100USD: Bearish Bias Expected to Hold After RetracementGreetings Traders!
In today’s analysis of NAS100USD, we maintain a bearish outlook despite short-term bullish movements in price action. These bullish signs appear to be corrective and in alignment with institutional objectives to rebalance inefficiencies created during yesterday’s sharp decline.
KEY OBSERVATIONS:
1. Inefficiency Rebalancing Completed:
Price has retraced to fill fair value gaps left behind by recent downside volatility. With those inefficiencies now rebalanced, we anticipate a continuation of the dominant bearish institutional order flow.
2. Buy Stops Taken – Institutional Order Pairing:
The sweep of buy stops confirms liquidity collection for institutional sell-side positioning. This aligns with a classic distribution phase, where institutions utilize buy-side liquidity to enter short positions.
3. Institutional Resistance – Rejection Block:
Price is currently reacting at a key institutional resistance zone, known as the rejection block. This zone, formed prior to the latest downside move, may act as the final area of resistance before renewed bearish continuation.
TRADING PLAN:
Entry Consideration:
Monitor price behavior at the rejection block. Upon confirmation, this area offers a high-probability setup for short entries.
Profit Targets:
Focus on targeting liquidity pools resting at deeper discount levels. These areas represent logical destinations for price based on institutional order flow dynamics.
Remain diligent and patient in your execution. Let the market confirm the direction before committing to a position.
Kind Regards,
The Architect

NAS100USD: Bearish Momentum Likely to Extend in NY SessionGreetings Traders!
At present, NAS100USD continues to reflect clear bearish institutional order flow. This is evidenced by the consistent formation of lower lows and the way bearish arrays—such as fair value gaps and order blocks—continue to hold as effective resistance zones.
Key Observations:
Sustained Bearish Structure:
The market has maintained a downward trajectory, with each rally being absorbed by bearish arrays. This behavior reinforces the dominance of institutional selling pressure.
High Volatility Window – New York Session:
With the New York session now underway, heightened volatility is expected. This presents a favorable environment for bearish continuation trades, particularly if price respects the key supply zones.
Trading Strategy:
Entry Consideration:
I am awaiting a retracement into a key bearish array—either a fair value gap or a bearish order block. Upon confirmation of rejection from these zones, I will seek to enter short positions.
Profit Targets:
The primary objective will be to target liquidity pools residing at lower discount levels. These areas represent external liquidity where institutional participants are likely to complete order execution.
By aligning with the prevailing bearish institutional narrative and waiting for high-probability confirmations within premium zones, we can strategically position ourselves to benefit from further downside momentum during this high-impact session.
Kind Regards,
The Architect

What Is a Liquidity Sweep and How Can You Use It in Trading?What Is a Liquidity Sweep and How Can You Use It in Trading?
Mastering key concepts such as liquidity is crucial for optimising trading strategies. This article explores the concept of a liquidity sweep, a pivotal phenomenon within trading that involves large-scale players impacting price movements by triggering clustered pending orders, and how traders can leverage them for deeper trading insights.
Understanding Liquidity in Trading
In trading, liquidity refers to the ability to buy or sell assets quickly without causing significant price changes. This concept is essential as it determines the ease with which transactions can be completed. High liquidity means that there are sufficient buyers and sellers at any given time, which results in tighter spreads between the bid and ask prices and more efficient trading.
Liquidity is often visualised as the market's bloodstream, vital for its smooth and efficient operation. Financial assets rely on this seamless flow to ensure that trades can be executed rapidly and at particular prices. Various participants, including retail investors, institutions, and market makers, contribute to this ecosystem by providing the necessary volume of trades.
Liquidity is also dynamic and influenced by factors such as notable news and economic events, which can all affect how quickly assets can be bought or sold. For traders, understanding liquidity is crucial because it affects trading strategies, particularly in terms of entry and exit points in the markets.
What Is a Liquidity Sweep?
A liquidity sweep in trading is a phenomenon within the Smart Money Concept (SMC) framework that occurs when significant market players execute large-volume trades to trigger the activation of a cluster of pending buy or sell orders at certain price levels, enabling them to enter a large position with minimal slippage. This action typically results in rapid price movements and targets what are known as liquidity zones.
Understanding Liquidity Zones
Liquidity zones are specific areas on a trading chart where there is a high concentration of orders, including stop losses and pending orders. These zones are pivotal because they represent the levels at which substantial buying or selling interest is anticipated once activated. When the price reaches these zones, the accumulated orders are executed, which can cause sudden and sharp price movements.
How Liquidity Sweeps Function
The process begins when market participants, especially institutional traders or large-scale speculators, identify these zones. By pushing the market to these levels, they trigger other orders clustered in the zone. The activation of these orders adds to the initial momentum, often causing the price to move even more sharply in the intended direction. This strategy can be utilised to enter a position favourably or to exit one by pushing the price to a level where a reversal is likely.
Liquidity Sweep vs Liquidity Grab
Within the liquidity sweep process, it's crucial to distinguish between a sweep and a grab:
- Liquidity Sweep: This is typically a broader movement where the price action moves through a liquidity zone, activating a large volume of orders and thereby affecting a significant range of prices.
- Liquidity Grab: Often a more targeted and shorter-duration manoeuvre, this involves the price quickly hitting a specific level to trigger orders before reversing direction. This is typically used to 'grab' liquidity by activating stops or pending positions before the price continues to move in the same direction.
In short, a grab may just move slightly beyond a peak or low before reversing, while a sweep can see a sustained movement beyond these points prior to a reversal. There is a subtle difference, but the outcome—a reversal—is usually the same.
Spotting a Liquidity Sweep in the Market
Identifying a sweep involves recognising where liquidity builds up and monitoring how the price interacts with these zones. It typically accumulates at key levels where traders have placed significant numbers of stop-loss orders or pending buy and sell positions.
These areas include:
- Swing Highs and Swing Lows: These are peaks and troughs in the market where traders expect resistance or support, leading to the accumulation of orders.
- Support and Resistance Levels: Historical areas that have repeatedly influenced price movements are watched closely for potential liquidity buildup.
- Fibonacci Levels: Common tools in technical analysis; these levels often see a concentration of orders due to their popularity among traders.
The strategy for spotting a sweep involves observing when the price approaches and breaks through these levels. Traders look for a decisive move that extends beyond the identified zones and watch how the asset behaves as it enters adjacent points of interest, such as order blocks. The key is to monitor for a subsequent reversal or deceleration in price movement, which can signal that the sweep has occurred and the market is absorbing the liquidity.
This approach helps traders discern whether a significant movement is likely a result of a sweep, allowing them to make more informed decisions about entering or exiting positions based on the anticipated reversal or continuation of the price movement.
How to Use Liquidity Sweeps in Trading
Traders often leverage liquidity sweeps in forex as strategic indicators within a broader Smart Money Concept framework, particularly in conjunction with order blocks and fair value gaps. Understanding how these elements interact provides traders with a robust method for anticipating and reacting to potential price movements.
Understanding Order Blocks and Fair Value Gaps
Order blocks are essentially levels or areas where historical buying or selling was significant enough to impact an asset’s direction. These blocks can act as future points of interest where the price might react due to leftover or renewed interest from market participants.
Fair value gaps are areas on a chart that were quickly overlooked in previous movements. These gaps often attract price back to them, as the market seeks to 'fill' these areas by finding the fair value that was previously skipped.
Practical Application in Trading Strategies
Learn how liquidity sweeps can be applied to trading strategies.
Identifying the Trend Direction
The application of liquidity sweeps starts with understanding the current trend, which can be discerned through the market structure—the series of highs and lows that dictate the direction of the market movement.
Locating Liquidity Zones
Within the identified trend, traders pinpoint liquidity zones, which could be significant recent swing highs or lows or areas marked by repeated equal highs/lows or strong support/resistance levels.
Observing Order Blocks and Fair Value Gaps
After identifying a liquidity zone, traders then look for an order block beyond this zone. The presence of a fair value gap near the block enhances the likelihood of the block being reached, as these gaps are frequently filled.
Trade Execution
When the price moves into the order block, effectively sweeping liquidity, traders may place limit orders at the block with a stop loss just beyond it. This action is often based on the expectation that the order block will trigger a reversal.
Utilising Liquidity Sweeps for Entry Confidence
The occurrence of a sweep into an order block not only triggers the potential reversal but also provides traders with greater confidence in their position. This confidence stems from the understanding that the market's momentum needed to reach and react at the block has been supported by the liquidity sweep.
By combining these elements—trend analysis, liquidity zone identification, and strategic use of order blocks and fair-value gaps—traders can create a cohesive strategy that utilises sweeps to enhance decision-making and potentially improve trading results.
The Bottom Line
Understanding liquidity sweeps offers traders a critical lens through which to view market dynamics, revealing deeper insights into potential price movements. For those looking to apply these insights practically, opening an FXOpen account could be a valuable step towards engaging with the markets more effectively and leveraging professional-grade tools to navigate liquidity phenomena.
FAQs
What Is a Liquidity Sweep?
A liquidity sweep occurs when large market participants activate significant orders within liquidity zones, causing rapid price movements. It's a strategic manoeuvre to capitalise on accumulated buy or sell orders at specific price levels.
What Is a Sweep Trade?
A sweep trade is a large order executed through multiple different areas on a chart and venues to optimise execution. This is common in both equities and derivatives trading to minimise market impact.
How to Spot a Liquidity Sweep?
Liquidity sweeps can be identified by sudden, sharp movements towards areas dense with orders, such as previous swing highs or lows or known support and resistance levels, followed often by a rapid reversal.
What Is the Difference Between a Liquidity Sweep and a Liquidity Grab?
A liquidity sweep is a broader market move activating a large volume of orders across a range of prices. In contrast, a grab is a quick, targeted action to hit specific order levels before the price reverses direction.
This article represents the opinion of the Companies operating under the FXOpen brand only. It is not to be construed as an offer, solicitation, or recommendation with respect to products and services provided by the Companies operating under the FXOpen brand, nor is it to be considered financial advice.

EURUSD – Rising Wedge Breakdown | FVG in PlayEURUSD has broken down from a Rising Wedge pattern on the 1H timeframe, suggesting a bearish momentum shift after a strong rally. The current price action indicates a likely continuation lower, targeting the Fair Value Gap (FVG) zone and major support near 1.07047.
📊 Technical Breakdown
1. Rising Wedge Pattern
A clean bearish rising wedge formed during the uptrend, with price contracting upward and volatility drying.
The breakdown from this wedge came with strong bearish momentum, confirming the pattern's bearish bias.
2. Fair Value Gaps (FVGs) as Draws on Liquidity
Two unmitigated FVGs lie below current price:
First zone near 1.0780
Second deeper zone near 1.07047, aligning with the projected measured move of the wedge breakdown.
These zones act as magnetic targets for price to fill inefficiencies and collect liquidity.
3. Bearish Retest Structure
Price is currently forming a potential retest of the broken wedge structure, which could provide an ideal short entry opportunity.
Expected continuation downward upon rejection from this retest zone.
🧠 Trade Idea
Entry Zone: After confirmation of rejection near 1.0850 (retest of wedge)
Target: 1.07047 (FVG & measured move confluence)
Stop Loss: Above 1.0885 (above wedge structure)
Risk-Reward: Solid setup with FVG and structure confluence
⚠️ Key Levels to Watch
Resistance: 1.0850–1.0880 (wedge retest)
Support/Target: 1.07047 (FVG fill + structure)
Break back above 1.0900 invalidates the short setup.

Solana: Time to Buy or More Pain Ahead?Solana has been in freefall since peaking at nearly $300 on January 19, 2025, dropping a staggering 61% to $115,47 in just 50 days, currently trading at around $119. A support zone for potential reversals.
The big question now: Is this the time to go long, or is more selling pressure ahead? Let’s break it down.
Key Support & Resistance Levels
Lost Key Level at $120
Solana lost the key support at $120, turning it into a resistance zone. For bulls to regain control, SOL must reclaim this level with confirmation and increased volume.
Next Key Lows to Watch
Below the current price, the next key liquidity zones are at $110 and $105, where buyers may step in.
Major Support Zone – $104 to $96
If selling continues, we have a strong support zone between $104.14 and $96.96, backed by multiple confluences:
Anchored VWAP Support: Taking the anchored VWAP from the 2023 lows at $8, we find it currently aligning near $100, a key psychological level.
Monthly Order Block: On the monthly timeframe, an order block sits right at $100 mark, reinforcing this level as strong support.
2024 Yearly Open: The yearly open from 2024 is at $101.72, adding another layer of confluence.
0.666 Fibonacci Retracement: Measuring from $8 to the all-time high of $295.83, the 0.666 Fib retracement is at $104.14, further strengthening this support zone.
Liquidity Pools: There's a lot of liquidity around the $100 area
Fib Speed Fan Support: The 0.7 Fib speed fan also aligns perfectly with this support zone.
Conclusion: The $104–$97 range becomes a high-probability long entry zone with minimal risk.
Long Trade Setup
Entry Zone: $118 – $97
Stop Loss: Below $95
Take Profit Target: $135
Average Entry: $105 (DCA)
Risk-to-Reward (R:R): a solid 3:1 or better
Strategy & Execution
With SOL already down over 60%, scaling into a long position makes sense. Here's how to do it the right way:
1️⃣ DCA Strategy – Instead of going all in, scale in gradually within the $118–$97 range for a better average entry.
2️⃣ Volume & Price Action – Watch for a spike in volume and bullish price action before adding to the position.
3️⃣ Psychological Level Play – There are likely many buy orders around $100, meaning a bounce before hitting lower support is possible.
Stay tuned for updates as this trade unfolds! 🚀

BNX: After a +900% Rally, What's Next?BNX had an incredible run, skyrocketing +900% in just 19 days, completing a 5-wave Elliott Wave structure and peaking at $1.3333. Since then, the price has been in a downtrend, now approaching the critical $1.00 psychological support level.
Key Support Levels
The weekly open sits at $0.9387, aligning perfectly with the Point of Control (POC) from the previous trading range, making this a crucial level to watch. However, the bigger question remains—where is the next high-probability trade setup?
Liquidity Below $0.8278 – There's a significant liquidity pool just below this low, making it an attractive area for potential stop hunts before a reversal.
0.5 Fibonacci Retracement ($0.7333) – Measuring the full +900% move, the 50% retracement aligns near a key support zone.
Weekly Bullish Order Block ($0.7076) – A historical area of demand, adding further confluence.
1.272 Fibonacci Extension ($0.7250) – Another confirmation of a potential bounce area.
Anchored VWAP from $0.1334 – Currently sitting at $0.6675, this dynamic support strengthens the buy zone.
0.618 Fibonacci Speed Fan – If the price drops towards this level by late February, it could provide additional confluence for a bounce.
Potential Trade Setups
Bullish Setup: If price sweeps $0.8278 liquidity and enters the $0.7333 - $0.7076 demand zone, a long opportunity with confirmation could offer a great risk-to-reward trade.

Will this happen again? Bull run incoming... Im waiting on chipotle at $50
2 key factors to check before:
#1 Liquidity (Circles)
#2 Volumen
Check what happens after you get those 2 together
A CLEAR BULL RUN !
Good luck !

NAS100USD: False Breakout & Institutional Sell ModelGreetings Traders,
In today’s analysis on NAS100USD, we observe a recent bullish shift in price action; however, this appears to be a false break of structure rather than a genuine bullish continuation. The market behavior suggests a classic liquidity raid, clearing buy stops before setting the stage for a potential bearish continuation. Let’s break this down in detail.
KEY OBSERVATIONS
1. Liquidity Raid & Displacement:
Price aggressively pushed above the engineered trendline to clear liquidity resting above it. Following this raid, we observed a strong displacement toward the downside, signaling that smart money likely distributed sell orders against the buy stop liquidity.
2. Premium Price Zone:
Price is currently positioned within a deep premium range, a high-probability zone for institutional traders to initiate sell positions. This premium alignment strengthens the case for further bearish movement.
3. Rejection Block as Resistance:
The market is reacting to a rejection block, which serves as a critical institutional resistance zone—the last line of defense for bearish momentum. This reinforces our bearish bias and offers a potential entry area.
TRADING PLAN
1. Entry Strategy:
Wait for confirmation at the rejection block to ensure a high-probability entry.
Focus on short opportunities in line with institutional order flow.
2. Target Zones:
Aim for discount liquidity pools resting at lower levels. These areas are prime targets for institutional traders to offload positions and take profits.
Conclusion:
By recognizing the false break of structure and understanding the liquidity dynamics at play, we align our strategy with the institutions’ intentions. Patience and precision will be key in capturing this opportunity.
Stay focused and trade smart.
The Architect 🏛️📊

NAS100USD: Rejection Block Signals Potential Liquidity DrawGreetings Traders,
In today’s analysis on NAS100USD, we observe that price is currently reacting to a rejection block, an institutional resistance zone. This offers a potential opportunity to seek short positions, anticipating a minor draw on liquidity to the downside.
The plan is to wait for a bearish confirmation within this zone and target the liquidity pools resting below key lows.
Stay patient and disciplined while awaiting confirmation before executing trades.
Kind Regards,
The Architect

BTCUSD: Short for Delta-Neutrality after buying Spot @ Range-LowLike i mentioned in my previous analysis, BTCUSD is in a range and it might be ignored by the majority that there's no clear knowledge of the range spread. Noone knows, me included.
I just stick to my plan. Check my previous analysis if you want to know the reasons for this idea. Now it's more concrete and it's still worth a try, but if you are a retail trader, you should ignore it because of the leverage being used as well as the lack of experience with delta-neutral trading.
Also it is completely different from a typical HODL- or DCA-strategy. Trend-Followers and Breakout-Traders in general should wait for a more directional BIAS elsewhere because my analysis and trade idea results in a non-directional BIAS.

NAS100USD: Transitioning from Sell-Side to Buy-Side CurveGreetings Traders,
In today’s analysis, NAS100USD has been delivering bearish institutional order flow, characteristic of the sell-side curve. However, bullish institutional order flow is beginning to emerge, indicating a potential shift to the buy-side curve. This creates an opportunity to explore buy setups, provided confluences align with confirmation.
Key Observations:
1. Bullish Order Block as Support:
Price is currently reacting to a bullish order block, which is aligned with a Fair Value Gap (FVG). This confluence establishes a strong institutional support zone.
2. Reclaimed Order Block:
A previously reclaimed order block has been broken to the upside, suggesting that it may now act as support, reinforcing bullish momentum.
3. Discount Pricing:
Price is currently within a discount zone, making it an attractive area to seek buy opportunities with targets at premium liquidity pools.
Trading Plan:
Entry Strategy:
Look for confirmations around the bullish order block and reclaimed order block to justify entering long positions.
Targets:
Aim for liquidity pools at premium levels, such as highs, where institutions are likely to offload positions.
By aligning with the emerging bullish narrative and observing institutional behavior, we can position ourselves to capitalize on this potential market shift. As always, patience and confirmation are key.
Kind Regards,
The Architect

NAS100USD: Structural Weakness Points to Bearish BlueprintGreetings Traders!
In today’s analysis, although NAS100USD maintains a bullish stance, there are signs of potential bearish momentum that may align with minor objectives.
Key Observations:
1. Rejection Block Resistance
Price action is currently held back by a rejection block, signaling a struggle to achieve higher highs. This resistance suggests weakness in upward momentum and the possibility of a shift.
2. Engineered Trendline Liquidity
A trendline liquidity pool has formed below the current price level. With the rejection block preventing further upside, it’s likely that institutions will target this liquidity as the next objective.
Strategy:
By recognizing the structural constraints and liquidity targets, we can prepare for potential bearish moves. The key will be observing confirmation of downward momentum before executing trades.
Let me know your thoughts or share insights in the comments. Let’s refine our strategies together!
Kind Regards,
The Architect

BTC1! short idea with open gap fill and catching a quick longAs you might know, open gaps have a fill-rate of 90-95%. Additionally the open CME-gap (1W-basis) has much confluence with important technical levels for support and it lies in the middle of two zones where enormous amounts of USDT-inflows came into the market.
1. the 2024-range (Q1 - Q3)
2. the 2025-range (Q1 at least)
Where the new neckline also is, the new support that became resistance appeared. It might also be a good strike for smart money to know that above the biggest orderblock of 2024 support has developed more strength and consequence. So why you don't give it a try to retest it?
Here a maximum of buying pressure should lead to a strong bounce of BTCUSD towards a new alltime-high, if and as long as global liquidity rises again. But if not, at least inflation should do half of the bullish job for BTCUSD and a "sideways up" would be my - historically BIASed - expectation.
It begins with a shorter short. In the end it might be a very, very quick longer long because of my expectation of rising buying pressure with huge volume delta for the bulls below 78k.

NAS100USD: Anticipating Bullish Shift in Range-Bound MarketGreetings Traders!
In today’s analysis of NAS100USD, we observe price consolidating within a range. While the overall sentiment remains bearish, I anticipate a bullish reversal aligning with projections from yesterday's analysis.
Key Observations
Discount Price Accumulation:
Price is currently trading at discount levels where institutions have consistently targeted sell stops. These stops are being order-paired (bought against), signaling institutional accumulation in preparation for a move toward premium prices.
Engineered Liquidity Above Resistance:
The Resistance Zone has been identified as Engineered Liquidity, where buy stops (stop losses, pending orders, etc.) reside. This liquidity pool is a prime target for institutions to sell off their positions against willing buyers.
Institutional Profit Targets:
Institutions that accumulate long positions at discounted levels will look to book profits in premium zones, aligning with our strategy to target liquidity pools above the current resistance.
Trading Strategy
Entry Zones:
Focus on buying opportunities at key institutional support levels in the current range, awaiting confirmation of bullish price action.
Targets:
The primary objective is the liquidity pool above the Resistance Zone, as institutions are likely to drive price into this area for profit-taking.
For further insights into the rationale behind this bullish bias, refer to yesterday’s detailed analysis.
Yesterdays Analysis:
Stay vigilant and patient for confirmation before executing trades and make sure to do your own research before investing.
Kind Regards,
The Architect
