DOGE/USDT : eyes More Gains – Mid-Term Targets Up to $0.70! By analyzing the Dogecoin chart on the daily timeframe, we can see that since our last analysis around 7–8 months ago, the price started its rally from $0.10 and surged over 370% to reach $0.48. After that, it corrected back to around $0.13 and is currently trading near $0.27. If Dogecoin manages to hold above $0.25, we can expect further upside movement in the mid-term. The next targets are $0.287, $0.32, $0.41, and $0.70.
Please support me with your likes and comments to motivate me to share more analysis with you and share your opinion about the possible trend of this chart with me !
Best Regards , Arman Shaban
Litecoin (Cryptocurrency)

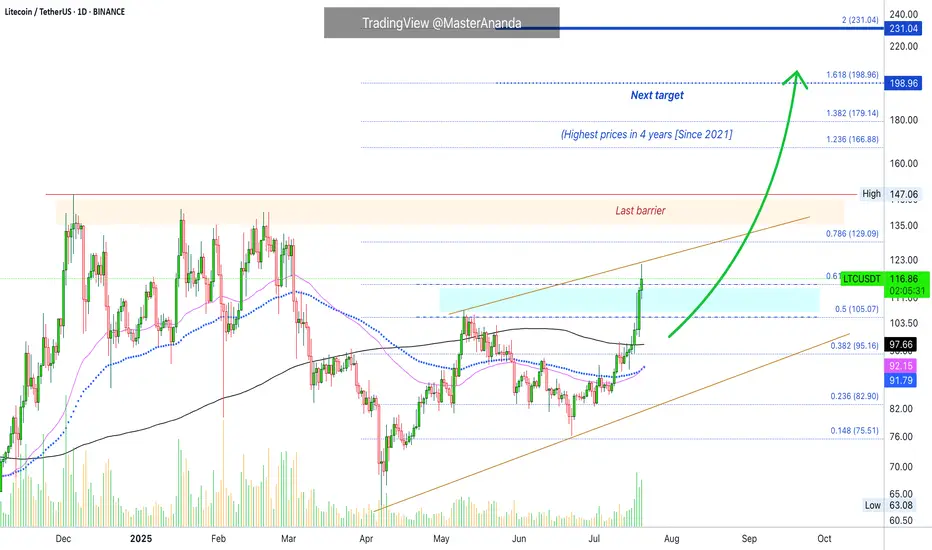
Litecoin's Path Beyond $200 Revealed · Daily TimeframeWe looked at Litecoin on the weekly timeframe which is the long-term picture, but we also need to consider the daily to see what is happening up-close.
As soon as we open this chart we have three signals that stand out:
1) Litecoin is now trading above MA200 safely and rising. This is a very strong bullish development and supports additional growth.
2) Trading volume has been rising significantly being now the highest since February 2025. The difference is that in February we were in distribution, resistance being confirmed with prices set to move lower. In this case, the action is rising from support and volume is rising rather than dropping.
3) May's peak has been broken. Many pairs are still trading below their high in May. Those that broke this level are the ones moving first and this signal exudes strength. Litecoin is now one of the top performers specially in the group with a big market capitalization.
The next barrier is the December 2024 high at $147. Short-term the next target is $129. As soon as the former breaks, we are going to be looking at the highest price since 2021.
Litecoin is fighting resistance today, 0.618 Fib. extension at $115. It is trading above this level but the confirmation only happens at the daily close. If it closes above, bullish confirmed. It if closes below, it means that there will need to be some struggling before higher prices. This struggling can last a few days just as it can extend. Seeing Ethereum and how it is moving straight up, Litecoin is likely to do the same.
Overall, conditions are good for Litecoin on the daily timeframe.
Thank you for reading.
Namaste.
LITCOIN BUY OR SELL !!!Hello friends🙌
🔊According to the price drop, you can see that the price has been below the specified resistance for a while and when it was able to break the resistance, it shows us the power of the buyers. Now, when we return to the previous resistance, which has now become a support, you can see that the buyers are providing good support and the price is expected to move to the specified targets.
Note that the most important rule in trading is capital and risk management So make sure to follow it.
🔥Follow us for more signals🔥
*Trade safely with us*

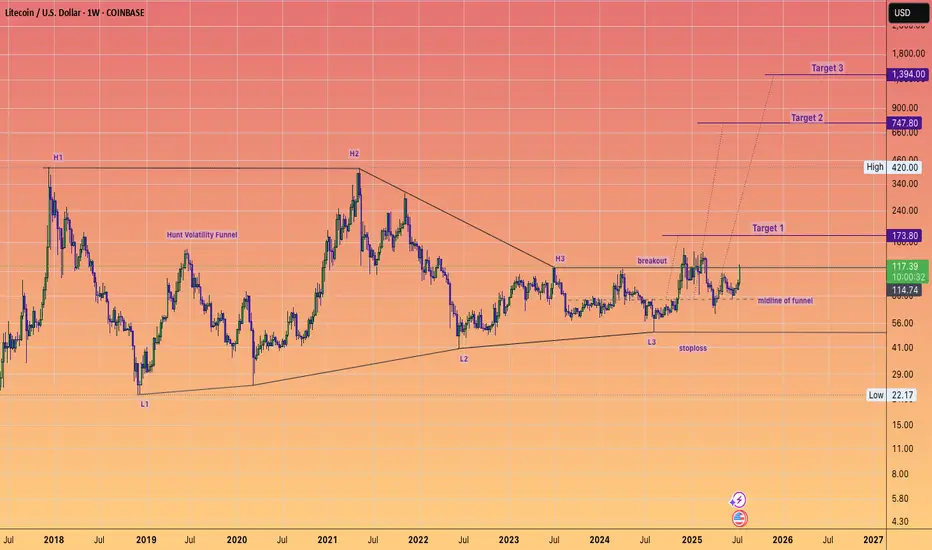
Litecoin has maintained it's HVF and can STILL do a 10X...in the coming years.
This is a massive pattern formed over 7 years and I expect over performance of target 3 ultimately.
The day to week price action really does not matter when you have beautiful setups like this.
Keep stacking at these low prices.
@TheCryptoSniper
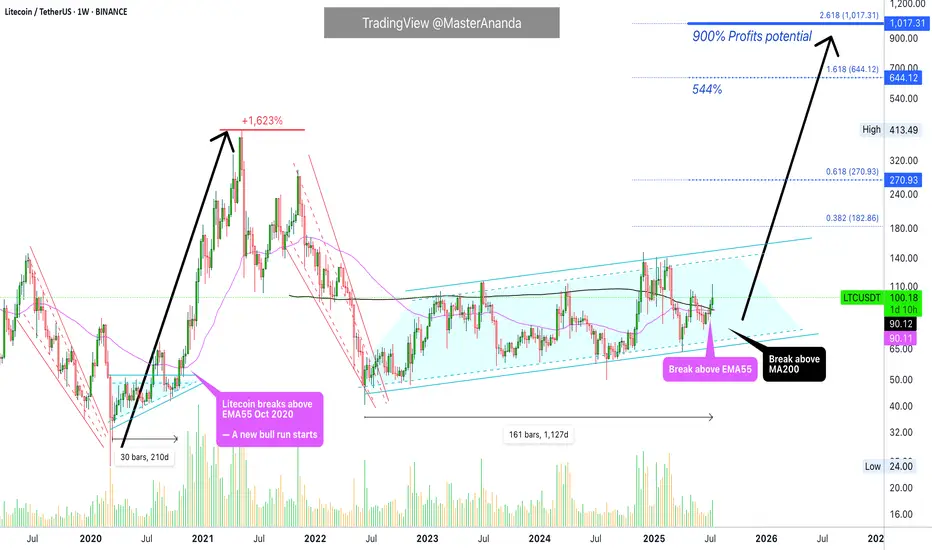
Litecoin $1,000 (900%) ExplainedBack in 2020, just 210 days of consolidation led to a 1,623% strong bull market. How much different market conditions we have now. Since 2022, Litecoin has been consolidating. The length of this consolidation is now 1,127 days. More than five times the previous consolidation and then some.
How much higher can Litecoin go compared to a past period?
How much more growth can a project produce when it has been building strength for so long?
LTCUSDT is now trading weekly above EMA55. When this happened back in 2020, what followed was sustained growth. Straight up, literally, for a period of 203 days. No stops.
Back in 2020, Litecoin moved above EMA55 first in August just to be rejected. The second time was the good one. This year the situation is the exact same. Litecoin broke above EMA55 in May and was rejected. The second time is happening now in July and this is the good one.
Litecoin is also trading above MA200 fully confirmed and there is a golden cross between EMA55 and MA200. We are very close to a major marketwide bull-run.
$644 in this bullish cycle is a high probability target for Litecoin, but prices can go higher, much higher because market conditions continue to improve and institutions will gain access to Litecoin through Exchange-Trade Funds (ETFs). This means that a standard price projection would be a disservice to us. We are aiming for $1,000+ on this bullish cycle but it can end up closing higher of course.
After the new all-time high is hit, it is normal to see a correction or even a bear market. This one should be short and small compared to previous ones. See you at 1K.
Namaste.
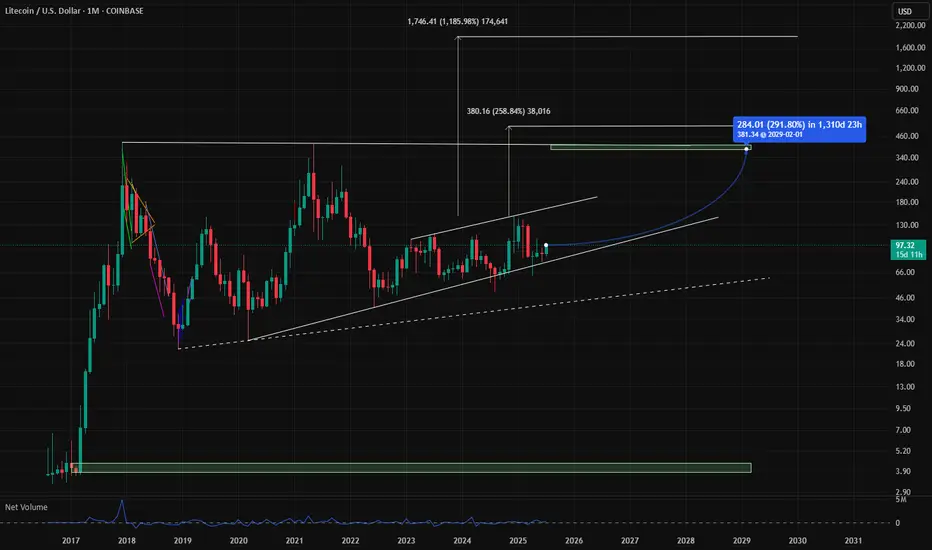
LTC/USD LITECOIN Adam & Eve Pattern On WeeklyThe Adam and Eve pattern is quite effective and usually signals a trend change to bullish. Once this pattern breaks the neckline I think its straight to $200 before any sort of pullback.
Haven't done a chart in a while cause its been the same old stuff, sideways. We are starting to ignite now. Silver is running which means something is breaking in the background financial system. I see the biggest blow off top you've ever seen coming, its the only way out of this, print print print until it doesn't work anymore.
Also I was reading that Bitcoin is removing its cap for spam in each block in October? This could spell disaster for fees and congestion. Litecoin will skyrocket during that time I believe because the fees will be so high it will price out the little guy trying to send a grand or two. I see an influx of people coming to Litecoin. Good luck , none of this is financial advice just my opinion

LTC - Time to buy again! (Update)Finally, this pattern was broken and had a positive impact, leading to significant growth. Now, with a slight price correction, higher price levels can be reached.
PREVIOUS ANALYSIS
Best regards CobraVanguard.💚

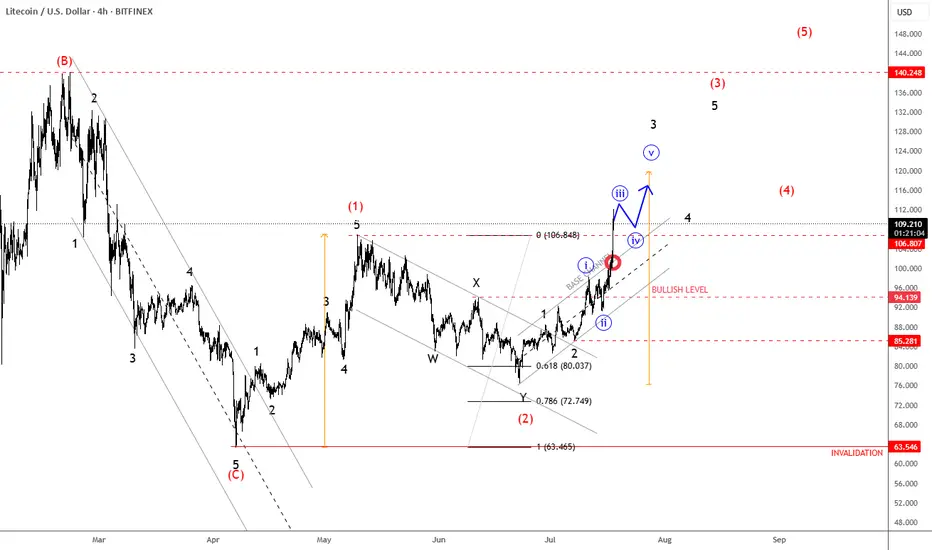
Litecoin Continues Its Bullish Cycle As ExpectedLitecoin Continues Its Bullish Cycle As Expected, which can send the price even higher from technical point of view and by Elliott wave theory.
We talked about Litecoin back on May 30, when we spotted a bullish setup formation with waves (1) and (2) that can extend the rally within wave (3) of a five-wave bullish impulse.
As you can see today on July 18, Litecoin with ticker LTCUSD is now breaking strongly back above May highs after we noticed a complex W-X-Y correction in wave (2). Now that ALTcoin dominance is stepping strongly in, we may easily see more gains within a projected five-wave bullish cycle during the ALTseason, just be aware of short-term pullbacks.
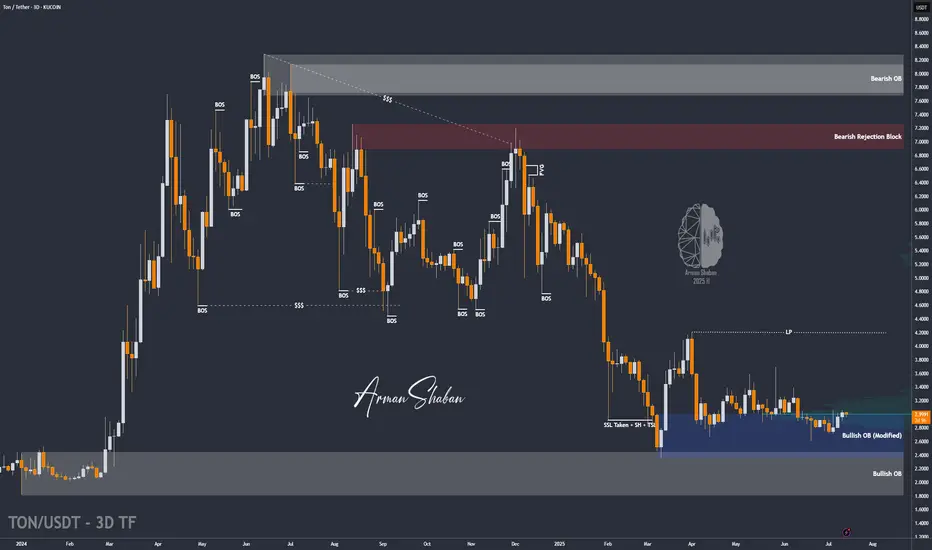
TON/USDT : Get Ready for a new Rally! (READ THE CAPTION)By analyzing the Toncoin chart on the 3-day timeframe, we can see that the price has finally managed to grow over 3% as expected, and is currently consolidating above the $3 level. We’ll have to see how far this bullish momentum can continue — but to be honest, I expected a stronger move considering the market rally and Bitcoin repeatedly hitting new ATHs. Still, no worries — once Bitcoin takes a breather, altcoins will likely begin their powerful runs! Based on previous analysis, the next targets are $3.15, $3.63, $4.20, and $4.68 respectively.
Please support me with your likes and comments to motivate me to share more analysis with you and share your opinion about the possible trend of this chart with me !
Best Regards , Arman Shaban
LTC Targets 400$ + 1900$ Litcoin LTC Targets for the next run are atm +290% is a realistic szenario. The addvanced targets at 1900$ are very impressiv but remember there are only 21 Mio. Coins too, like BTC because it is the fork and think about an alternative payment methode like btc, would be a reason for 1900$ pro LTC. So in Crypto is nothing unreal if you could imagine, but first of all approx. 400$ are a good direction. GM
LITCOIN : So what is an ETF ?Hello friends
Be careful with the recent fluctuations of this coin because the movements of this coin have become unpredictable and we suggest that if you want to buy, buy in the specified support areas and in steps, of course with capital and risk management...
We have also specified targets for you.
*Trade safely with us*

Is This the Perfect Moment to Rob the LTC/USD Vault?🏴☠️ LTC/USD Heist Mode: The Moving Average Break-In Plan 💰📈
🌟Hi! Hola! Ola! Bonjour! Hallo! Marhaba!🌟
Calling all Market Bandits, Crypto Hustlers & Chart Raiders! 🤑💰🚀
🚨Mission Briefing
We’re eyeing a bullish breakout hit job on the LTC/USD chart — all based on the elite 🔥Thief Trading Style🔥 with a touch of candle science, moving average vault-cracking, and some solid day/swing setups. This ain’t your grandma’s trade plan — this is high-level lootin’ with precision.
🕵️♂️ 🎯 ENTRY PLAN — Unlock the Vault at $86.00
Wait for the MA breakout + candle close above that sneaky Moving Average line.
➡️ Execute Buy Stop orders above MA
➡️ OR place Buy Limit during a pullback to swing low/high zones in 15m–30m timeframe.
📌 Pro tip: Set an alert – catch the breakout live, don’t chase it later.
🛑 STOP LOSS — Your Getaway Route
Place your Thief SL near the recent swing low (82.00 using 3H chart).
🎤“If you’re entering like a pro, stop loss goes where it should – not where fear lives. But hey, it's your ride or die. Choose wisely.” 🔥
💡Adjust SL based on lot size, risk %, & how deep your robbery goes.
🏴☠️ TARGET ZONE — Exit the Scene at $92.00
Get your bags packed, profits stacked, and be ready to escape before the market catches on.
💸 Grab the loot and bounce before the reversal gangs arrive!
📈 Why the Heist?
The LTC/USD crypto market is showing bullish momentum, backed by key analysis angles:
🔍 Fundamentals
📊 COT Report
💥 On-Chain Metrics
🧠 Sentimental Heat
🌍 Intermarket Structure
👉 Check your intel. React. Don’t sleep. 🔗🔗
⚠️ News Alert & Risk Tip
🗞️ Stay clear of trades during volatile news releases
🔐 Use trailing stops to lock in gains
🚫 Protect your positions – don't let profits slip through cracks.
📌Disclaimer:
This ain’t financial advice — it’s just a shared plan for market raiders. Trade at your own risk, and don’t forget to bring your own map. Market shifts faster than a getaway car — so adapt & react smartly. 🧠💡
💖 BOOST the Plan 💥
Hit that Boost Button if you're vibin’ with the robbery crew. It powers up the strategy and supports the movement. Together, we trade to take — The Thief Trading Way. 💸💪🎉
🚀 Catch you on the next breakout. Stay sneaky, stay sharp. 🐱👤🤑

When YouTubers Say 'No'… We Say 'LTC Go!'I’m not here to drop some fancy technical analysis today.
I’m here to tell you… this might just be it.
A big, popular YouTube channel just announced they’re not too bullish on Litecoin this cycle.
And guess what? That might actually be our ultimate buy signal.
The chart’s looking bullish now — the trap has been set, and left behind us. 😎
They FUD, We Flood (Our Bags)
Why Litecoin? Beyond its unshakable fundamentals, if you genuinely understand and believe in crypto and digital freedom, Litecoin is the purest expression of that vision
That's it, that's the idea" - Good night !

ADA/USDT : ADA Rally in Motion – Over 20% Gain and More to Come?By analyzing the Cardano (ADA) chart on the 3-day timeframe, we can see that after revisiting the $0.57 zone, the price once again followed the previous analysis and encountered strong buying pressure—rallying up to $0.61 so far.
The return from the previous entry has now exceeded 8%, and the overall gain from the full move stands above 20%.
The next bullish targets are $0.76, $0.93, $1.05, and $1.33.
(A deeper and more detailed analysis is recommended for long-term investment decisions.)
THE MAIN ANALYSIS :

LTC starting wave 3This wave will bring us to the break out level, charts looking fantastic and overall bullish. Btc.d still didn't start to melt and the LTC pair is looking to recover the 0,001 and higher for the run. The LTC run from 4 to 420 lasted around 9 months ,the runs from 40 to 420 lasted around 6 months, if me start running now we have get 6 months till the bull ends... Lets keep our eyes open.

Litecoin to $1100 (12X) In This Coming AltseasonBased on tried and true fractals, multi-fib confluences, and historical price action, Litecoin is poised to hit prices between $900-1500 this cycle. The multi-fib confluences are pointing to $1100-1200 range as the most likely target. This is expected over the next 6-12 months if things continue to play out how I am expecting. As of today SEC approval of a LTC ETF is imminent but yet to be actualized.

#LTC Update #4 – July 10, 2025🔵 #LTC Update #4 – July 10, 2025
LTC was rejected from the fractal resistance left behind during its previous impulsive move. Just below this level lies an imbalance zone, which is likely to be filled first during any correction. If the downtrend continues, price could move toward $88, $87, and $86 levels.
Currently, long positions seem risky. However, a short setup around $91 with a 3% profit target could be an option for risk-takers. I’m personally not opening any trade at this time, but short-term traders may consider it.
On the upside, LTC is still holding above its 200 MA, which is a positive technical indicator. If it manages to hold above $92.30, the next upside target would be around $95.

Altseason, just a thought ! Basically, right now we’re chilling in a major confluence zone — a whole bunch of important levels are stacked right here.
We’ve got:
The 0.78 Fib retracement holding it down
Volume profile support giving us a comfy cushion
That good old accumulation support from 2019–2021 saying “welcome back”
…just to name a few.
IMO, we’re in that sneaky “deviation/manipulation” phase before the real markup begins — a.k.a. altseason is warming up in the locker room.
If we actually hit the bull flag target… well, let’s just say the numbers start looking spicy. But hey, let’s not get ahead of ourselves — things can (and probably will) move faster than you think.
Alright, that’s the vibe. Let’s see how it plays out. Good night! 😴🚀

CLV Clover FinanceIf we do see a bank less world these interoperable plays could be trusts/less providers.
I do believe we will see the world financial system change dramatically in this lifetime and sooner than later.
I've decided today to toss $1,000 into CLV and if it hits that's cool and if it does not.... It does not.
I will roll half my position into LTC if this does giga pump.
THIS IS NOT FINANCIAL ADVICE!!!

Trading balanceTrading balance The price of the asset has rebounded from the balance zone. With the prospect of growth into the resistance zone.

Litecoin:Is the main climb coming?hello friends👋
As you can see, the price, after falling in the support area specified by the buyers, has been supported and returned, forming an upward pattern.
Now we don't enter into a transaction with just one pattern, we also check the entry of buyers and the amount of currency and other factors and draw conclusions.
According to the points we have said, we have identified very important support points for you to buy step by step with capital and risk management and move to the specified goals.
🔥Follow us for more signals 🔥
*Trade with us safely*

LTC, he Hidden Strength Beneath the Retrace Ma dudes, we might just be witnessing something big and beautiful here. 🤌✨
Okay okay, I might sound like a total degen, but hear me out:
✅ Double bottom (check those two green arrows)
✅ Bullish divergence on the RSI
✅ MACD on the monthly just crossed bullish — for the first time ever on this pair!
✅ OBV stayed strong, didn’t collapse even during that nasty monthly retrace
✅ Notice how volume was climbing during the uptrend, but fell off during the retrace? That means the drop lacked real conviction.
We’re also sitting at an ATL (all-time low) — the lowest we've been.
Check out that red arrow pointing at the volume: that's the first sign of a burst. The next bursts? 💥 They should be explosive.
…And that’s just to name a few.
See you somewhere up there 🚀 — once we break through that T1 level, we should start trending higher fast.
That's it, that's the idea" - Good night !

Litecoin vs Bitcoin —The Institutional Wave? Consider the ETFsStarting November 2022 LTCBTC (Litecoin vs Bitcoin) went on a major downtrend, until November 2024. After November 2024 this downtrend is no more.
There was a bounce late last year and this event changed the chart. The latest low last month, June 2025, ended up as a technical double-bottom. Less than 5% below the November 2024 low and this low happened after 217 days. This means that in seven months sellers became exhausted and they couldn't produce a new major low. This reveals that the bearish trend is over. Once the downtrend ends, we get a change of trend, a change of trend implies an uptrend, an uptrend implies long-term growth. We are looking at a long-term bottom and... From the bottom we grow.
This is not an opportunity that presents itself often. The BTC trading pairs are hard to trade. These are for experts only. A new opportunity is developing that can lead to exponential growth. It is amazing how this section of the market works. LTCBTC will grow as Bitcoin and the rest of the market grows. This tends to produce a multiplier effect that is hard to explain. You will understand when you see it in action.
LTCBTC is hitting bottom. The bottom is already established, several weeks old. The candles low is flat, we can expect massive growth; excitement and institutional adoption on Litecoin thanks to the ETFs, it will be the first time this pair grows in years and the type of chart it will produce it is hard to tell.
We are entering uncharted territory. The bullish phase can be mild just as it can be ultra-strong. There is no limit to the upside. It can grow for years or for 4 to 8 months. Both scenarios look good.
The best part is to catch the bottom; an early wave. Prices are low now, easy to buy and hold. Focus on the long-term.
Litecoin has good potential for this incoming 2025 bull market.
Thank you for reading.
Namaste.
